Observational Study
. 2021 Jun;21(6):876-886.
doi: 10.1016/S1473-3099(20)30737-4. Epub 2021 Jan 20.

Factors associated with progression to death in patients with Lassa fever in Nigeria: an observational study

Affiliations
Observational Study

Factors associated with progression to death in patients with Lassa fever in Nigeria: an observational study

Jamie Strampe et al. Lancet Infect Dis. 2021 Jun.

Abstract

Background: Lassa fever is endemic in several west African countries. Case-fatality rates ranging from 21% to 69% have been reported. The pathophysiology of the disease in humans and determinants of mortality remain poorly understood. We aimed to determine host protein biomarkers capable of determining disease outcome.

Methods: In this observational study, we analysed left-over blood samples from patients who tested positive for Lassa fever at Irrua Specialist Teaching Hospital, Nigeria, between January, 2014, and April, 2017. We measured viral load, concentrations of clinical chemistry parameters, and levels of 62 circulating proteins involved in inflammation, immune response, and haemostasis. Patients with a known outcome (survival or death) and at least 200 μL of good-quality diagnostic sample were included in logistic regression modelling to assess the correlation of parameters with Lassa fever outcome. Individuals who gave consent could further be enrolled into a longitudinal analysis to assess the association of parameters with Lassa fever outcome over time. Participants were divided into two datasets for the statistical analysis: a primary dataset (samples taken between Jan 1, 2014, and April 1, 2016), and a secondary dataset (samples taken between April 1, 2016, and April 1, 2017). Biomarkers were ranked by area under the receiver operating characteristic curve (AUC) from highest (most predictive) to lowest (least predictive).

Findings: Of 554 patients who tested positive for Lassa fever during the study period, 201 (131 in the primary dataset and 70 in the secondary dataset) were included in the biomarker analysis, of whom 74 (49 in the primary dataset and 25 in the secondary dataset) had died and 127 (82 in the primary dataset and 45 in the secondary dataset) had survived. Cycle threshold values (indicating viral load) and levels of 18 host proteins at the time of admission to hospital were significantly correlated with fatal outcome. The best predictors of outcome in both datasets were plasminogen activator inhibitor-1 (PAI-1; AUC 0·878 in the primary dataset and 0·876 in the secondary dataset), soluble thrombomodulin (TM; 0·839 in the primary dataset and 0·875 in the secondary dataset), and soluble tumour necrosis factor receptor superfamily member 1A (TNF-R1; 0·807 in the primary dataset and 0·851 in the secondary dataset), all of which had higher prediction accuracy than viral load (0·774 in the primary dataset and 0·837 in the secondary dataset). Longitudinal analysis (150 patients, of whom 36 died) showed that of the biomarkers that were predictive at admission, PAI-1 levels consistently decreased to normal levels in survivors but not in those who died.

Interpretation: The identification of PAI-1 and soluble TM as markers of fatal Lassa fever at admission, and of PAI-1 as a marker of fatal Lassa fever over time, suggests that dysregulated coagulation and fibrinolysis and endothelial damage have roles in the pathophysiology of Lassa fever, providing a mechanistic explanation for the association of Lassa fever with oedema and bleeding. These novel markers might aid in clinical risk stratification and disease monitoring.

Funding: German Research Foundation, Leibniz Association, and US National Institutes of Health.


Conflict of interest statement

Declaration of interests

We declare that we have no conflicts of interest.

Figures
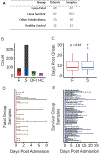
Figure 1.
Figure 1.. Characteristics of study subjects and samples in the Primary Dataset.
A) Table showing the study groups with number of subjects and samples analysed as part of this dataset. B) Graphical illustration of sample numbers for each group. First samples from study subjects are plotted in colour; follow-up samples in black. C) Boxplot showing the distribution of self-reported duration between symptom onset and presentation at the hospital for Fatal and Survivor patient groups. D) and E) Timing and frequency of sampling for fatal (D) and non-fatal (E) LF cases. Each patient is represented as a row on the Y-axis. Day 0 represents the initial diagnostic sample; day 1 and later represent the follow-up samples taken on the LF ward.
Figure 2.
Figure 2.. Association of soluble host proteins and viral load with LF outcome.
A) Rank of predictive power (i.e. ROC AUC value) of a given biomarker determined by deterministic logistic regression modelling using various subsets of the data: (i) Admission Primary: initial (diagnostic) samples in the Primary dataset (see Table S3); (ii) Admission Secondary: initial (diagnostic) samples in the Secondary dataset (see Table S4); (iii) All Patients at Admission: initial (diagnostic) samples in both datasets combined (see Table S5); (iv) All at Peak Viraemia: samples at day of peak viraemia (lowest Ct value) in both datasets combined (see Table S6). The total possible cases for the combined datasets were n=74 fatal LF cases and n=127 LF survivors; the numbers of samples missing for each model are listed in Tables 1 and S2. Full rankings for all significant biomarkers can be found in Table S7. B) Proteins that were found to have significantly different levels between fatal and survivor cases in both the primary (Table 1) and secondary (Table S2) datasets fall into four general categories: cytokine signalling, TNF signalling, vascular adhesion, or haemostasis. The 5 best soluble protein biomarkers for predicting outcome are highlighted in red. C) ROC curves comparing prediction of survival using PAI-1 levels (blue) or LASV RT-PCR Ct value (red) at admission in the combined dataset.
Figure 3.
Figure 3.. Levels of predictors of LF outcome in all study groups.
Boxplot graphs compare the levels of markers in the initial samples between all study groups (F, fatal LF cases (n=74); S, LF survivors (n=127); OFI, patients with other febrile illness (n=53); HC, healthy controls (n=46)) for the Primary and Secondary datasets combined. A) Ct value for LASV RT-PCR assay. B) PAI-1 levels, C) M-CSF levels, D) sTM levels, E) IL-8 levels, and F) sTNF-R1 levels. For all graphs, statistical significance by Mann-Whitney U test is denoted as **=P<0·01, ***=P<0·001, and ****=P<0·0001.
Figure 4.
Figure 4.. Longitudinal changes in Ct value, PAI-1 levels, and sTM levels.
Plots show changes in viraemia, PAI-1, and sTM throughout the course of LF in fatalities and survivors using the combined Primary and Secondary datasets. On each plot, the number of patients included in the subset (n) is shown. Dotted lines indicate the threshold value predicting fatal outcome vs survival with highest accuracy: Ct value <26·8; sTM >28·9 ng/ml; PAI-1 >300·1 ng/ml. Fatal and Survivor groups were further split as follows: Early fatal cases: patients that died by day 3 post-admission; Late fatal cases: patients that died after day 3 post-admission; Predicted Fatal among survivors: patients who survived but were predicted to succumb based on their biomarker values at admission using our logistic regression models; Predicted Survivor: patients who survived and were predicted by the model to survive. All groups are shown up to 11 days post admission, which was the latest day that any fatal case succumbed. A loess regression trendline is shown in black with the grey area representing the 95% confidence interval of the fit.

References

    1. Shaffer JG, Grant DS, Schieffelin JS, et al. Lassa fever in post-conflict sierra leone. PLoS Negl Trop Dis 2014; 8(3): e2748. - PMC - PubMed
    1. Akpede GO, Asogun DA, Okogbenin SA, et al. Caseload and Case Fatality of Lassa Fever in Nigeria, 2001–2018: A Specialist Center’s Experience and Its Implications. Frontiers in Public Health 2019; 7(170). - PMC - PubMed
    1. Asogun DA, Adomeh DI, Ehimuan J, et al. Molecular diagnostics for lassa fever at Irrua specialist teaching hospital, Nigeria: lessons learnt from two years of laboratory operation. PLoS Negl Trop Dis 2012; 6(9): e1839. - PMC - PubMed
    1. Fichet-Calvet E, Rogers DJ. Risk maps of Lassa fever in West Africa. PLoS Negl Trop Dis 2009; 3(3): e388. - PMC - PubMed
    1. Kafetzopoulou LE, Pullan ST, Lemey P, et al. Metagenomic sequencing at the epicenter of the Nigeria 2018 Lassa fever outbreak. Science 2019; 363(6422): 74–7. - PMC - PubMed

Publication types