. 2021 Apr:472:98-114.
doi: 10.1016/j.ydbio.2021.01.008. Epub 2021 Jan 20.

microRNA-31 regulates skeletogenesis by direct suppression of Eve and Wnt1

Affiliations

microRNA-31 regulates skeletogenesis by direct suppression of Eve and Wnt1

Nina Faye Sampilo et al. Dev Biol. 2021 Apr.

Abstract

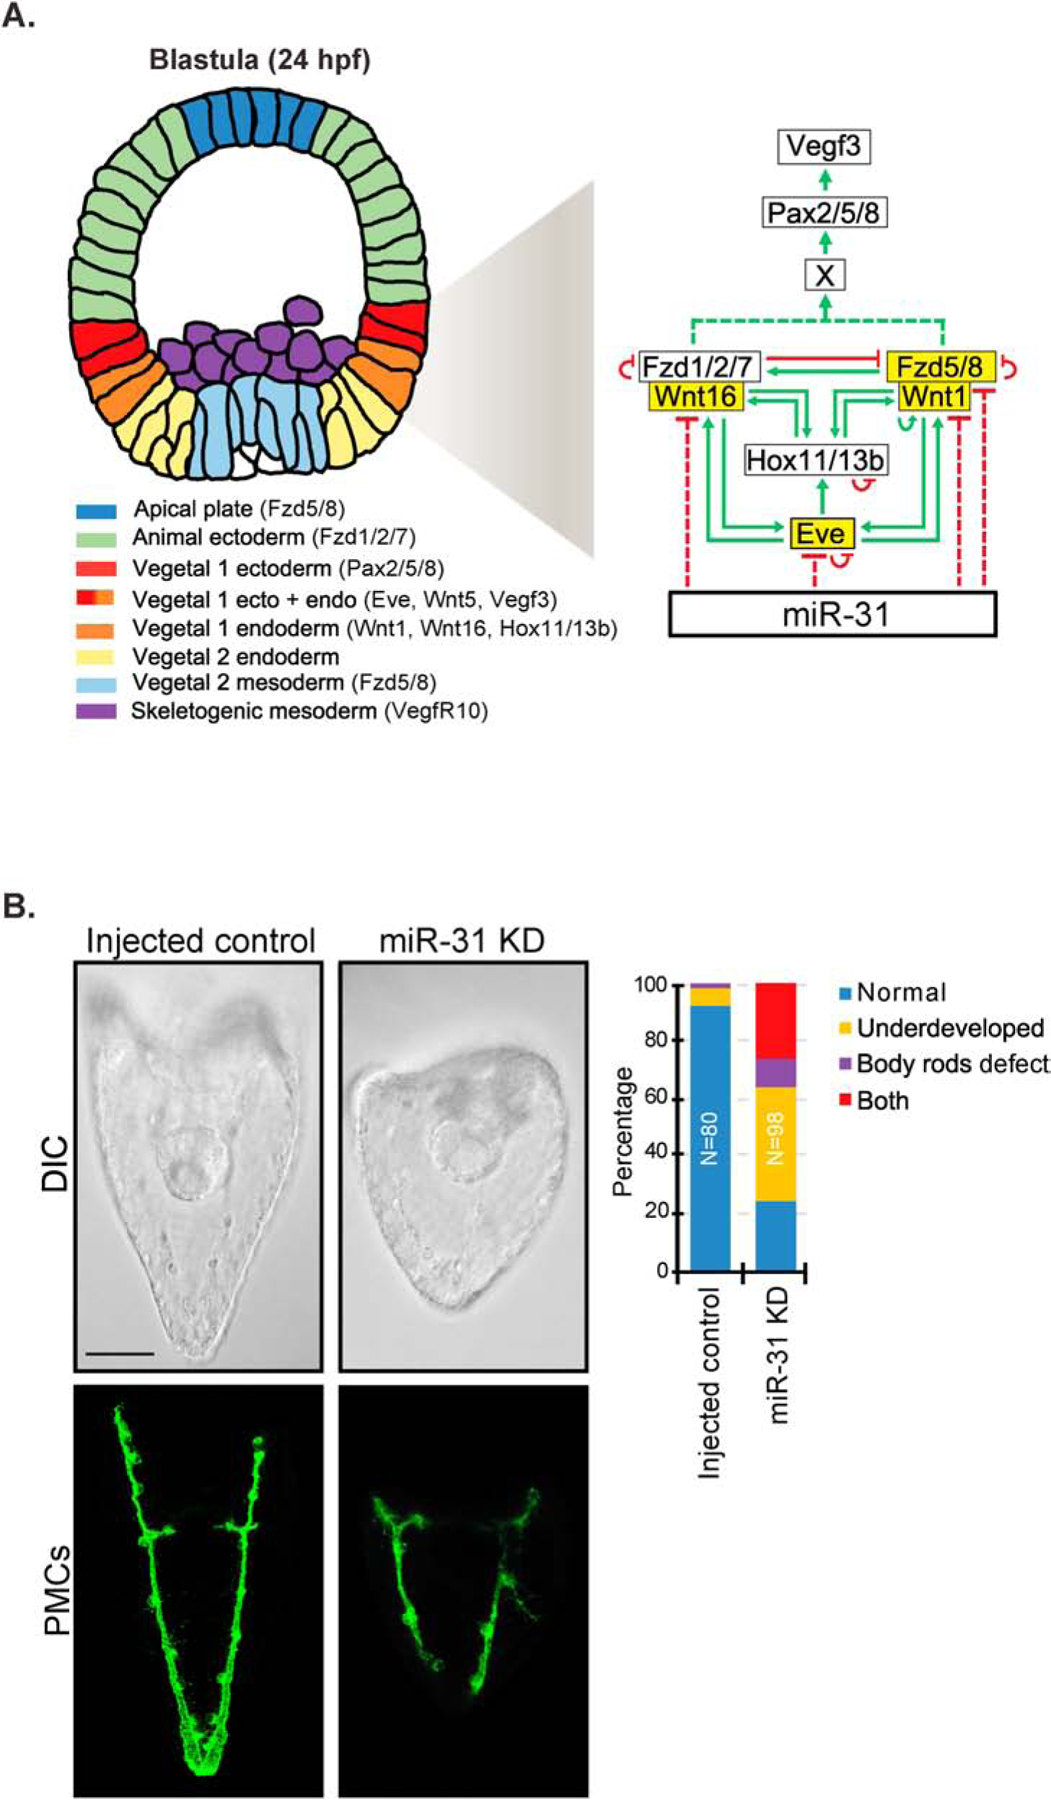
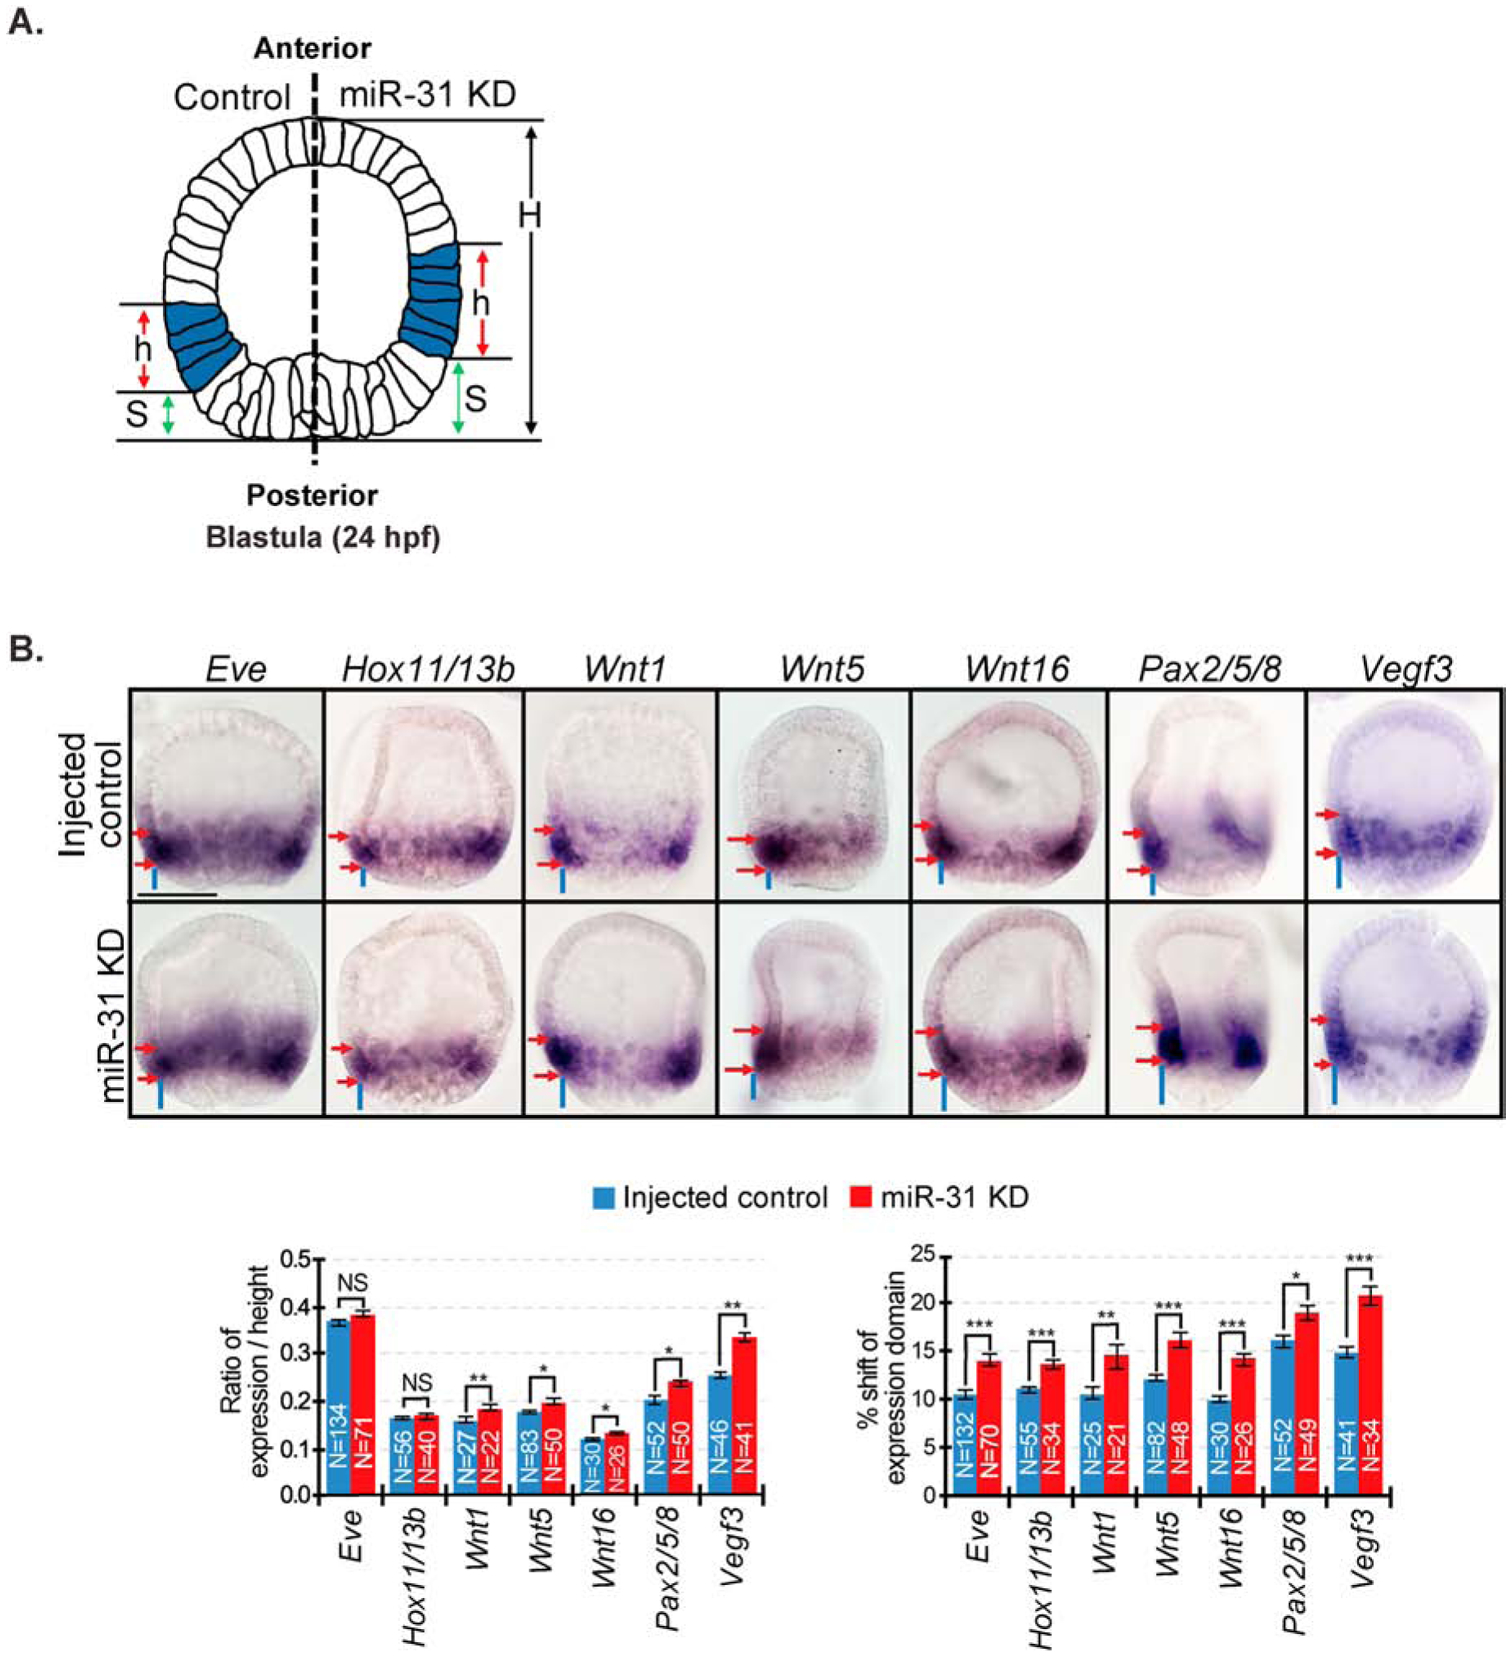
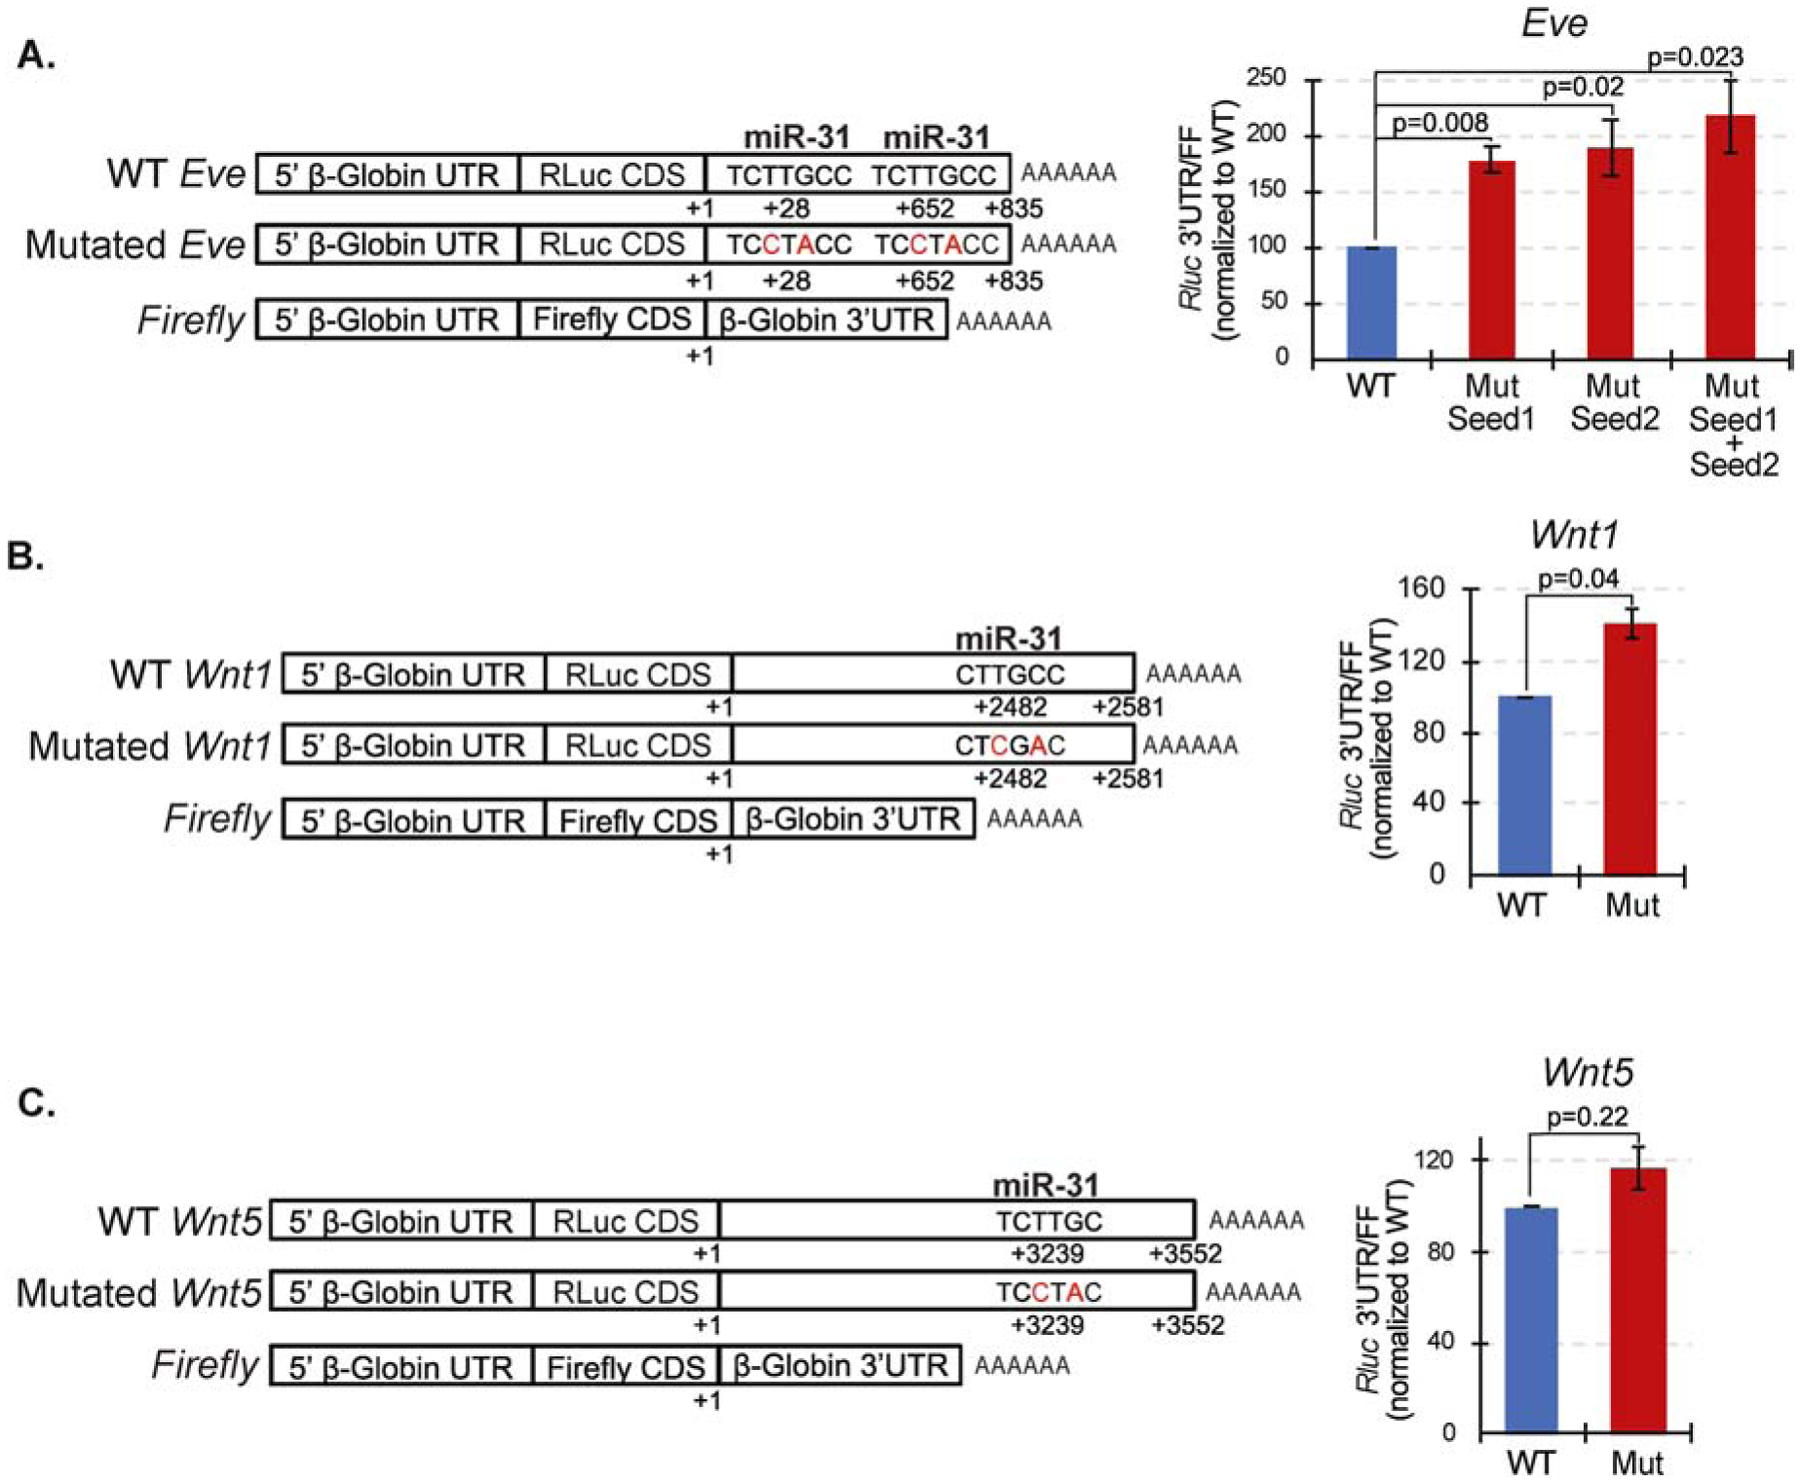
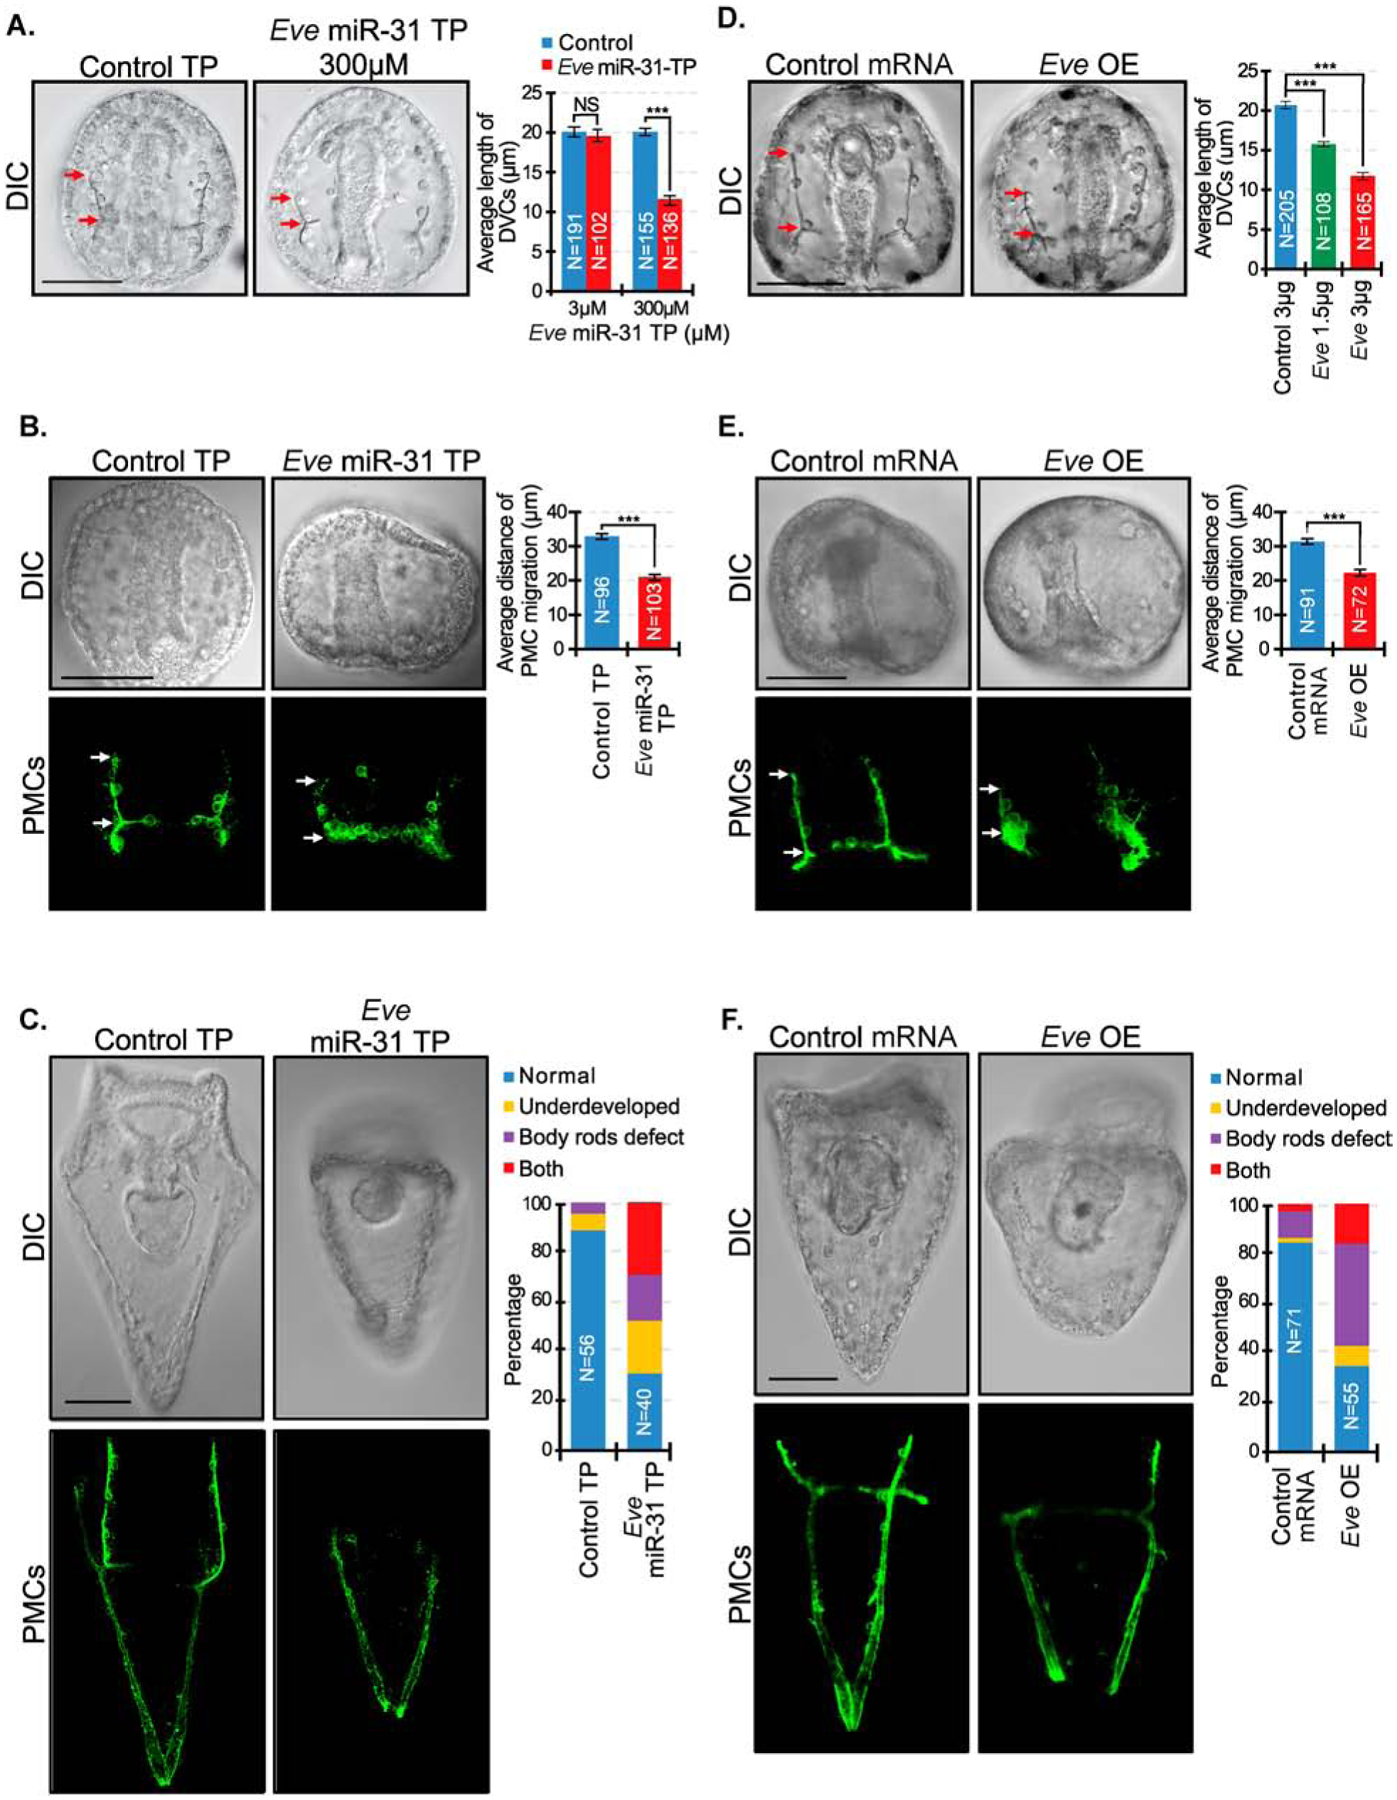
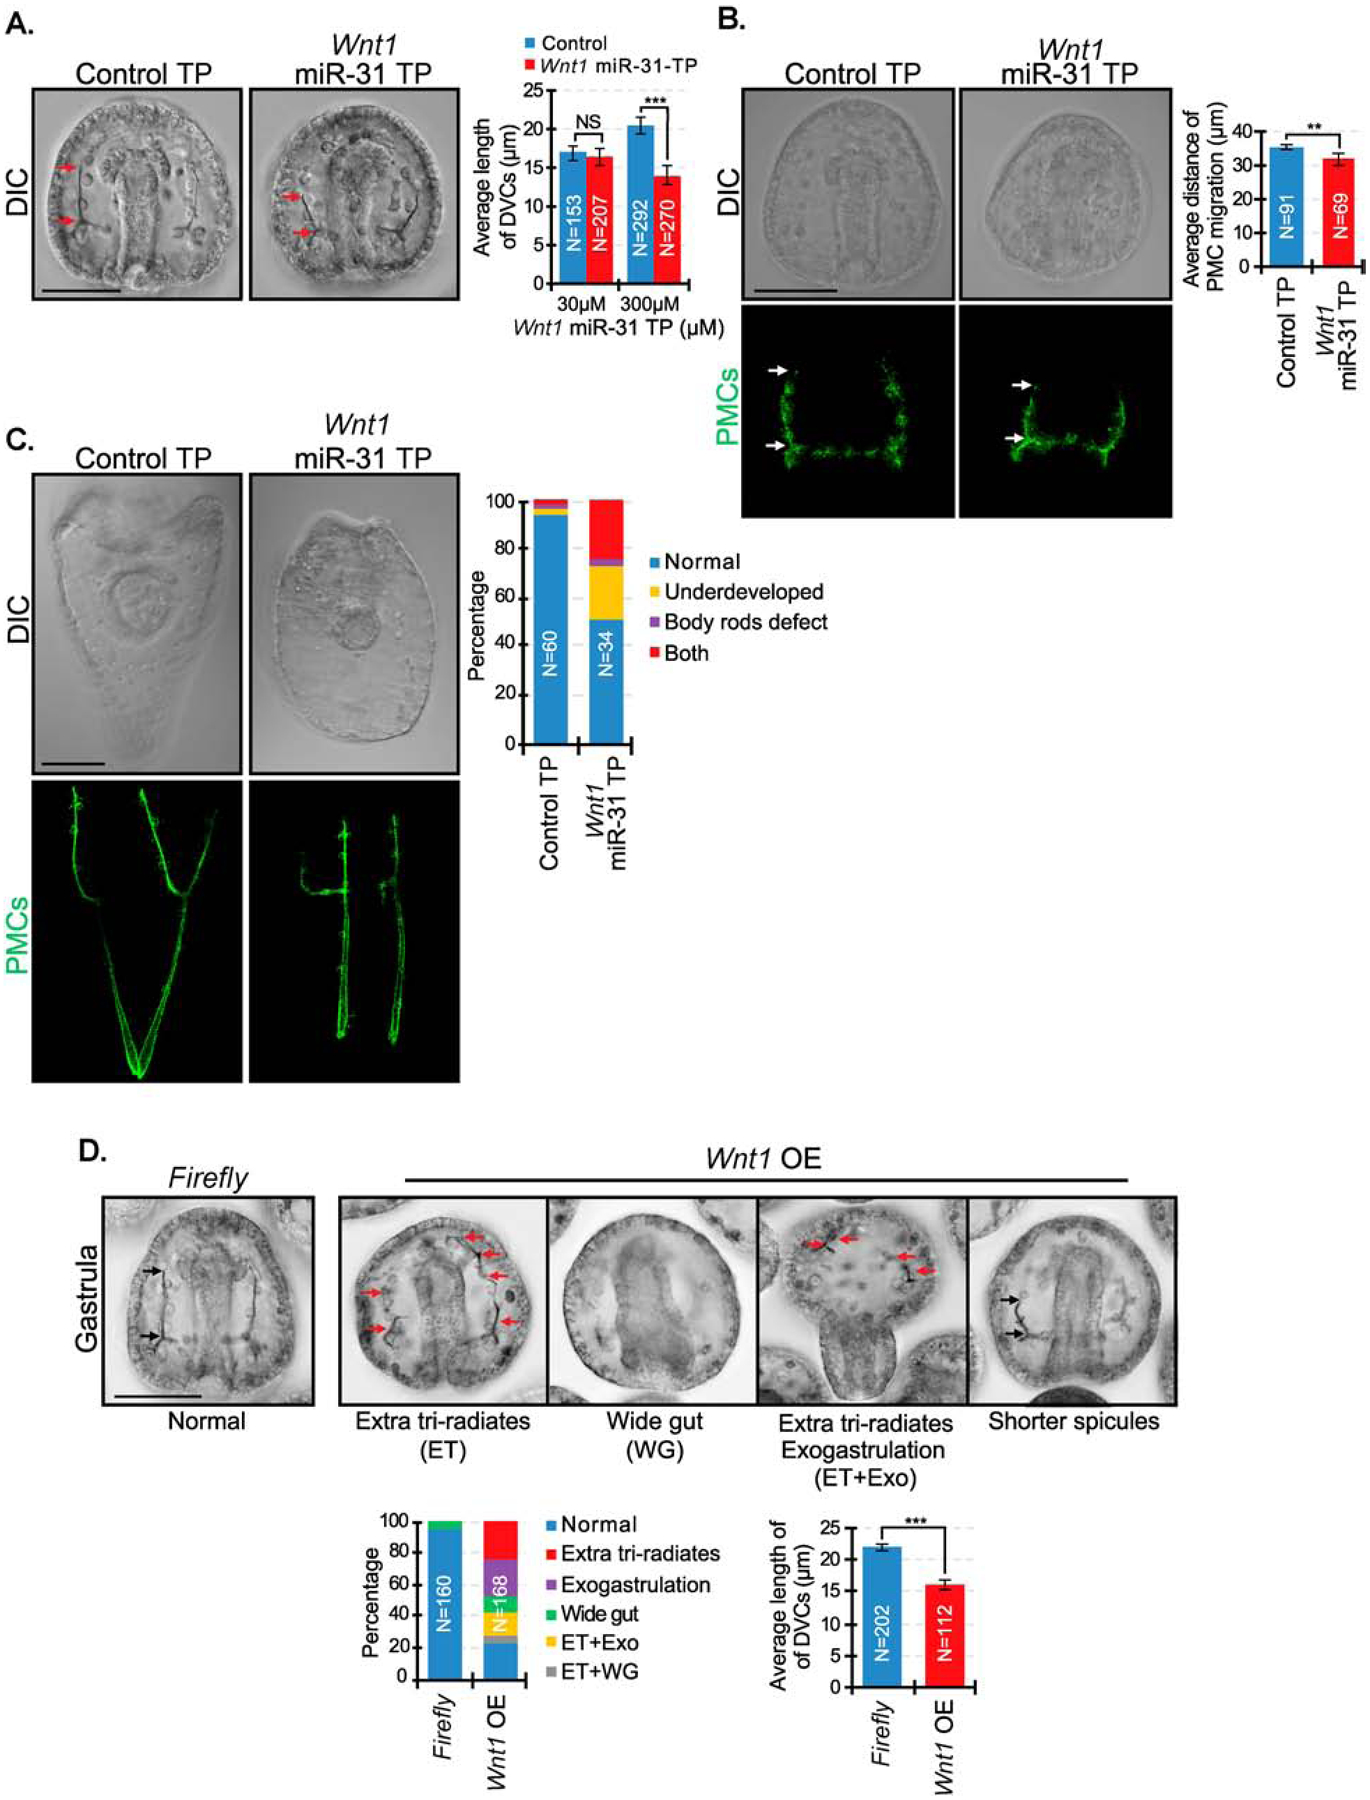
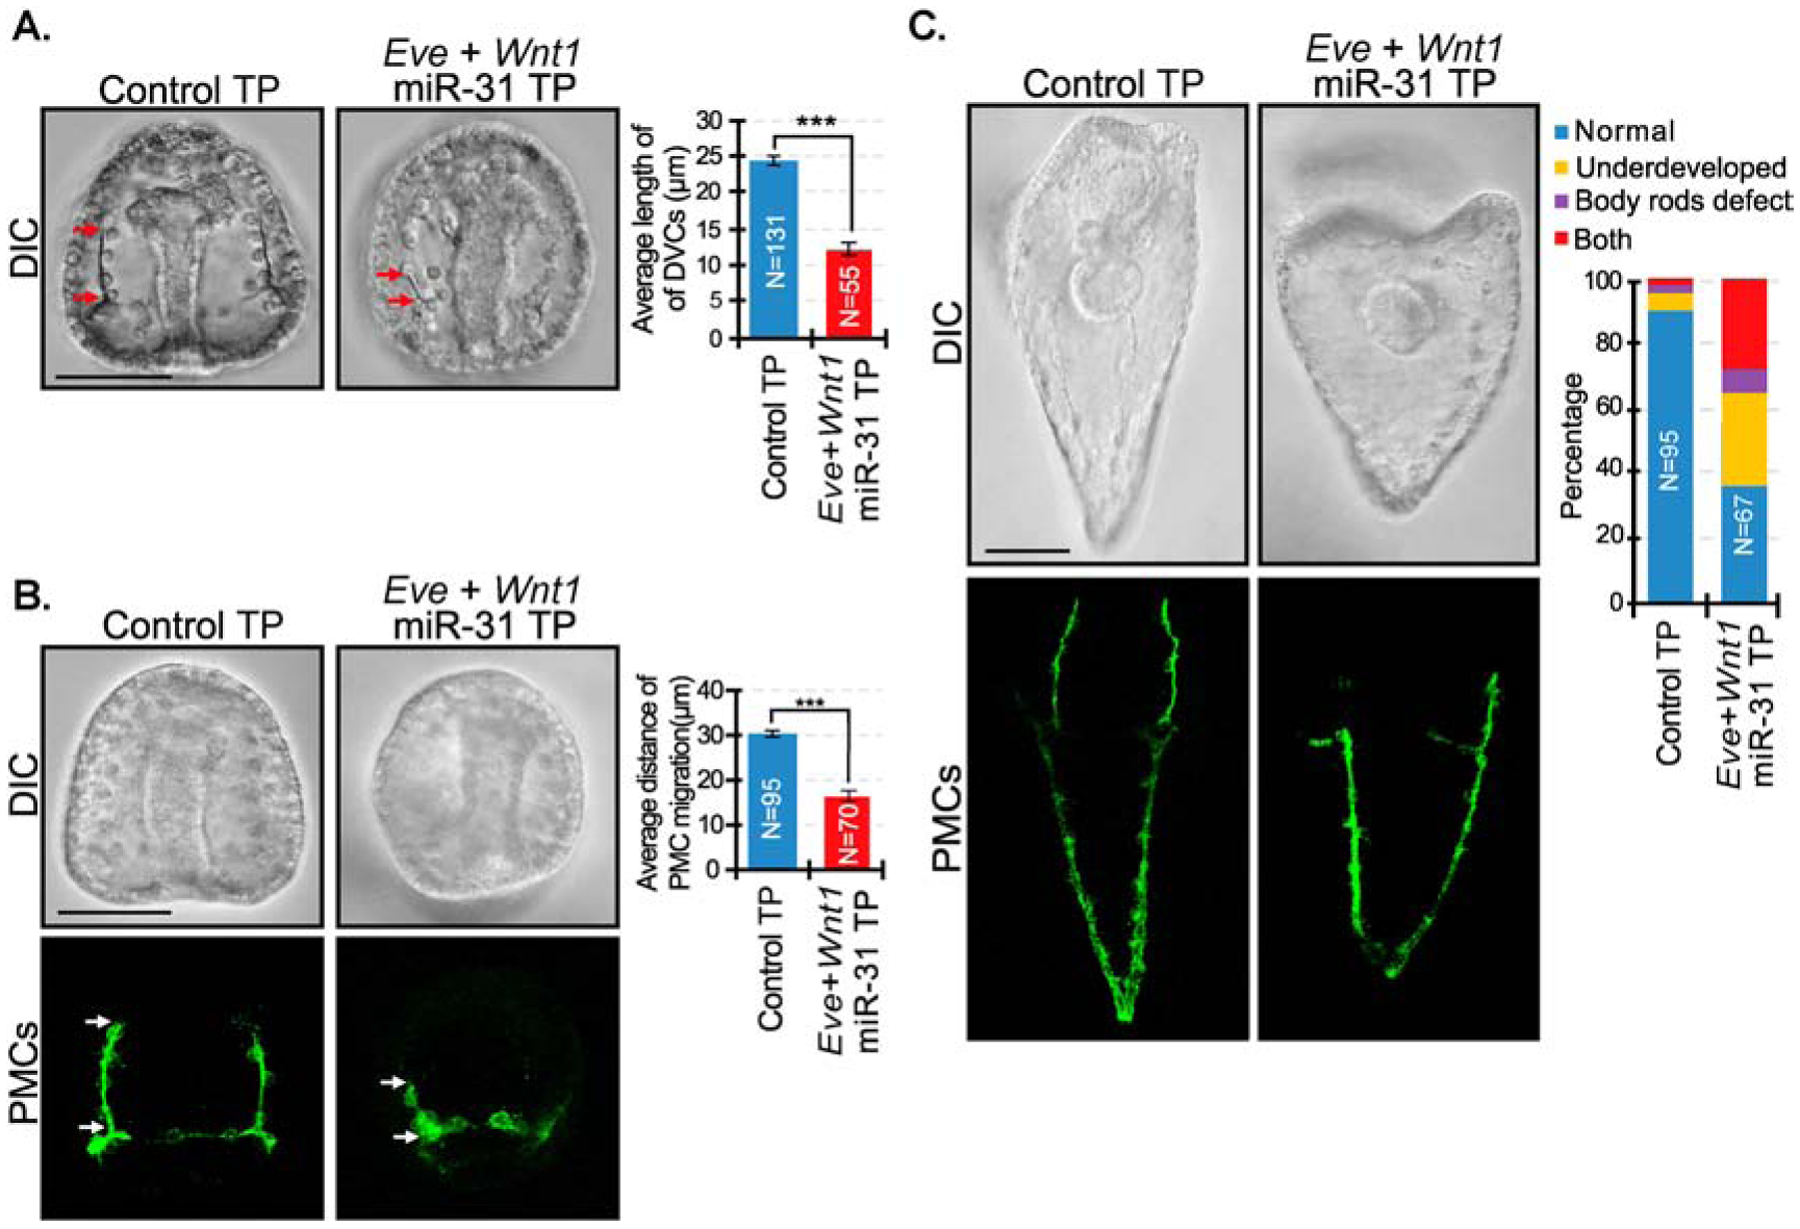
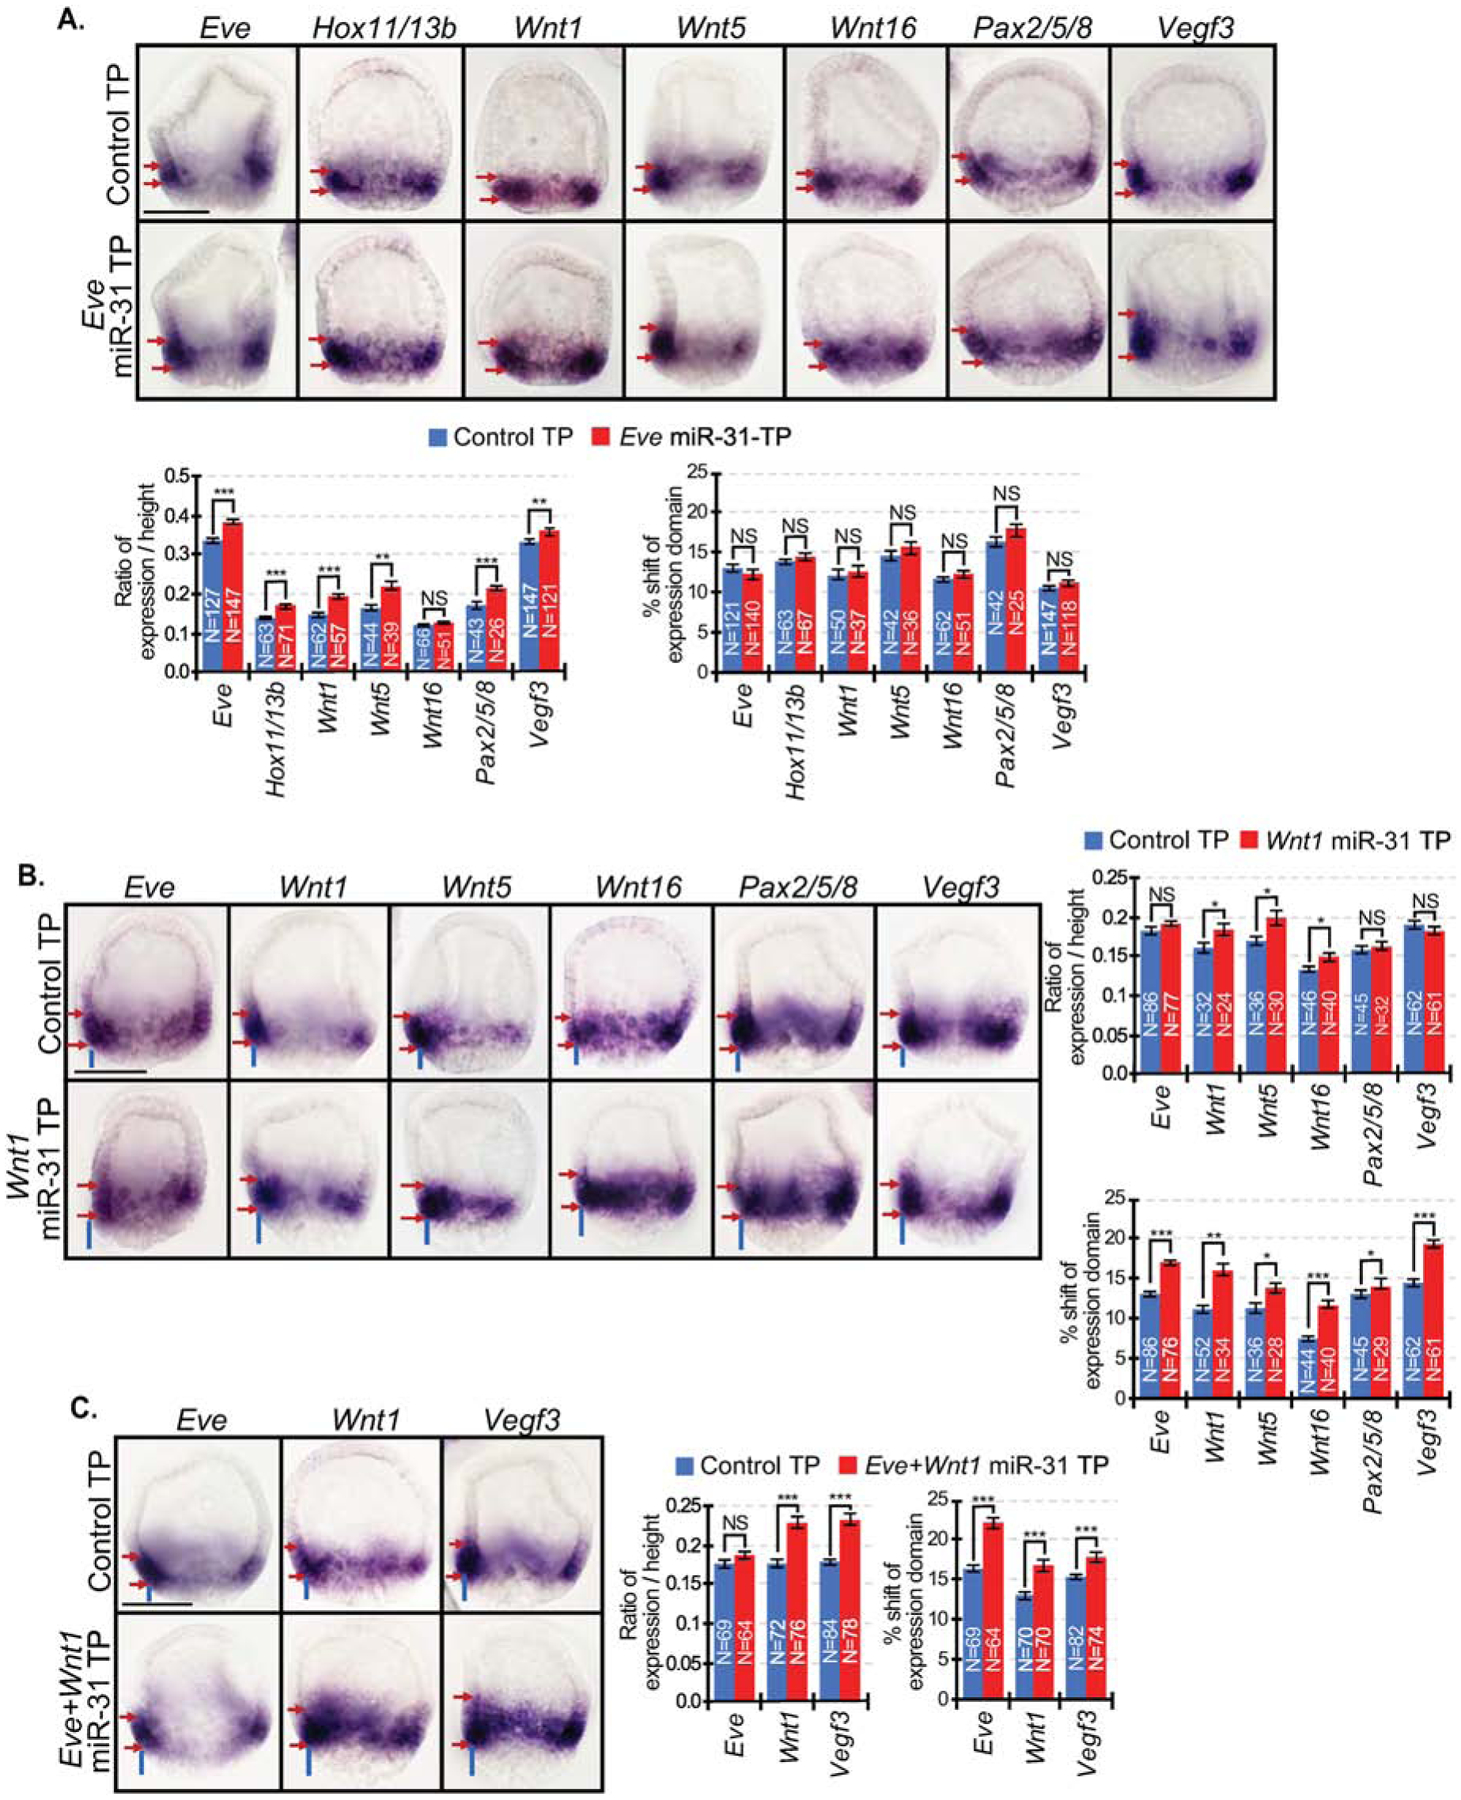
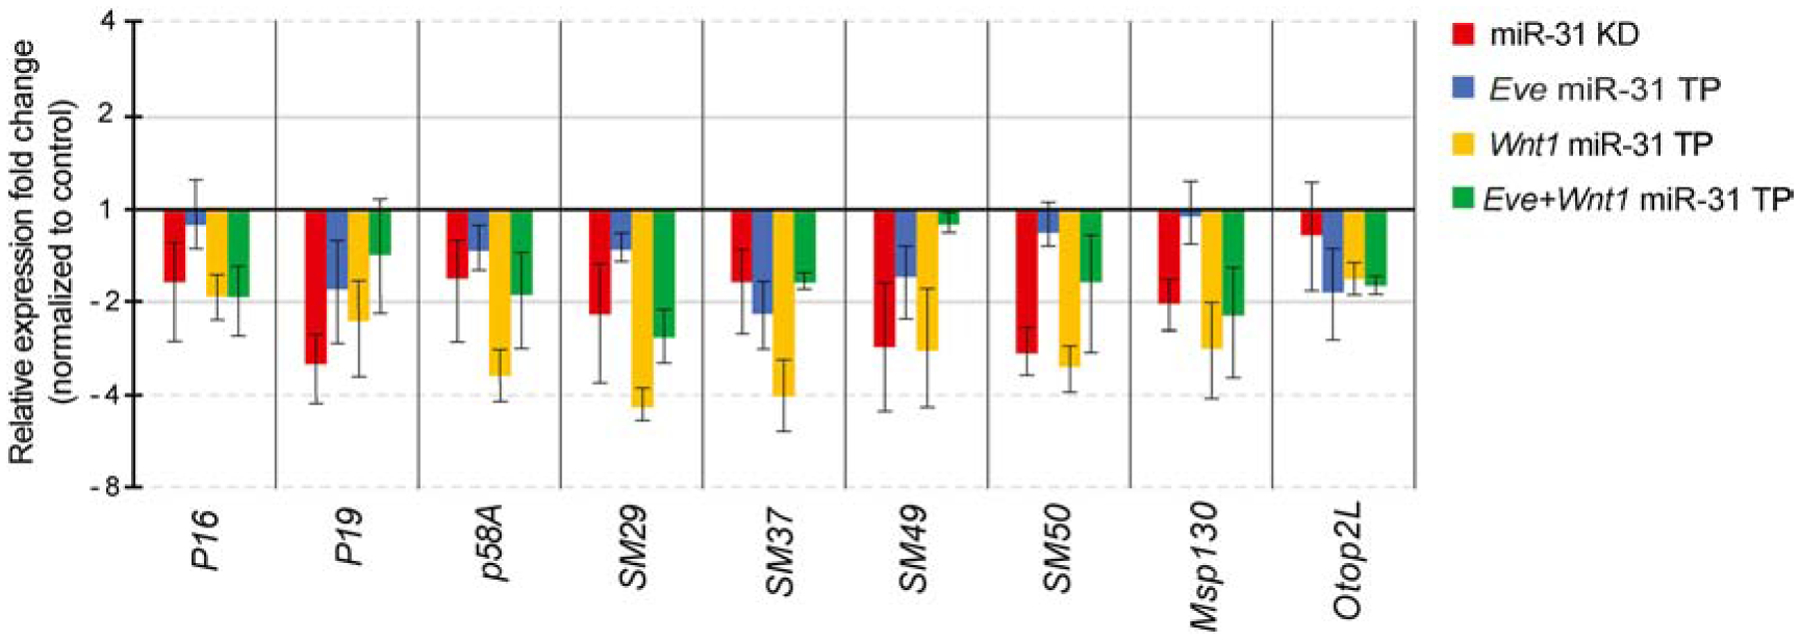
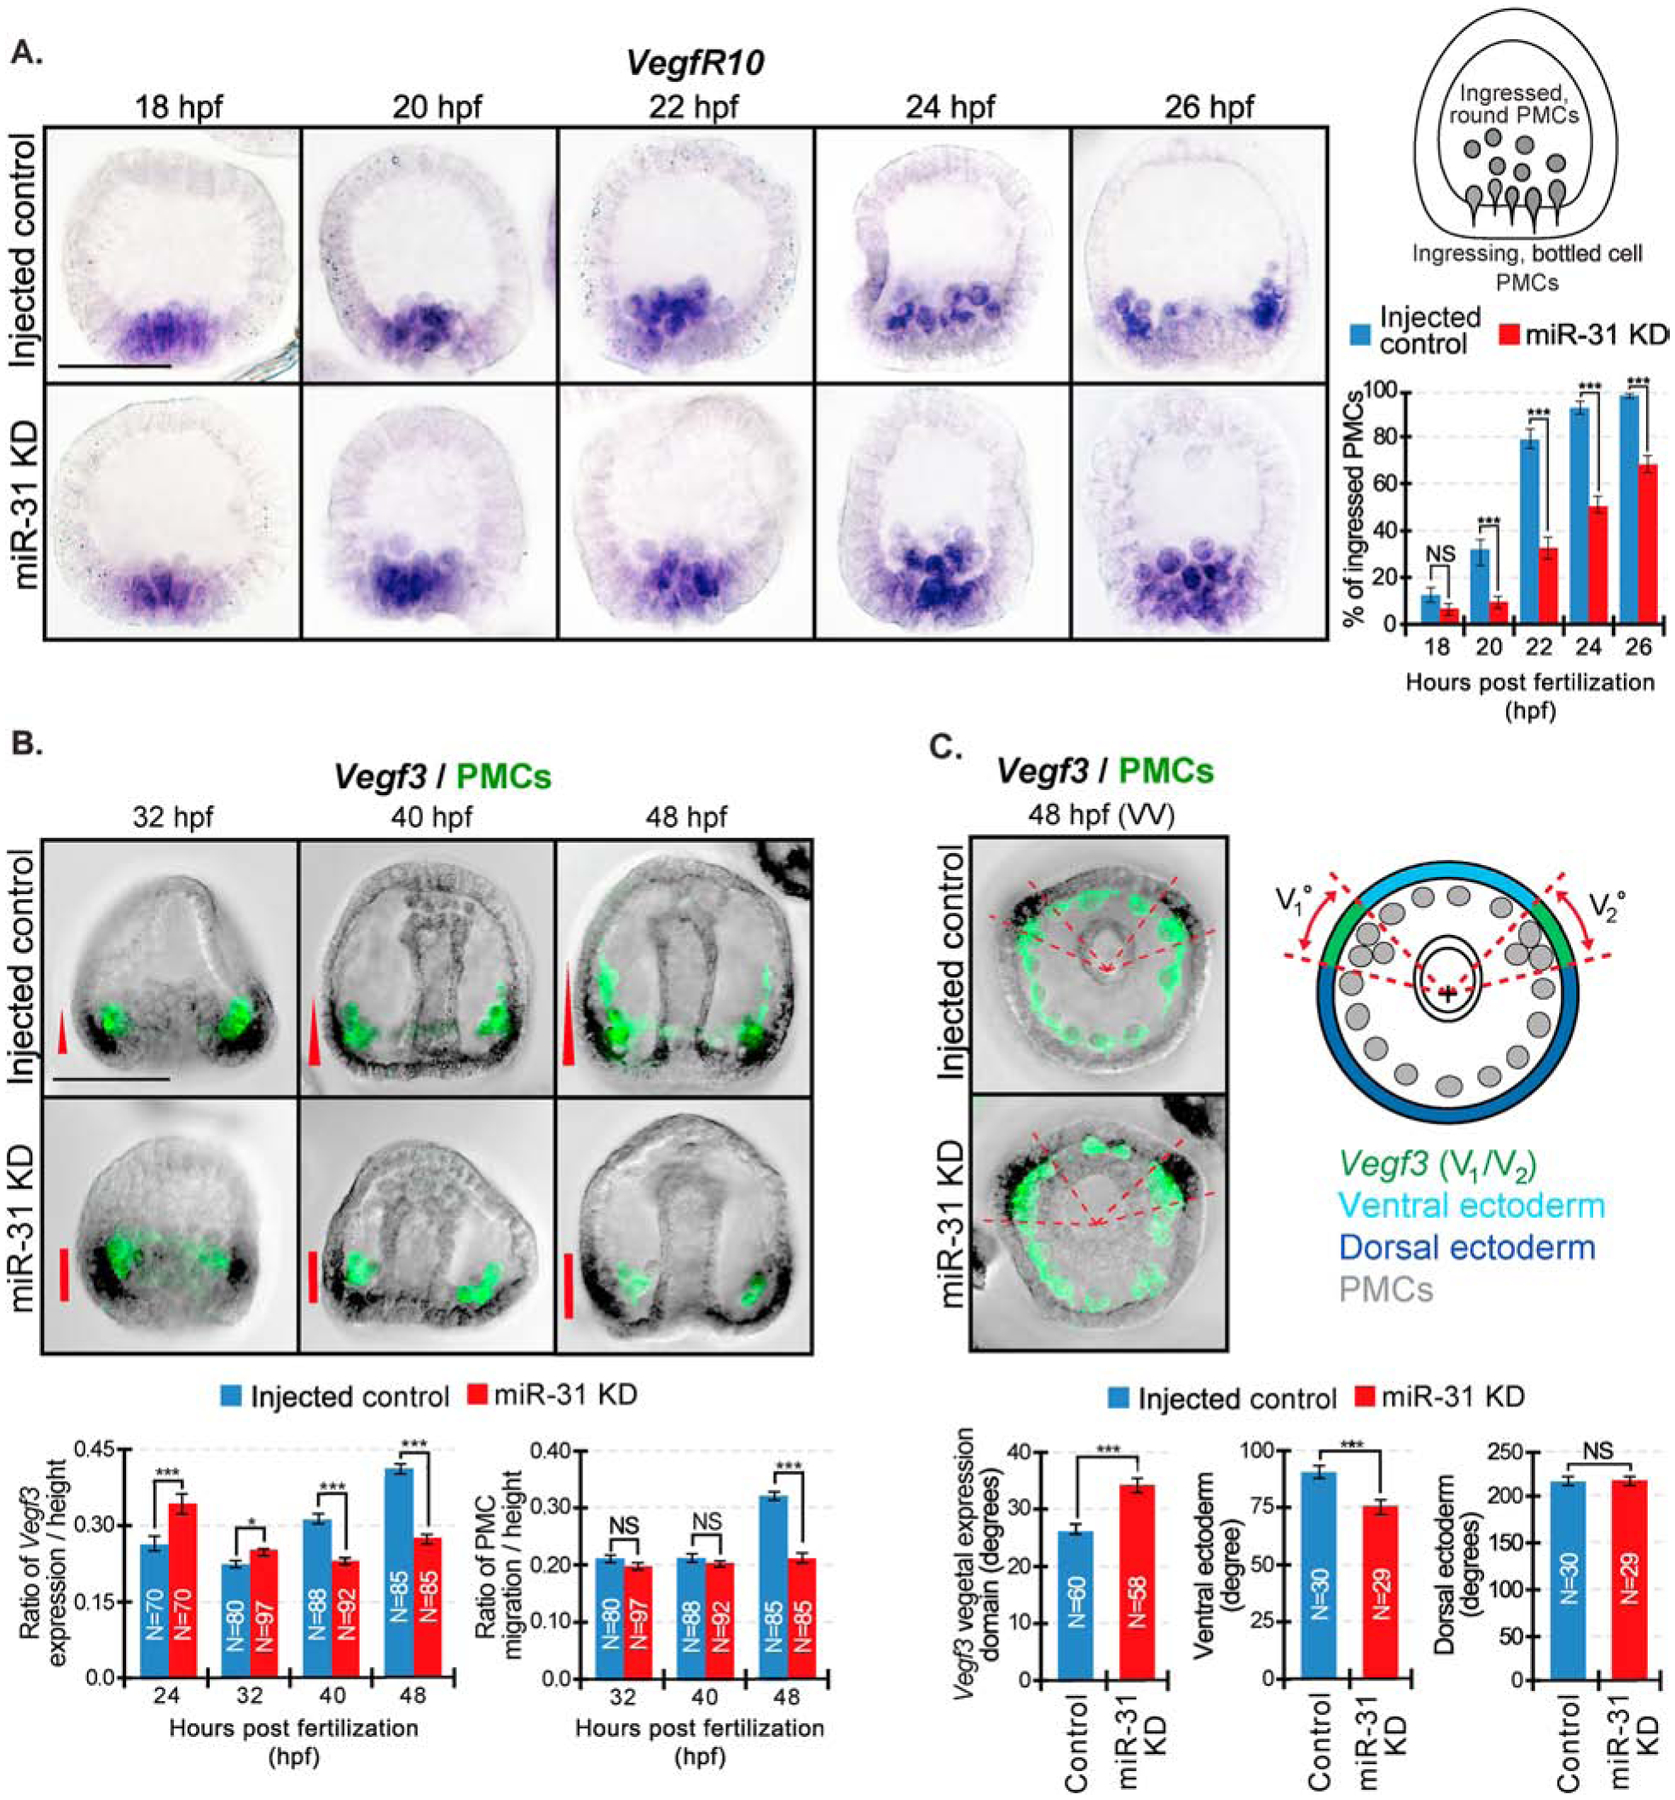
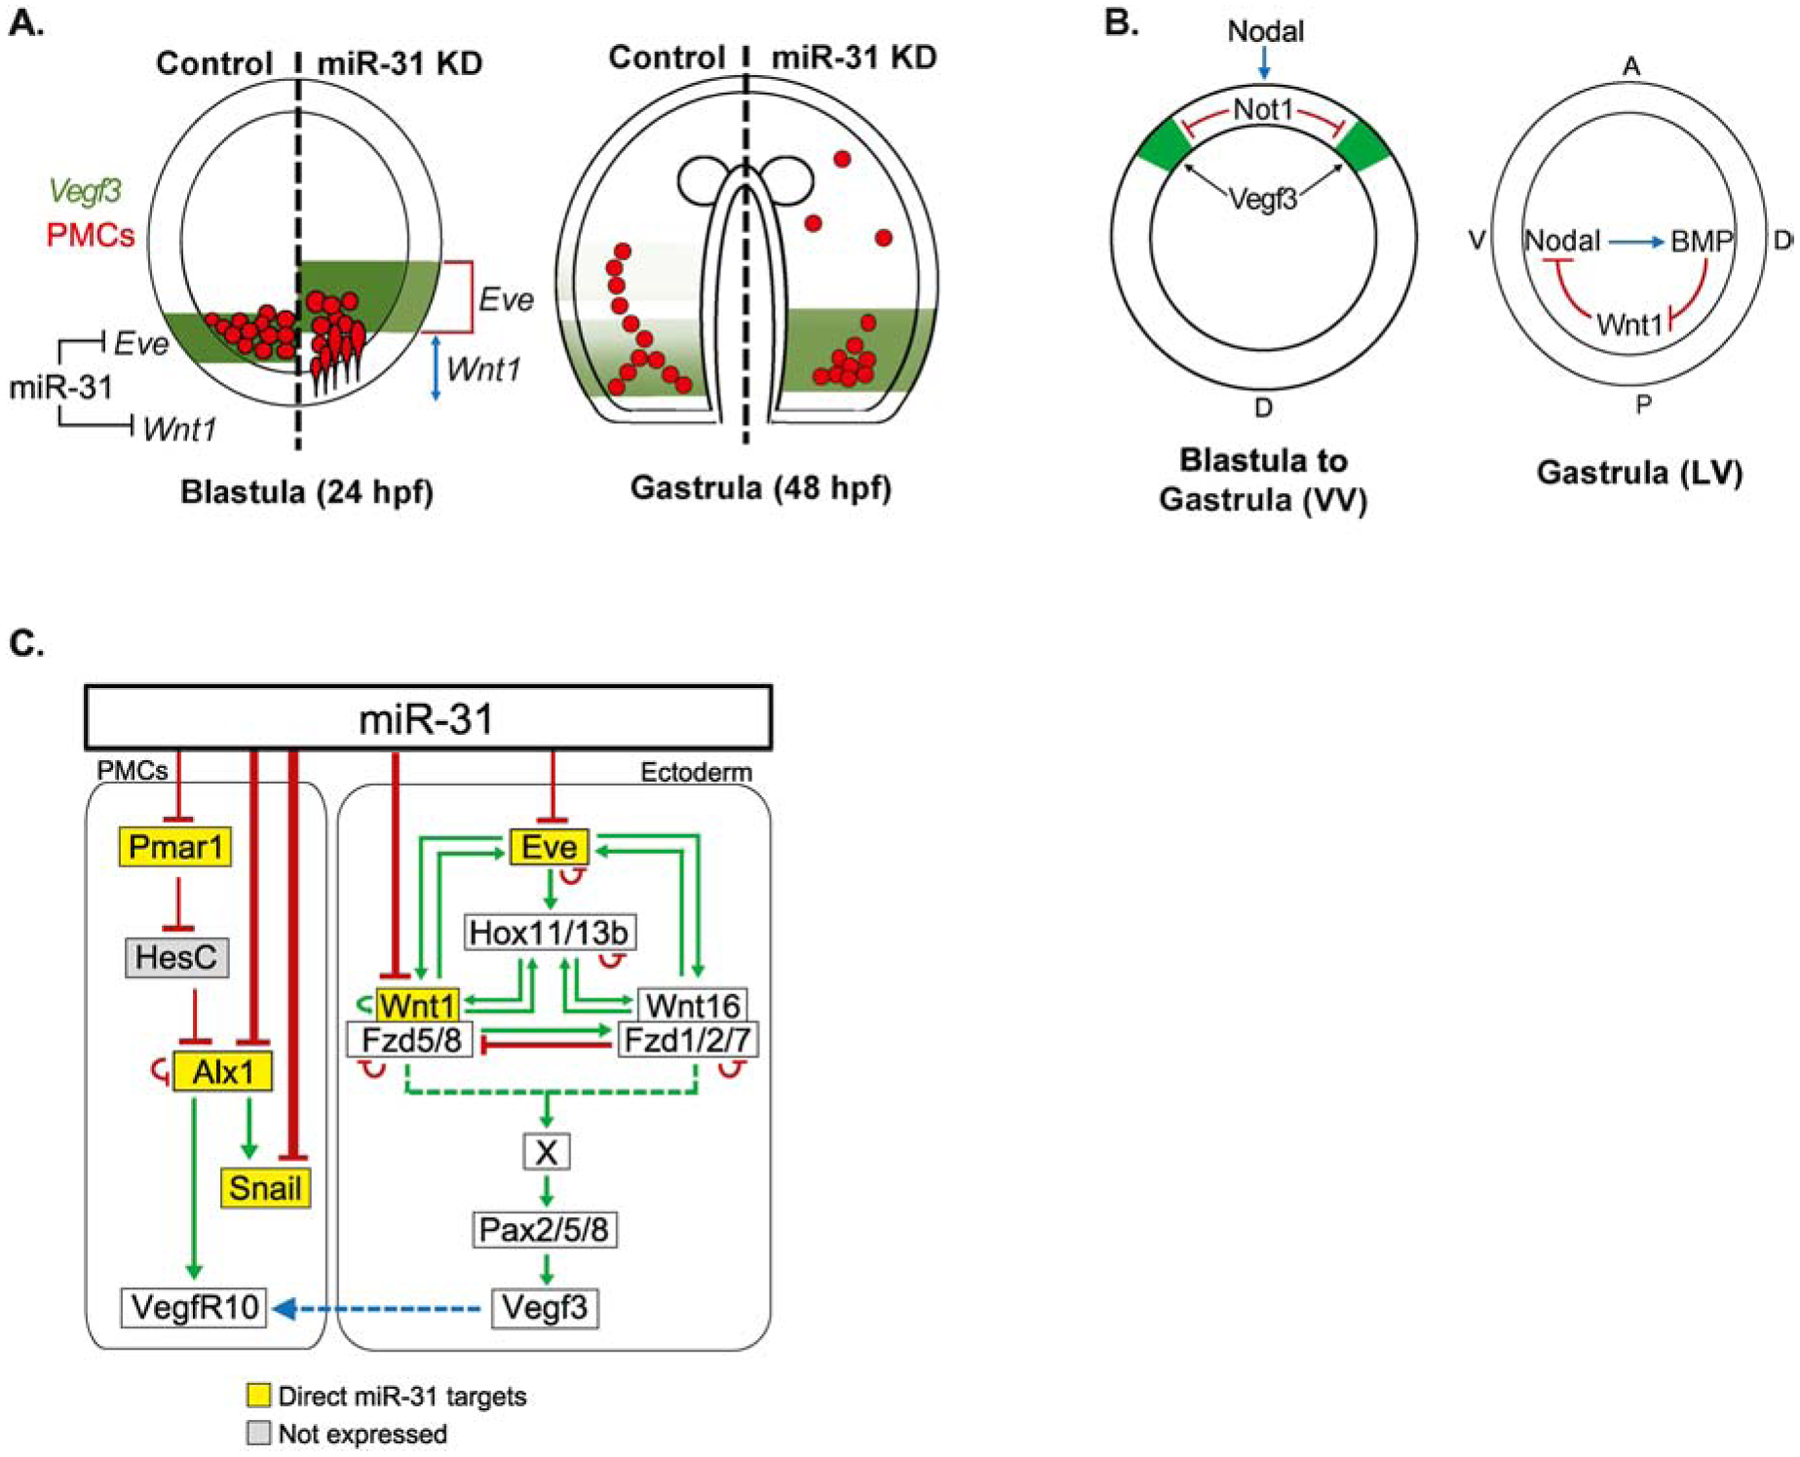
microRNAs (miRNAs) play a critical role in a variety of biological processes, including embryogenesis and the physiological functions of cells. Evolutionarily conserved microRNA-31 (miR-31) has been found to be involved in cancer, bone formation, and lymphatic development. We previously discovered that, in the sea urchin, miR-31 knockdown (KD) embryos have shortened dorsoventral connecting rods, mispatterned skeletogenic primary mesenchyme cells (PMCs) and shifted and expanded Vegf3 expression domain. Vegf3 itself does not contain miR-31 binding sites; however, we identified its upstream regulators Eve and Wnt1 to be directly suppressed by miR-31. Removal of miR-31's suppression of Eve and Wnt1 resulted in skeletal and PMC patterning defects, similar to miR-31 KD phenotypes. Additionally, removal of miR-31's suppression of Eve and Wnt1 results in an expansion and anterior shift in expression of Veg1 ectodermal genes, including Vegf3 in the blastulae. This indicates that miR-31 indirectly regulates Vegf3 expression through directly suppressing Eve and Wnt1. Furthermore, removing miR-31 suppression of Eve is sufficient to cause skeletogenic defects, revealing a novel regulatory role of Eve in skeletogenesis and PMC patterning. Overall, this study provides a proposed molecular mechanism of miR-31's regulation of skeletogenesis and PMC patterning through its cross-regulation of a Wnt signaling ligand and a transcription factor of the endodermal and ectodermal gene regulatory network.

Keywords: Even-skipped; MicroRNA-31; Post-transcriptional regulation; Primary mesenchyme cells; Sea urchin; Vegf signaling; Wnt; miRNA target protector.


Figures

Figure 1
Figure 1. miR-31 indirectly regulates Vegf3 expression domain and skeletogenesis by targeting Eve, Wnts, and Fzds.
(A) A simplified proposed model of miR-31’s indirect regulation of Vegf3 and skeletogenesis through potential targets Eve, Wnt1, Wnt16, and Fzd5/8 during mesenchyme blastula (24 hpf). Genes highlighted in yellow are potential miR-31 targets. Eve is activated by canonical Wnt/β-catenin signaling and is expressed in both the Veg1 endoderm and ectoderm and activates Hox11/13b in the Veg1 endoderm (Cui et al., 2014; Peter and Davidson, 2011; Ransick et al., 2002). Wnt1 and Wnt16 also contribute to the activation of Hox11/13b in the Veg1 cells, and the positive feedback of Hox11/13b, Wnt1, and Wnt16 occurs in Veg1 endodermal cells (Cui et al., 2014). Wnt1 signals through Fzd5/8 receptor to activate the ncWnt/PCP-ROCK/JNK pathway, and Wnt16 signals through Fzd1/2/7 to activate the ncWnt/Ca2+-PKC pathway (Martínez-Bartolomé and Range, 2019; Range et al., 2013). Wnt1-Fzd5/8 and Wnt16-Fzd1/2/7 cross-regulate each other (Range et al., 2013). Wnt1-Fzd5/8 and/or Wnt16-Fzd1/2/7 signaling lead to the activation of an unidentified factor which activates transcription factor Pax2/5/8, leading to activation of Vegf3 expression (McIntyre et al., 2013; Rottinger et al., 2008). Eve, Hox11/13b, Fzd5/8 and Fzd1/2/7 are in part regulated through autorepression, while Wnt1 may be regulated through autoactivation (Cui et al., 2014; Cui et al., 2017; Range, 2018; Range et al., 2013). (B) The shorter DVC rods and aberrant PMC patterning defects observed in miR-31 KD gastrulae (Stepicheva and Song, 2015) persist into the larval stage (5dpf). A greater number of miR-31 KD larvae are underdeveloped and/or exhibit body rods that fail to meet at the posterior end of the embryo. Maximum intensity projection of Z-stack confocal images are shown. 2 biological replicates. N is the total number of larvae examined. Scale bar = 50μm.
Figure 2
Figure 2. miR-31 KD results in expansion and anterior shift of Veg1 endodermal and Veg1 ectodermal gene expression domains.
(A) The spatial expression domains (h) and anterior shift (S) were measured on both sides of each embryo. The average expression domain is calculated by taking the average of the ratio of h/H from each side. The anterior shift is measured by taking the average of the ratios of S/H from each side. (B) miR-31 KD mesenchyme blastulae (24 hpf) have an anterior shift in spatial expression domain of all genes expressed in the Veg1 endoderm and Veg1 ectoderm compared to control. miR-31 KD embryos have expanded expression domains of Wnt1, Wnt5, Wnt16, Pax2/5/8, and Vegf3 compared to control. Red arrows delineate expression domains. Blue lines indicate shift of expression domain. NS=Not significant, *p<0.05, **p<0.001, ***p<0.0001 using Student’s t-test. All error bars represent SEM. 2–3 biological replicates. Scale bar = 50μm.
Figure 3
Figure 3. miR-31 directly suppresses Eve and Wnt1.
(A) Dual luciferase assays were conducted at mesenchyme blastula stage (24 hpf). The Rluc values were first normalized to the co-injected Firefly values. The ratios of normalized Rluc values with mutated miR-31 seed to the Rluc with wildtype (WT) miR-31 seed are presented. Luciferase readings of embryos injected with mutated (Mut) miR-31 3’UTR binding sites of Eve were increased significantly in comparison to embryos injected with the WT 3’ UTRs, indicating that miR-31 directly represses Eve. (B) Wnt1 has a mismatch of the first T nucleotide of the miR-31 seed sequence. Wnt1 is directly suppressed by miR-31. (C) Wnt5 contains a mismatch of the last C nucleotide of the miR-31 seed sequence. Wnt5 is not directly suppressed by miR-31 or experiences weak miRNA-mRNA binding affinity. 3–4 biological replicates. P-value was analyzed using Student’s t-test. All error bars represent SEM.
Figure 4
Figure 4. Removal of miR-31 suppression of Eve and Eve overexpression results in shortening of the DVCs and aberrant PMC patterning that persists into the larval stage.
(A) Eve miR-31 TP injected gastrulae (48 hpf) had decreased DVC length in a dose-dependent manner compared to the control TP. Red arrows indicate the length of DVCs. P-value was analyzed using Student’s t-test. 3 biological replicates. NS=not significant. N is the total number of spicules examined. (B) Embryos were immunolabeled with PMC antibody, 1D5 (McClay et al., 1983). PMCs in Eve miR-31 TP injected embryos exhibit less anterior migration compared to the control injected embryos. P-value was analyzed using Student’s t-test. (C) Eve miR-31 TP injected larval stage (5 dpf) development displayed body rods that failed to meet at the posterior end and overall underdeveloped larvae compared to control. 3 biological replicates. (D) Overexpression of Eve (3 μg or 1.5 μg total mRNA in 2.5μl of injection stock solution) recapitulated shorter DVCs as in Eve miR-31 TP injected embryos in a dose-dependent manner. P-value was analyzed using Student’s t-test. N is the total number of spicules examined. (E) Eve overexpression resulted in similar PMC anterior migration defects in Eve miR-31 TP gastrulae. (F) Eve overexpression resulted in developmental delay and body rod defects, similar to Eve miR-31 TP larvae. P-value was analyzed using Student’s t-test. 3 biological replicates. ***p<0.0001. All error bars represent SEM. Scale bar = 50μm. N is the total number of embryos examined except where otherwise stated. Maximum intensity projection of Z-stack confocal images are presented for the PMC patterning.
Figure 5
Figure 5. Removal of miR-31 suppression of Wnt1 results in shorter DVC length while Wnt1 overexpression results in extra skeletal rudiments and exogastrulation.
(A) Wnt1 miR-31 TP injected gastrulae (48 hpf) had decreased DVC length in a dose-dependent manner. Red arrows indicate the length of DVCs. P-value was analyzed using Student’s t-test. 2–3 biological replicates. NS=not significant. N is the total number of spicules examined. (B) Embryos were immunolabeled with PMC antibody, 1D5. PMC anterior migration is decreased in Wnt1 miR-31 TP injected embryos compared to the control injected embryos. P-value was analyzed using Student’s t-test. 2 biological replicates. White arrows indicate PMC migration distance. (C) Wnt1 miR-31 TP injected larvae (5dpf) appeared rounder with body rods that failed to meet at the posterior end compared to the control TP. 2 biological replicates. Maximum intensity projection of Z-stack confocal images are presented for the PMC patterning. (D) Overexpression of Wnt1 CDS resulted in multiple developmental defects. Red arrows indicate skeletal tri-radiates. Black arrows indicate the length of DVCs. P-value was analyzed using Student’s t-test. 4 biological replicates. N is the total number of spicules examined. Tri-radiates were counted through a series of Z-stack images. **p<0.001, ***p<0.0001. All error bars represent SEM. Scale bar = 50μm. N is the total number of embryos examined except where otherwise stated.
Figure 6
Figure 6. Removal of miR-31 suppression of both Eve and Wnt1 results in similar skeletal and PMC patterning defects as miR-31 KD embryos.
(A) A combination of Eve miR-31 TP and Wnt1 miR-31 TP resulted in a significant decrease in length of the DVCs compared to control TP gastrulae. Red arrows indicate the length of DVCs. P-value was analyzed using Student’s t-test. 2 biological replicates. N is the total number of spicules examined. (B) Eve+Wnt1 miR-31 TP injected embryos displayed severe anterior migration defects of PMCs compared to the control, reminiscent of defects observed in miR-31 KD gastrulae (Stepicheva and Song, 2015). P-value was analyzed using Student’s t-test. 3 biological replicates. (C) Compared to the control, Eve+Wnt1 miR-31 TP injected larvae (5 dpf) are smaller and have body rods that failed to meet at the posterior end, similar to miR-31 KD larvae. 3 biological replicates. **p<0.001, ***p<0.0001. All error bars represent SEM. Scale bar = 50μm. N is the total number of embryos examined except where otherwise stated. Maximum intensity projection of Z-stack confocal images are shown.
Figure 7
Figure 7. miR-31’s direct suppression of Eve regulates the increased spatial expression of Veg1 endodermal and ectodermal genes, and its direct suppression of Wnt1 regulates the anterior shift of gene expression.
(A) In Eve miR-31 TP injected embryos, expression domains of all examined genes were significantly expanded with the exception of Wnt16. Presence of red arrows indicate an expansion of expression domain. (B) In Wnt1 miR-31 TP injected embryos, the expression domains of Wnt5 and Wnt16 were expanded compared to control TP. An anterior shift of gene expression domain was observed for all genes. Presence of blue lines indicates a shift of expression domain. (C) Eve+Wnt1 miR-31 TP injected embryos resulted in an anterior shift of the expression domains of Vegf3, Eve, and Wnt1. The expression domains of these genes also expanded, similar to that observed in miR-31 KD embryos. NS=not significant. *p<0.05, **p<0.001, ***p<0.0001 using Student’s t-test. All error bars represent SEM. 2–4 biological replicates. Scale bar = 50μm. N is the total number of embryos examined.
Figure 8
Figure 8. miR-31 KD, Eve miR-31 TP, Wnt1 miR-31 TP, and Eve+Wnt1 miR-31 TP injected embryos have decreased levels of biomineralization genes.
qPCR was used to measure the transcriptional changes of biomineralization and PMC genes P16, P19, p58A, SM29, SM37, SM49, SM50, Msp130 and Otop2L. All perturbed embryos have decreased expression of biomineralization transcripts compared to the control. miR-31 KD resulted in a ≥2-fold decrease in P19, SM29, SM49, SM50, and Msp130. All Eve miR-31 TP embryos have negligible average changes (<2-fold) compared to the controls, except for SM37. In contrast, Wnt1 miR-31 TP injected embryos have the strongest effects, resulting in more than a 2-fold decrease in p58A, SM29, SM37, SM49, SM50 and Msp130. Embryos were collected at mesenchyme blastula stage (24 hpf). All error bars represent SEM. 3–5 biological replicates.
Figure 9
Figure 9. miR-31 KD embryos exhibit a delay in PMC ingression and express ectopic Vegf3 expression domain that correlates with PMC patterning defects.
WMISH was performed on embryos to visualize Vegf3 or VegfR10 followed by PMC immunolabeling with the 1D5 antibody. (A) Control and miR-31 KD embryos were collected at various time points spanning PMC ingression. VegfR10-expressing PMCs were categorized as either “ingressed, round” PMCs or “ingressing, bottle cell” PMCs. VegfR10-positive PMCs were counted through a series of Z-stack images. The percentage of “ingressed, round” PMCs from each embryo were calculated from the total of VegfR10-expressing PMCs. Average percentage was taken from each time point. For all conditions, a total of 30 embryos were measured for 3 biological replicates. NS=not significant, ***p<0.0001 using Cochran-Mantel-Haenszel test. All error bars represent SEM. 3 biological replicates. Scale bar = 50μm. (B) Embryos undergoing gastrulation were collected between 32 to 48 hpf. Embryos were first hybridized with Vegf3 RNA probe and followed with immunolabeling against 1D5 antibody that recognizes the PMCs (McClay et al., 1983). In control gastrulae, PMCs have migrated anteriorly in parallel to the Vegf3 gradient at 48hpf. In miR-31 KD gastrulae at 48 hpf, PMCs are clustered next to the concentrated Vegf3 expression domain. The general trend of Vegf3 expression domain correlates with the anterior distance of PMC migration. (C) Vegf3 expression is indicated in red. Zen software was used to determine the center of gastrulae in the vegetal view and to determine angles of Vegf3 expression, VE, and DE domains. In the vegetal view (VV), the measured angle of Vegf3 (V1/V2) expression domain in miR-31 KD is expanded into the VE compared to control. N is the total number of Vegf3 expression domains measured. 3 biological replicates. NS=not significant. *p<0.05, ***p<0.0001 using Student’s t-test. All error bars represent SEM. Scale bar = 50μm. Representative images were taken with ZEISS Observer Z1 microscope.
Figure 10
Figure 10. miR-31 directly represses components within the PMC GRN and transcripts upstream of Vegf3.
(A) miR-31’s regulation of Eve and Wnt1 indirectly impacts Vegf3 expression in the blastula stage. Removing miR-31’s direction suppression of Eve results in an expansion of Vegf3 expression domain, while removing miR-31’s direct suppression of Wnt1 results in an anterior shift of Vegf3 expression. (B) The expansion of Vegf3 in the BE-DVM in miR-31 KD embryos could be due to increased Wnt1, thus increasing Wnt1’s restriction of Nodal from the posterior-ventral region during gastrula stage. Decreased Nodal would result in less Not1 expression, leading to less Vegf3 restriction in the BE-DVM. VV = Ventral view; LV = Lateral view; A = anterior; P = posterior; V = ventral; D = dorsal. (C) We previously identified miR-31 directly suppresses Pmar1, Alx1 and Snail, which are expressed in the PMCs (Stepicheva and Song, 2015). cWnt/β-catenin triggers specification of PMCs by activating the transcriptional repressor Pmar1 expressed exclusively in the micromeres. Pmar1 inhibits transcriptional repressor HesC (Guss and Ettensohn, 1997; Oliveri et al., 2003; Revilla-i-Domingo et al., 2007). This leads to the activation of Alx1, which in turn, activates Snail and VegfR10 (Ettensohn et al., 2003; Rafiq et al., 2012; Sharma and Ettensohn, 2011). VegfR10 is expressed on the PMCs and is thought to respond to the Vegf3 ligand secreted by the ectoderm to guide patterning of PMCs. In this study, we identified Eve and Wnt1 as direct miR-31 targets upstream of Vegf3 activation.

Similar articles

Cited by

References

    1. Adomako-Ankomah A, Ettensohn CA, 2011. P58-A and P58-B: novel proteins that mediate skeletogenesis in the sea urchin embryo. Dev Biol 353, 81–93. - PubMed
    1. Adomako-Ankomah A, Ettensohn CA, 2013. Growth factor-mediated mesodermal cell guidance and skeletogenesis during sea urchin gastrulation. Development 140, 4214–4225. - PubMed
    1. Adomako-Ankomah A, Ettensohn CA, 2014. Growth factors and early mesoderm morphogenesis: insights from the sea urchin embryo. Genesis 52, 158–172. - PubMed
    1. Anstrom JA, 1992. Microfilaments, cell shape changes, and the formation of primary mesenchyme in sea urchin embryos. J Exp Zool 264, 312–322. - PubMed
    1. Bartel DP, 2009. MicroRNAs: target recognition and regulatory functions. Cell 136, 215–233. - PMC - PubMed

Publication types

MeSH terms

LinkOut - more resources