. 2021 May:152:105274.
doi: 10.1016/j.nbd.2021.105274. Epub 2021 Jan 20.

Early changes in synaptic and intrinsic properties of dentate gyrus granule cells in a mouse model of Alzheimer's disease neuropathology and atypical effects of the cholinergic antagonist atropine

Affiliations

Early changes in synaptic and intrinsic properties of dentate gyrus granule cells in a mouse model of Alzheimer's disease neuropathology and atypical effects of the cholinergic antagonist atropine

David Alcantara-Gonzalez et al. Neurobiol Dis. 2021 May.

Abstract

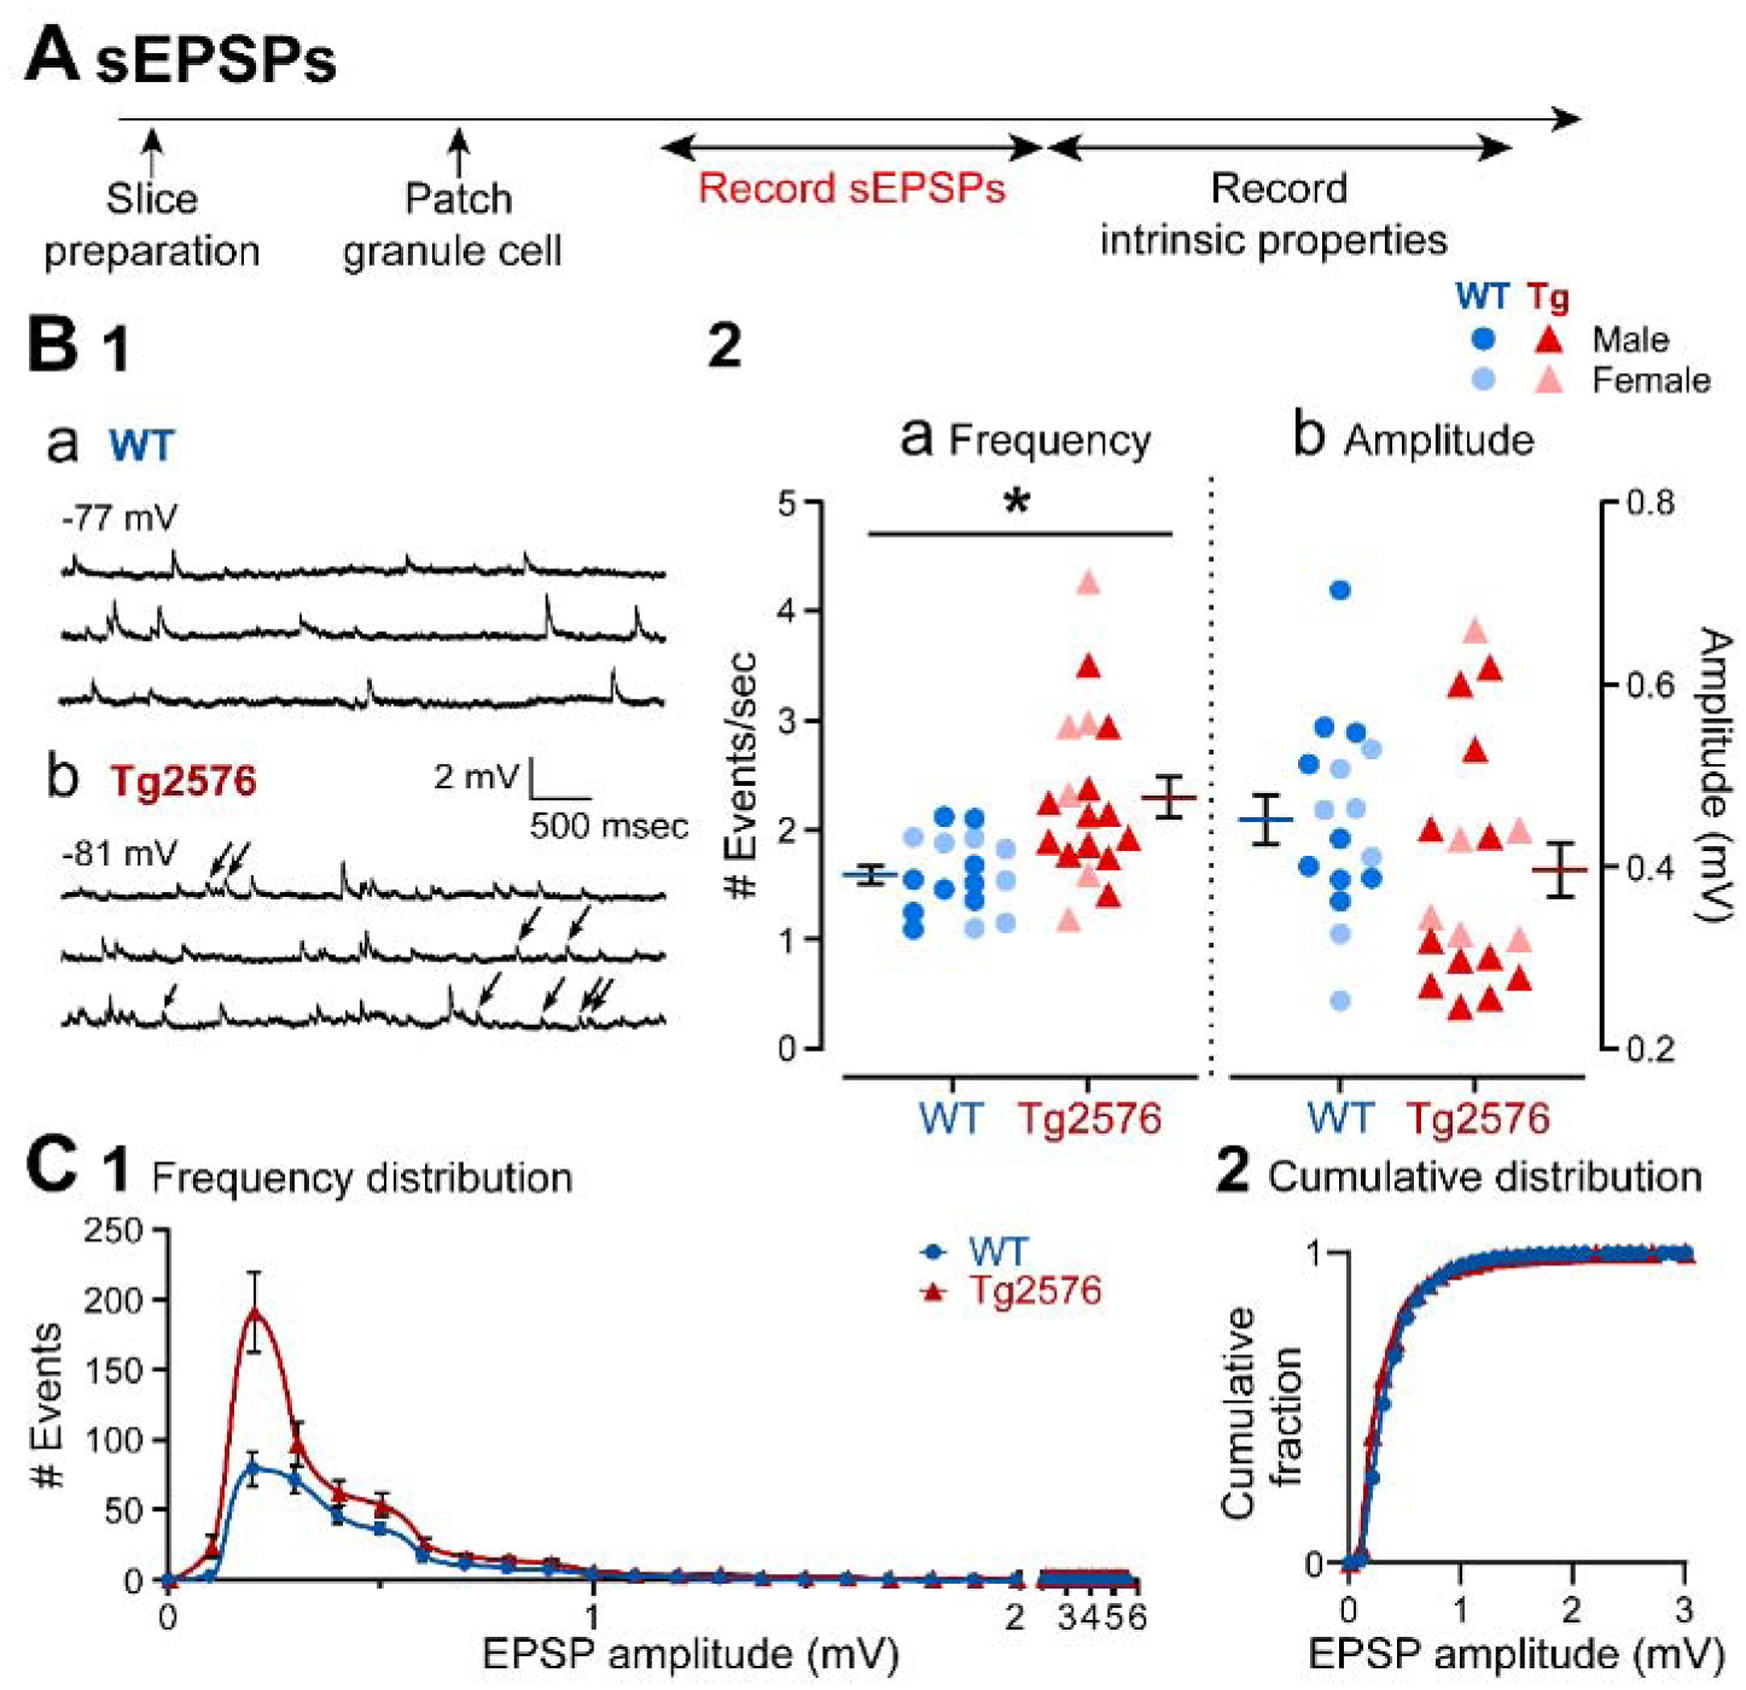
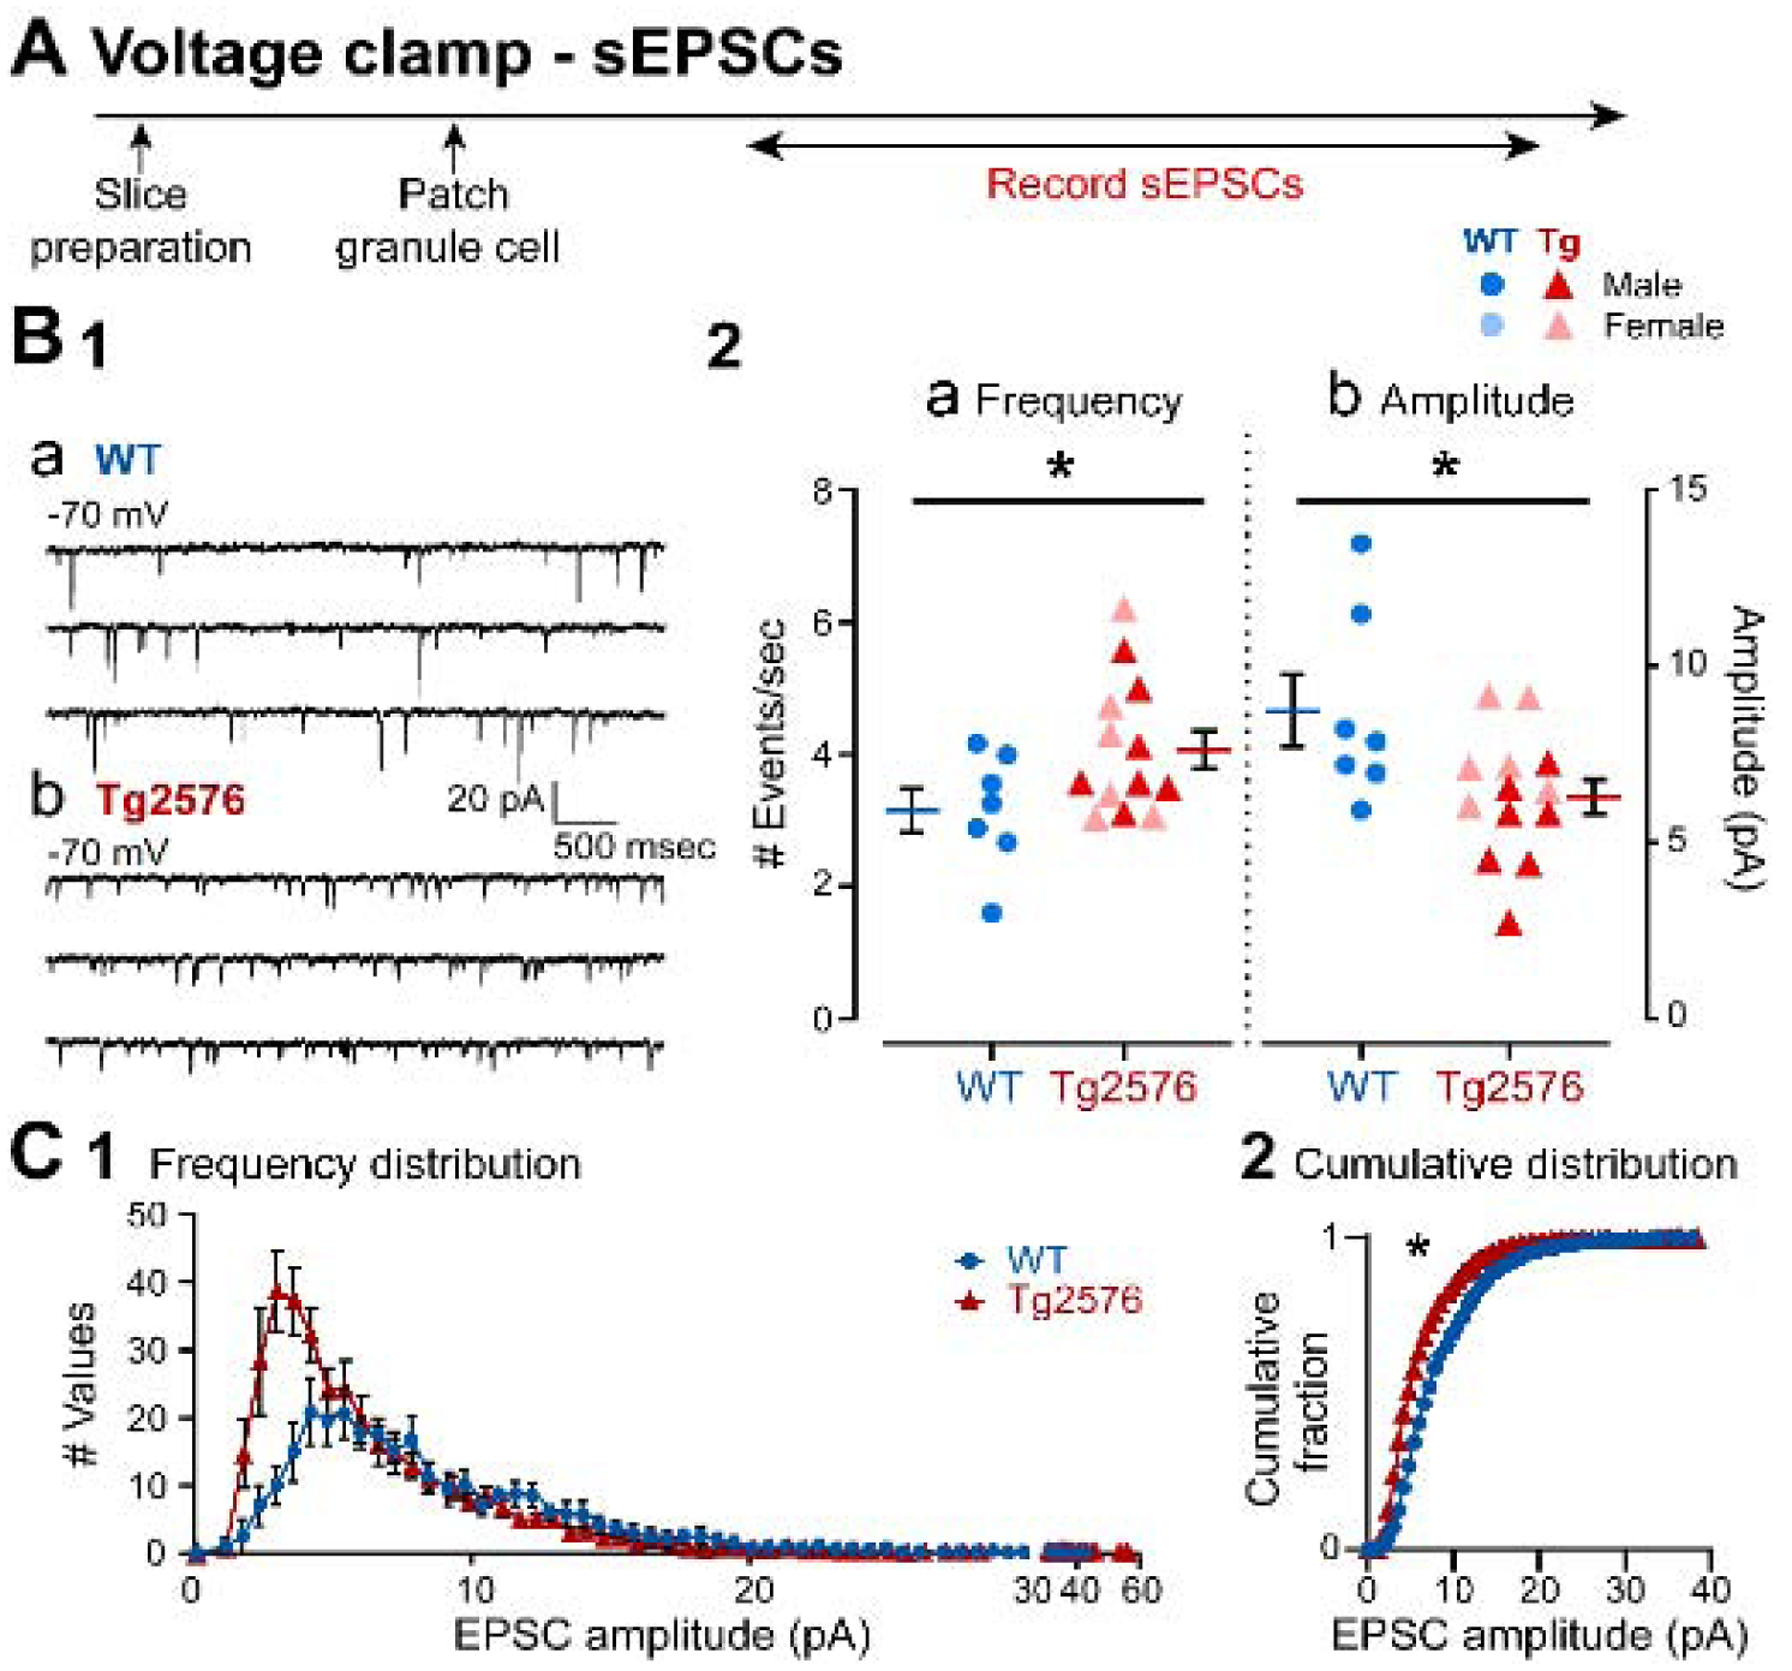
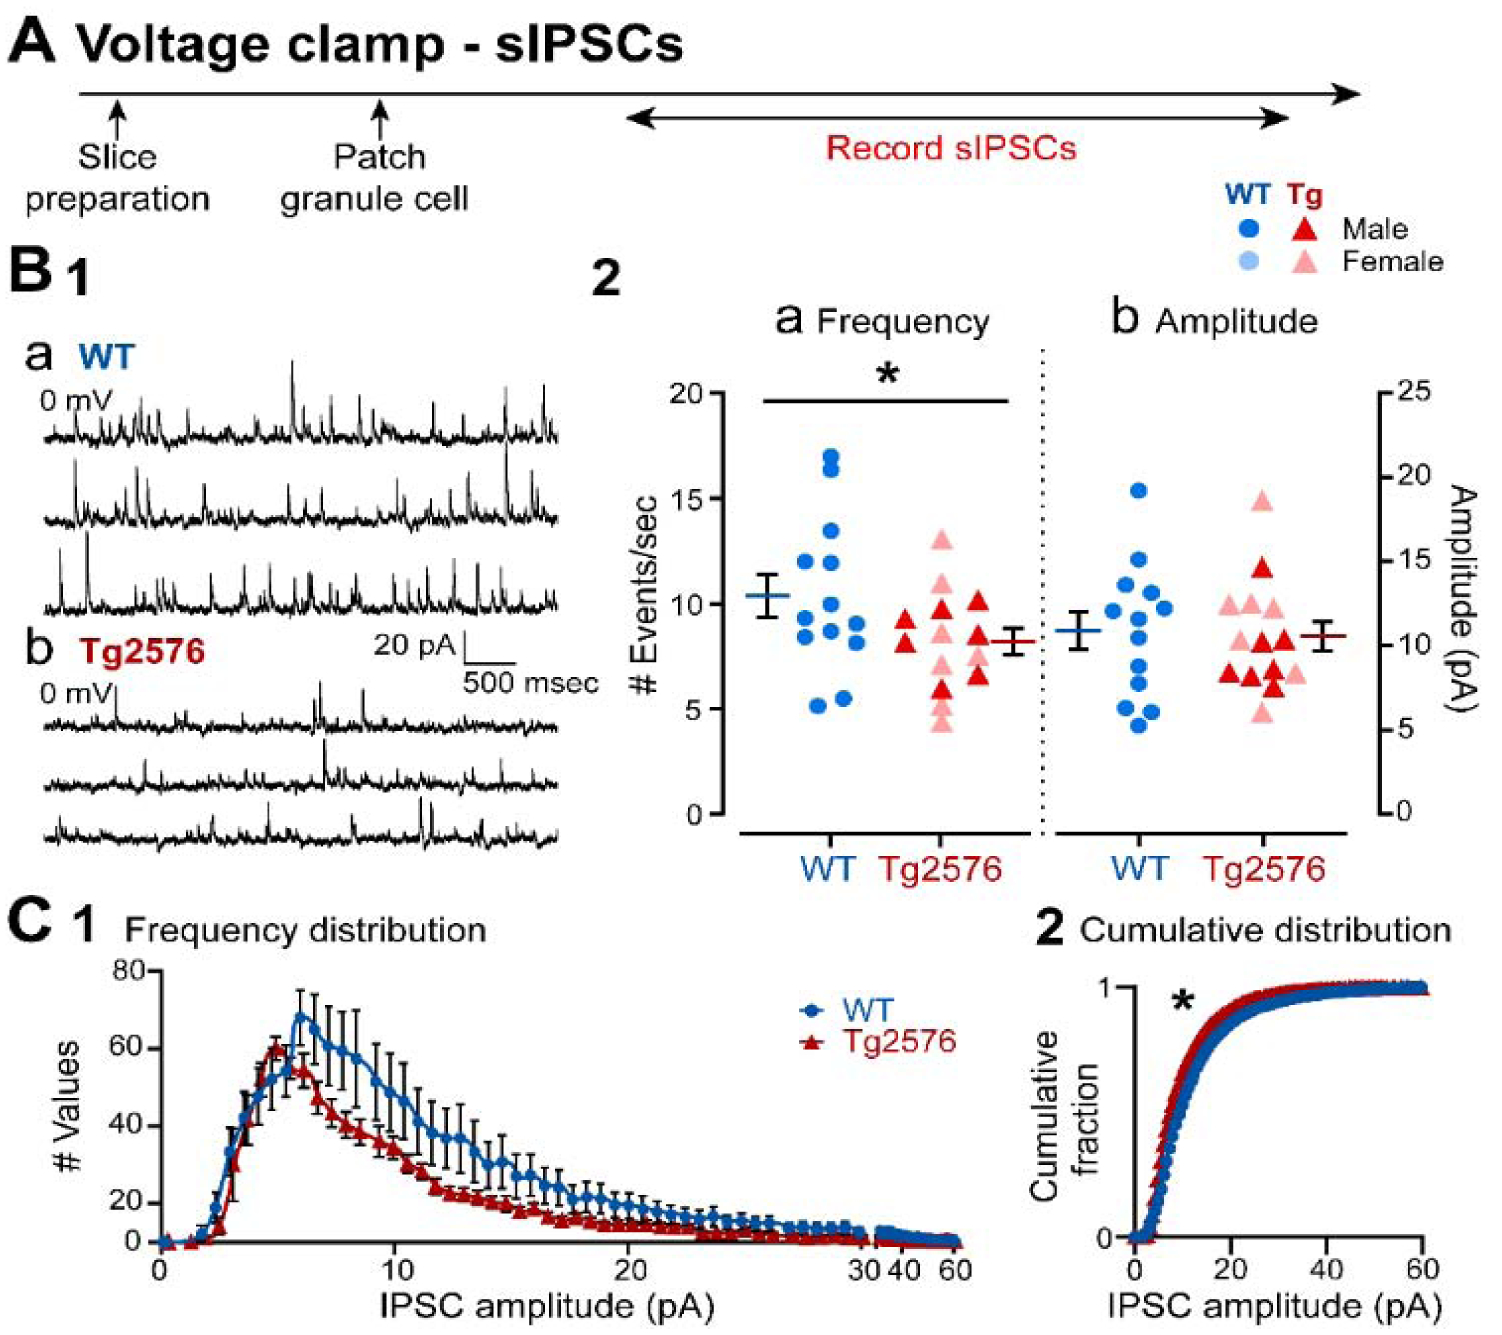
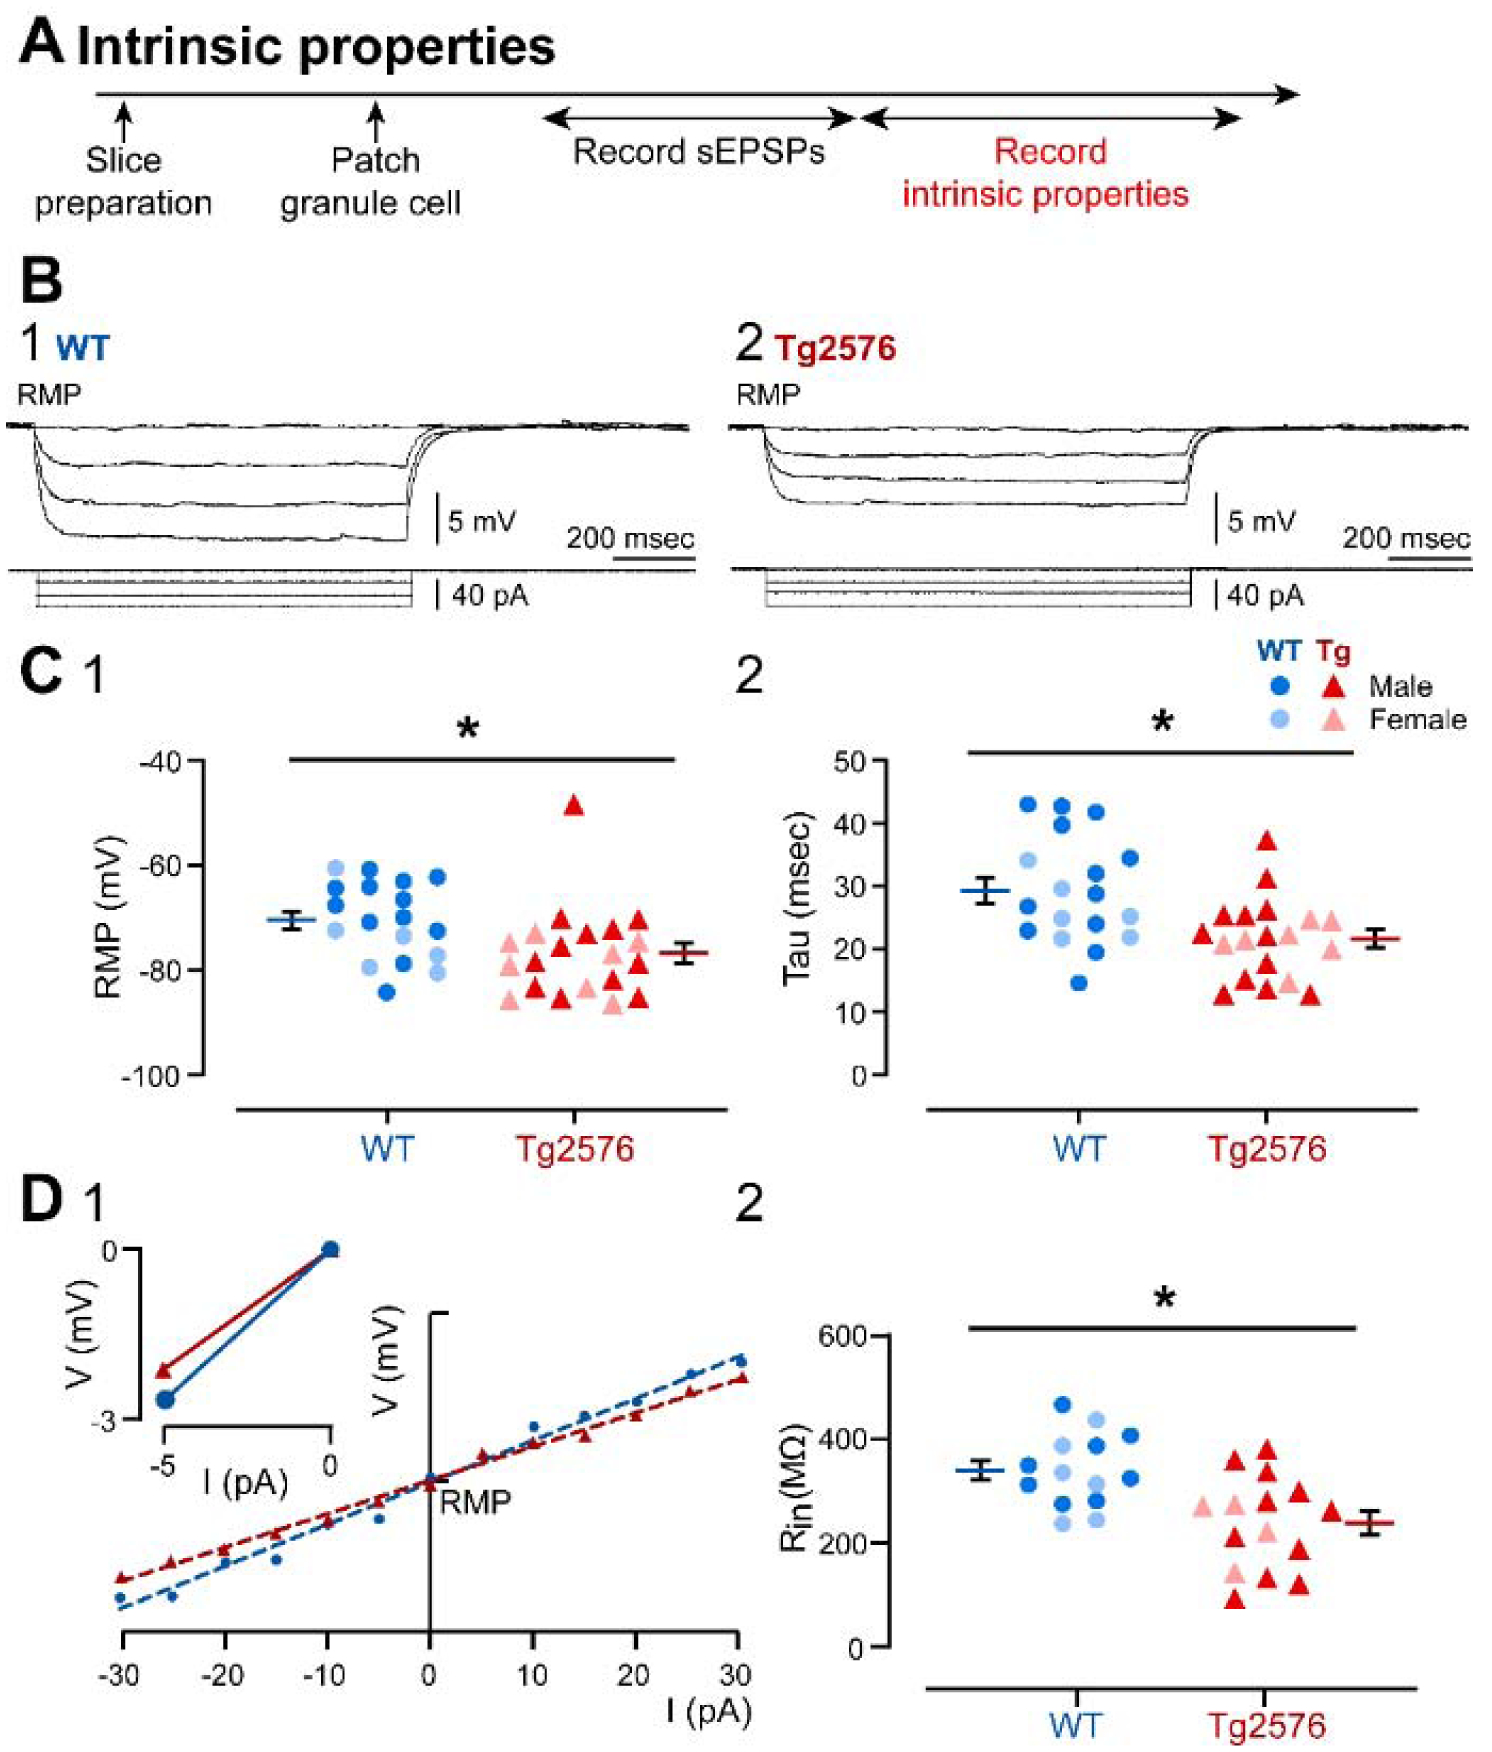
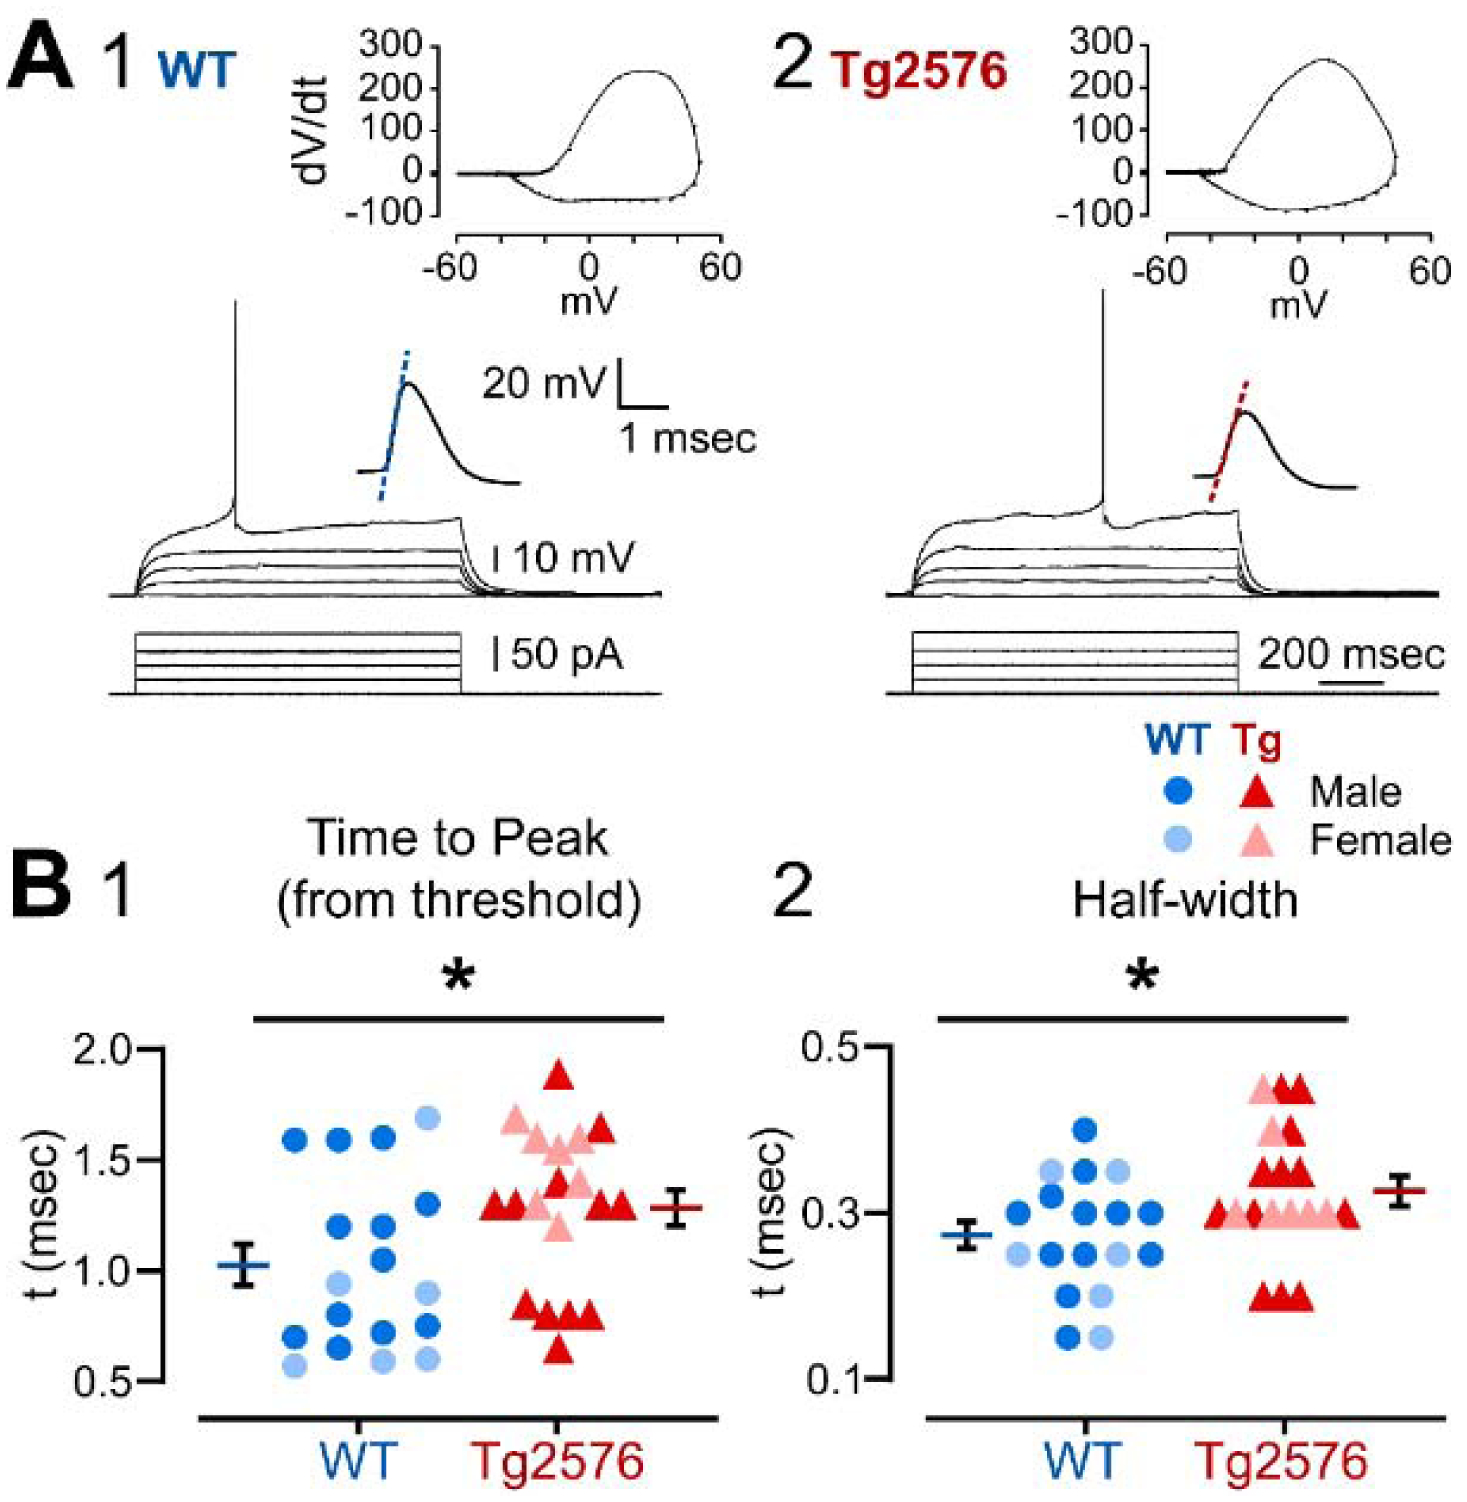
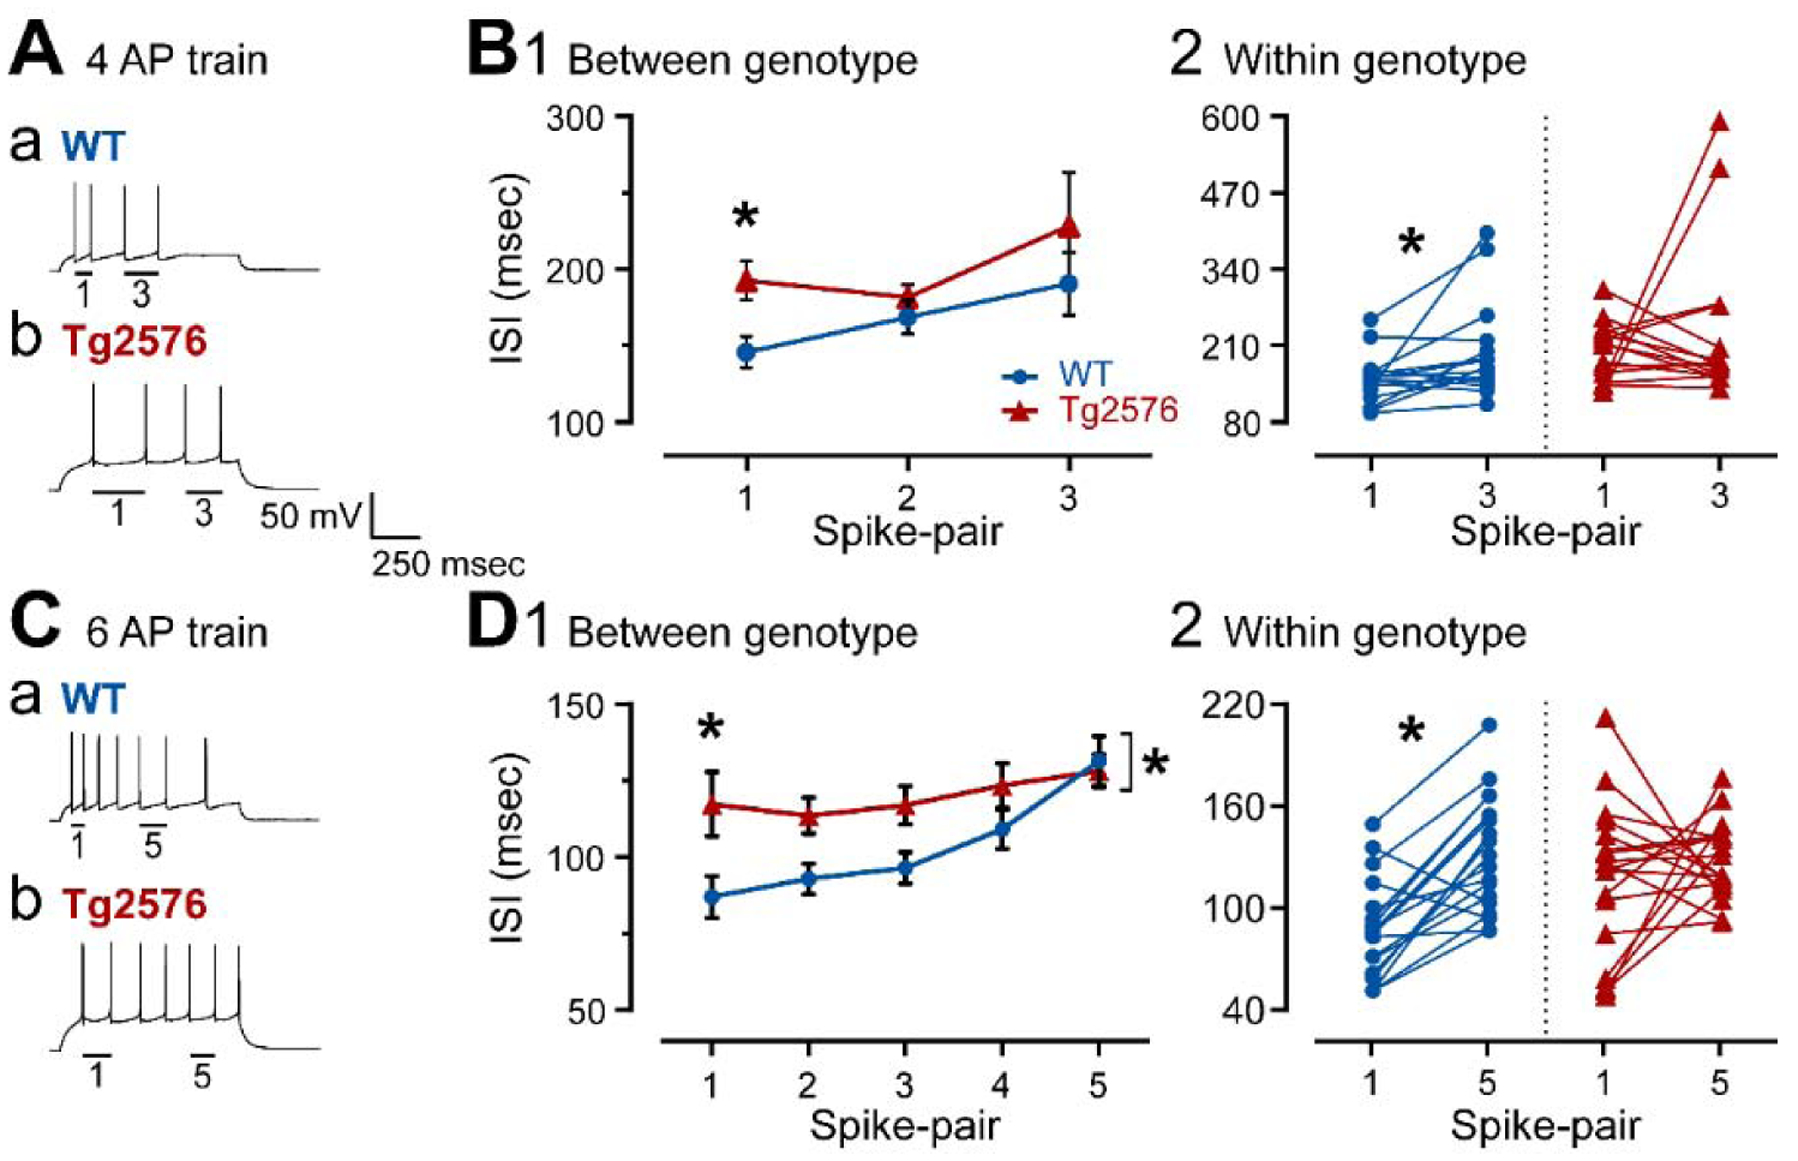
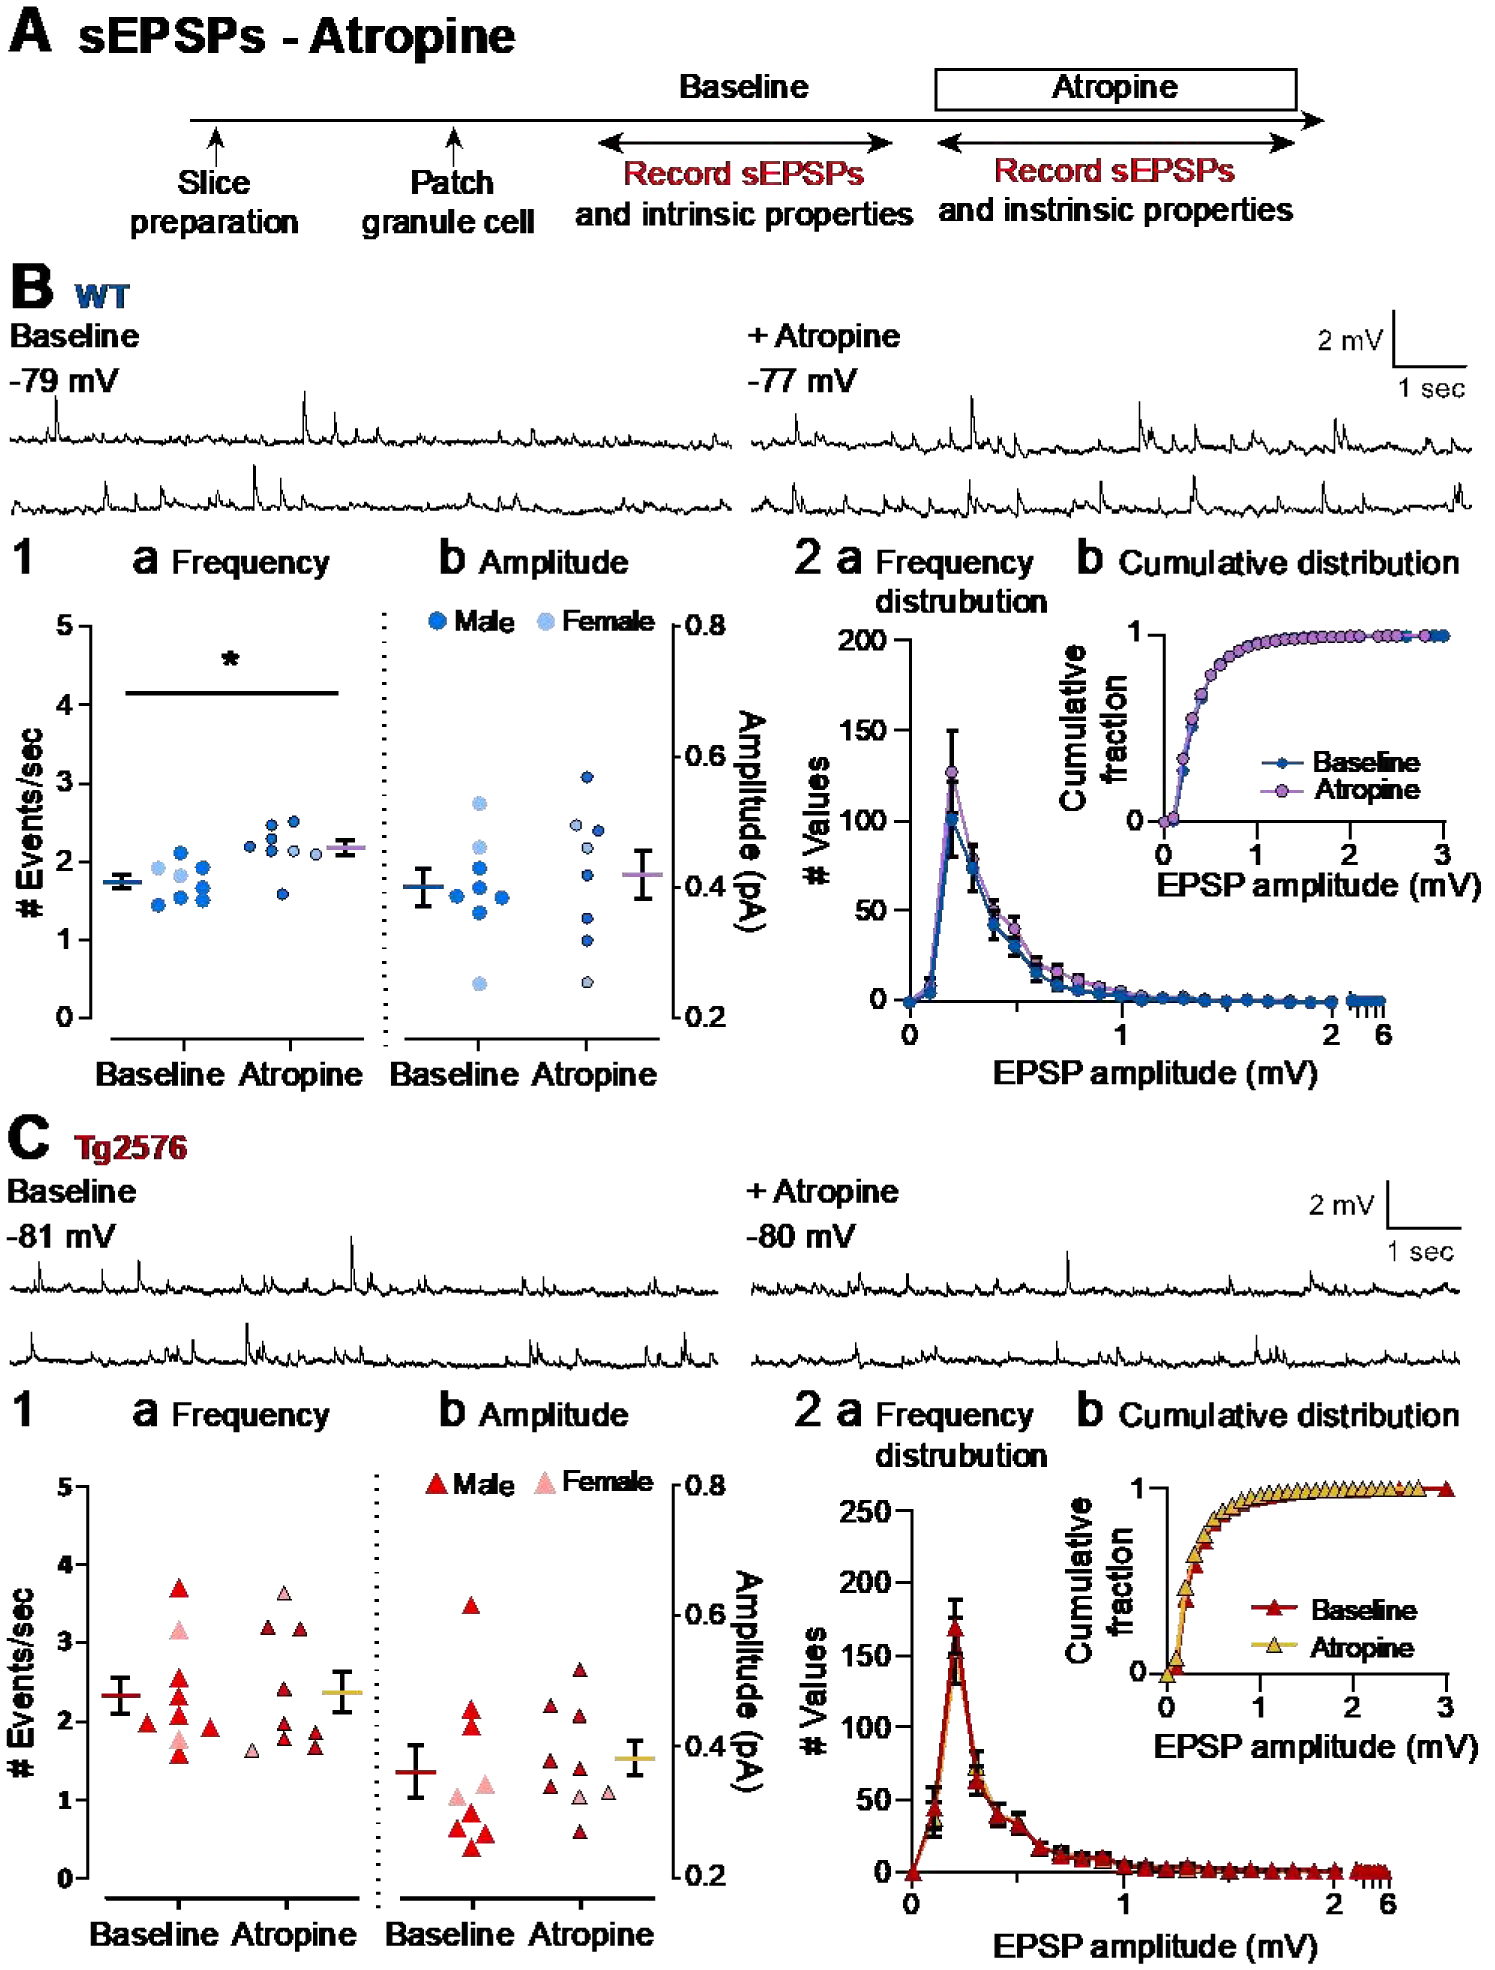
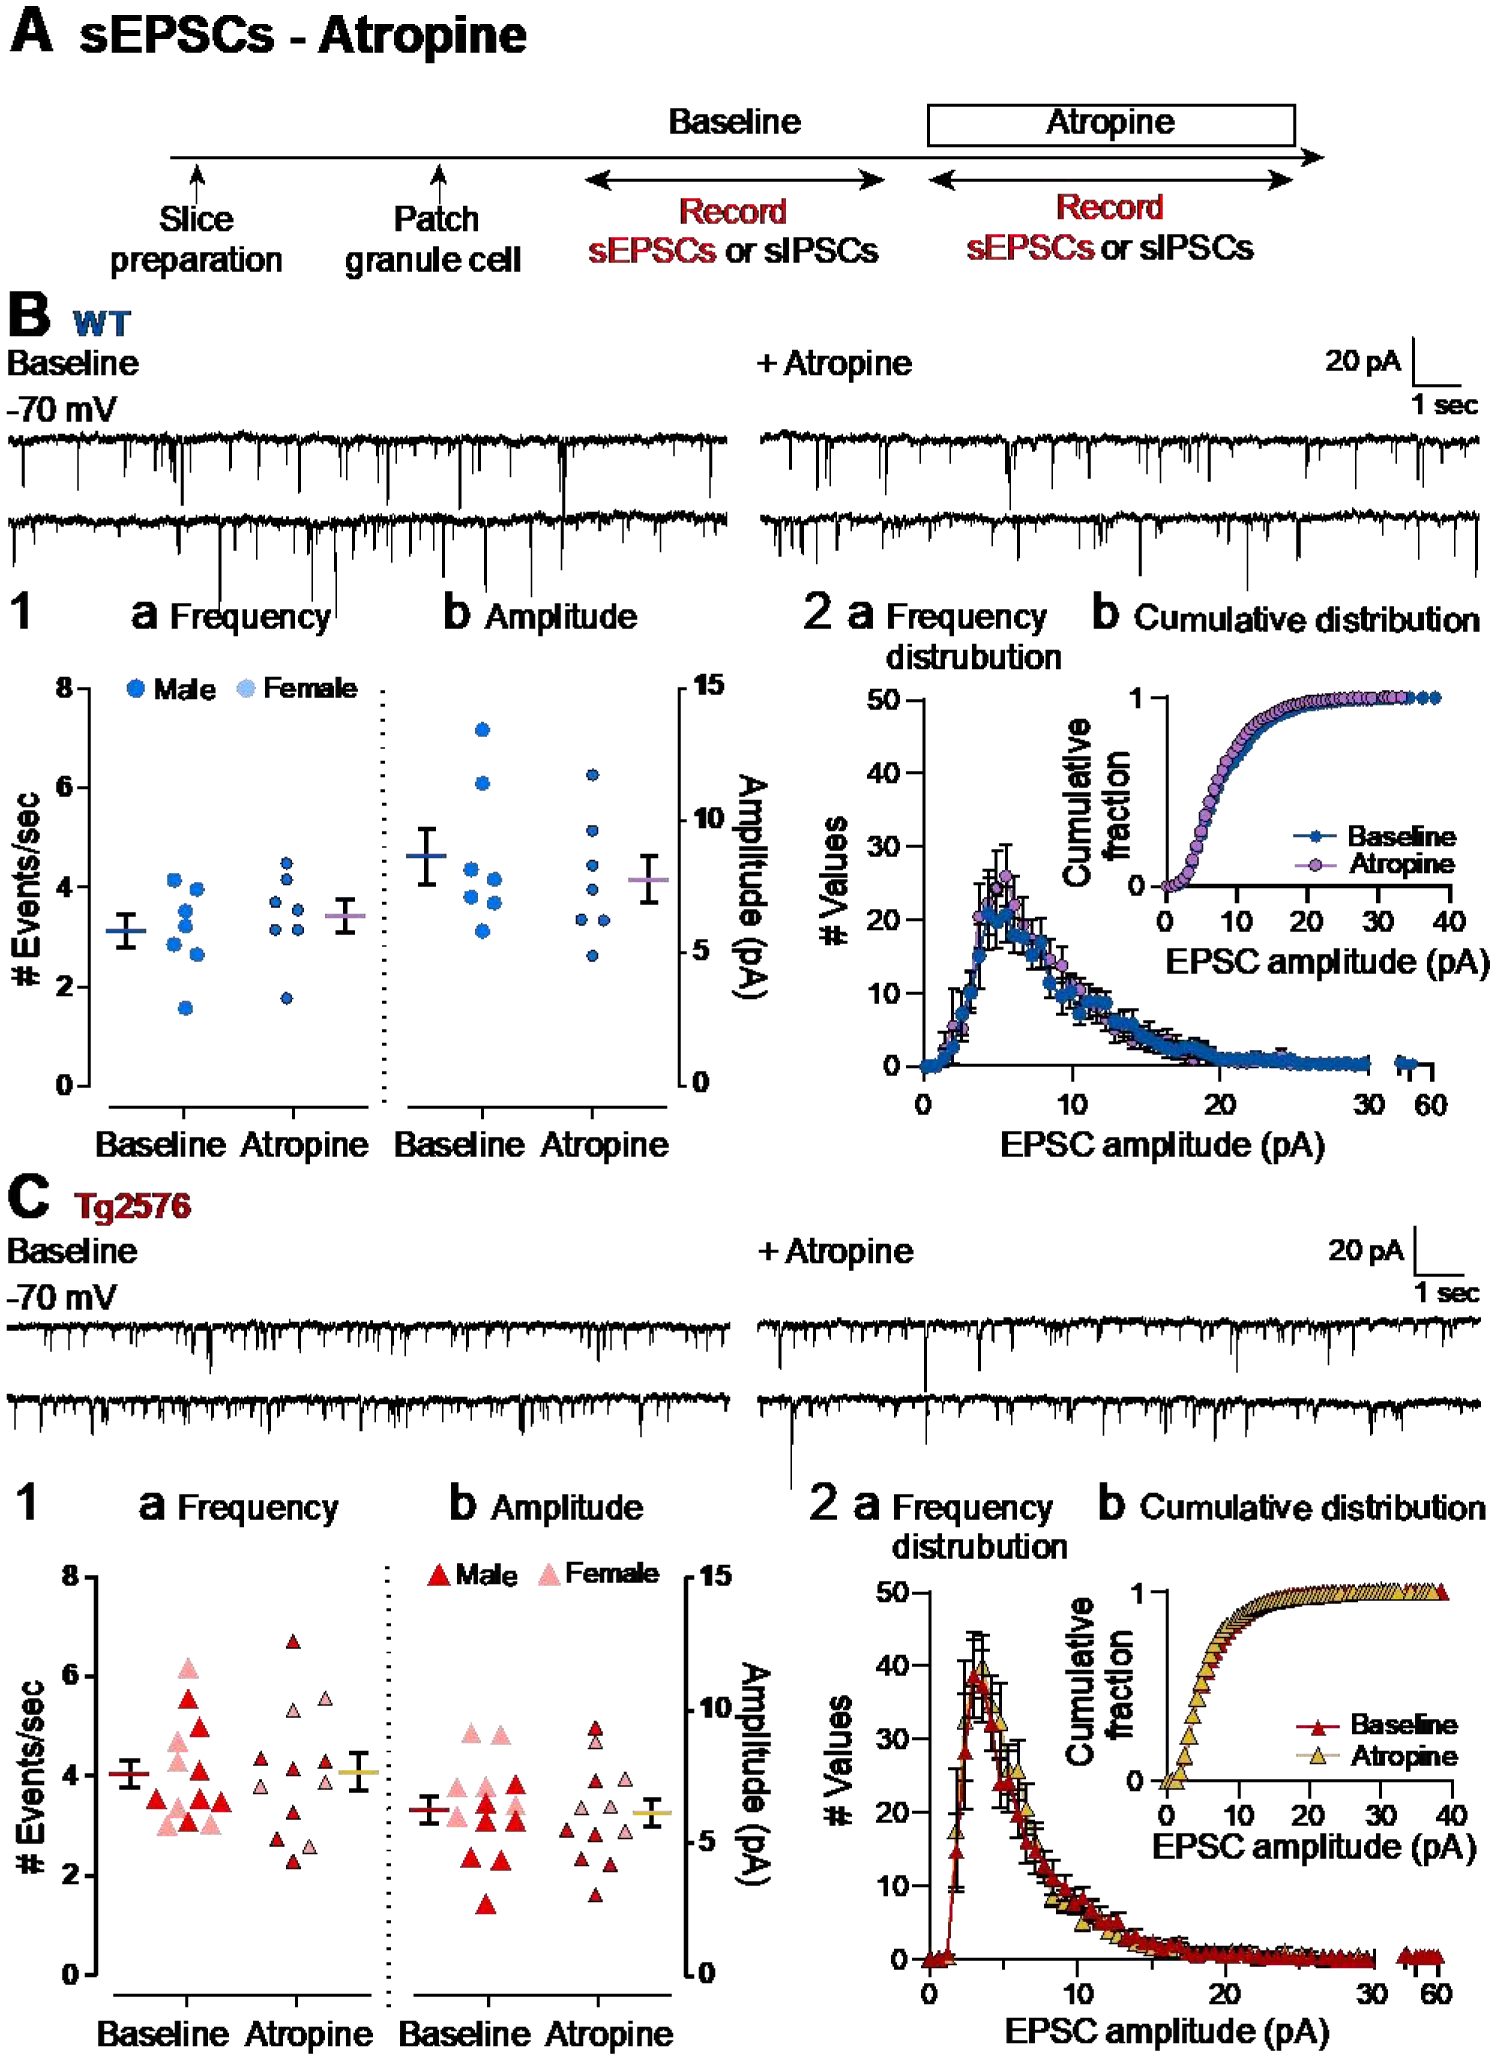
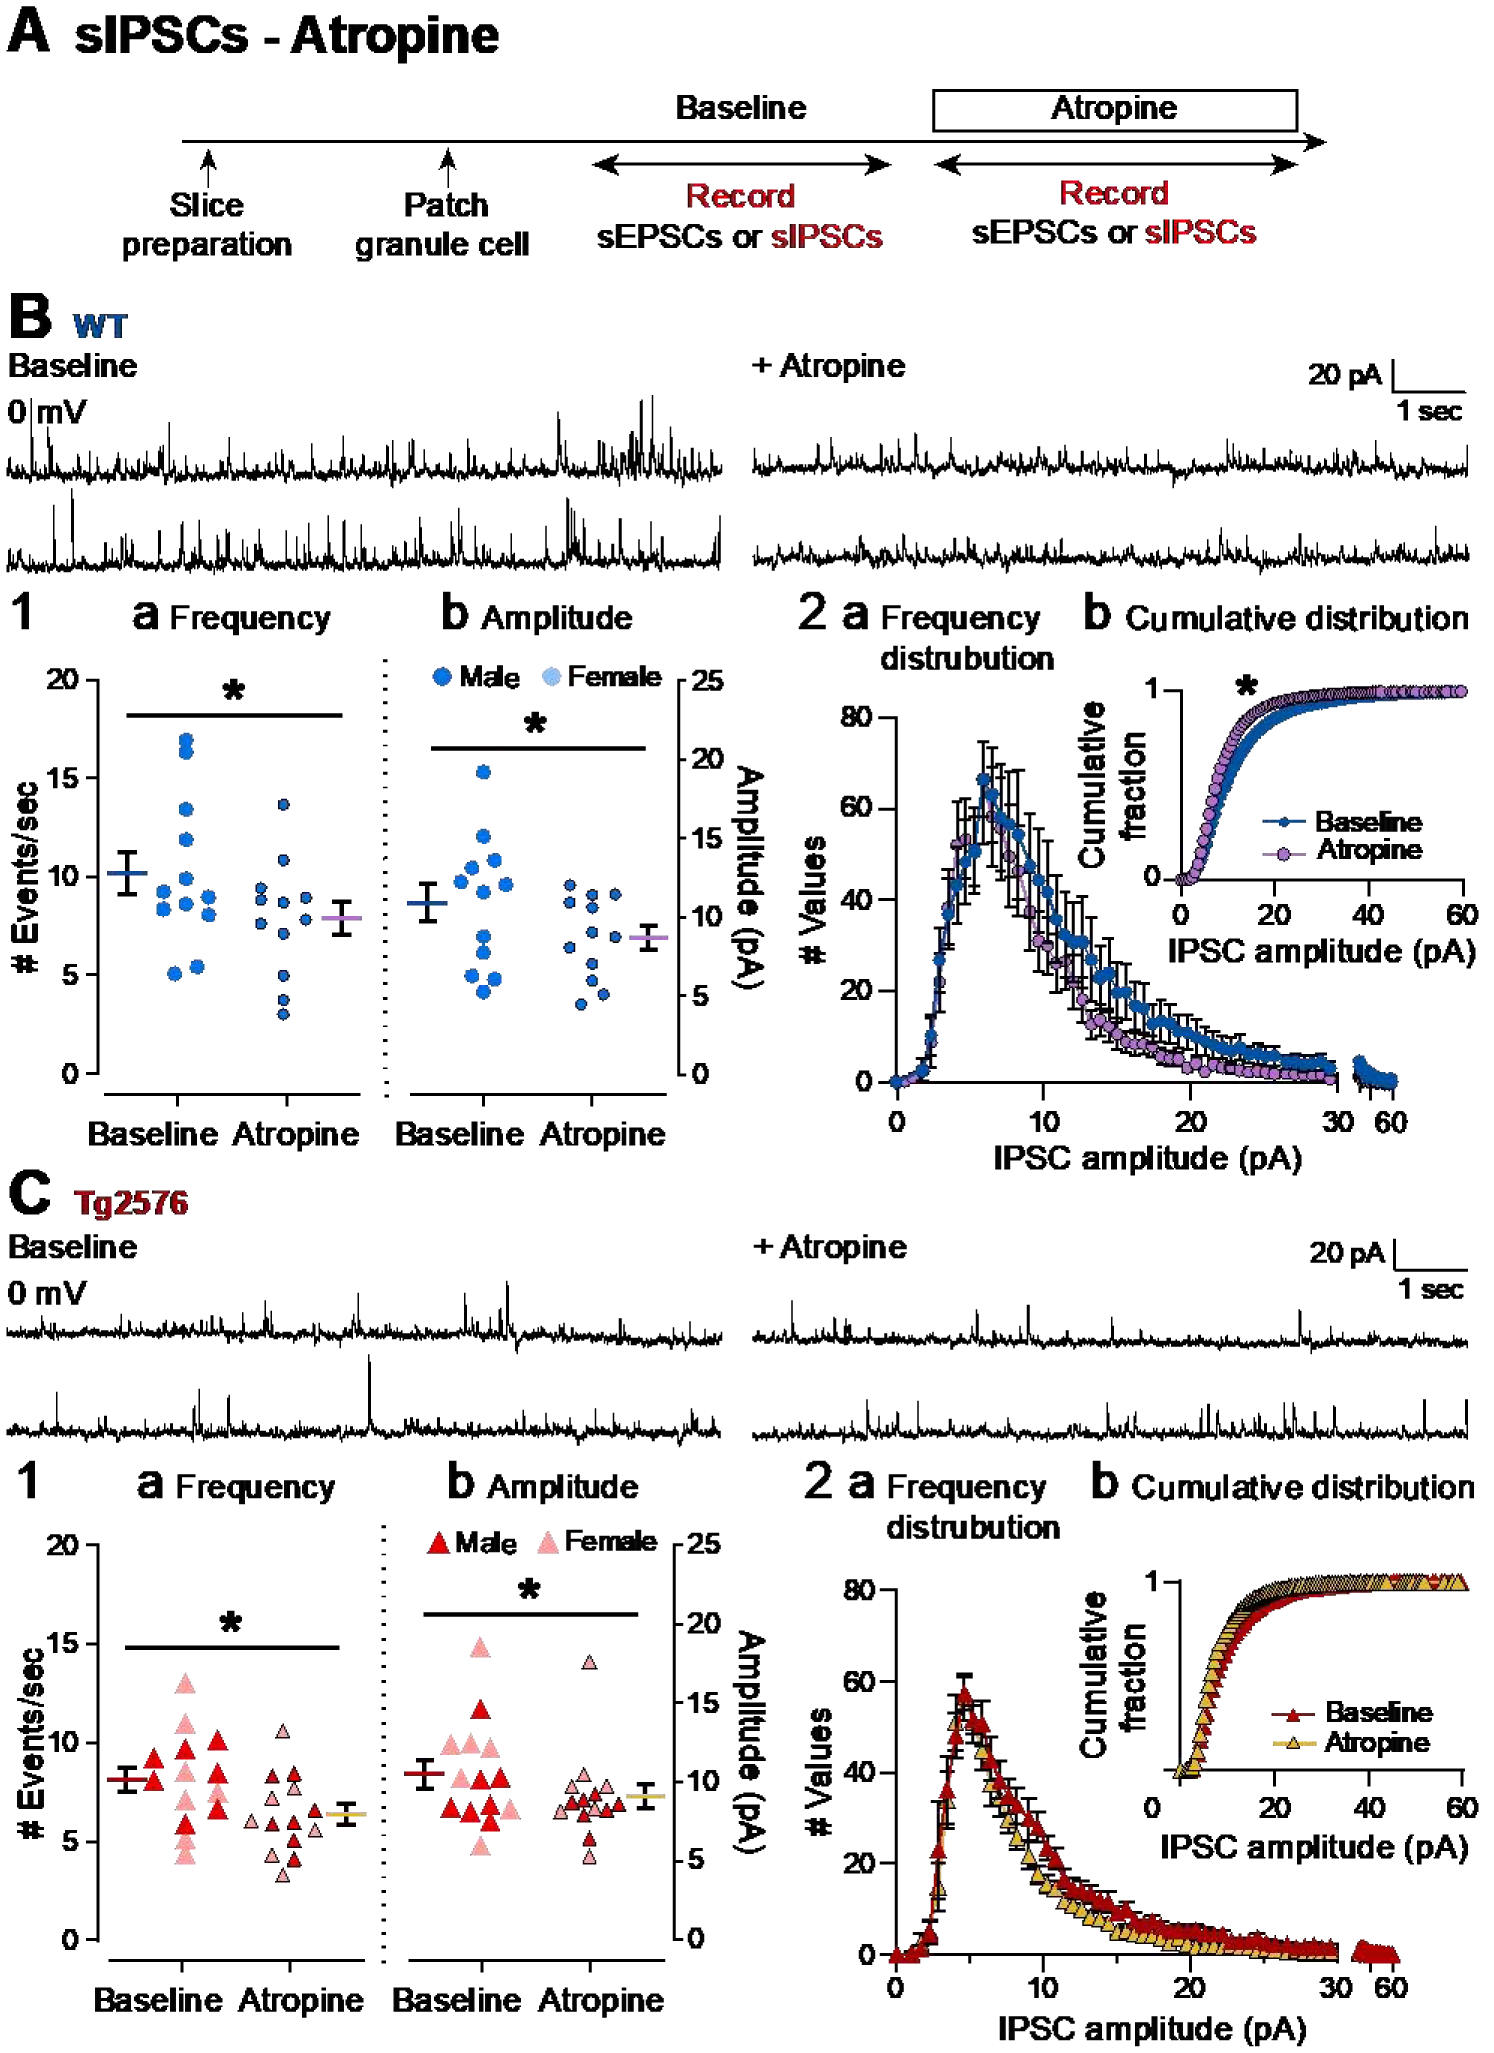
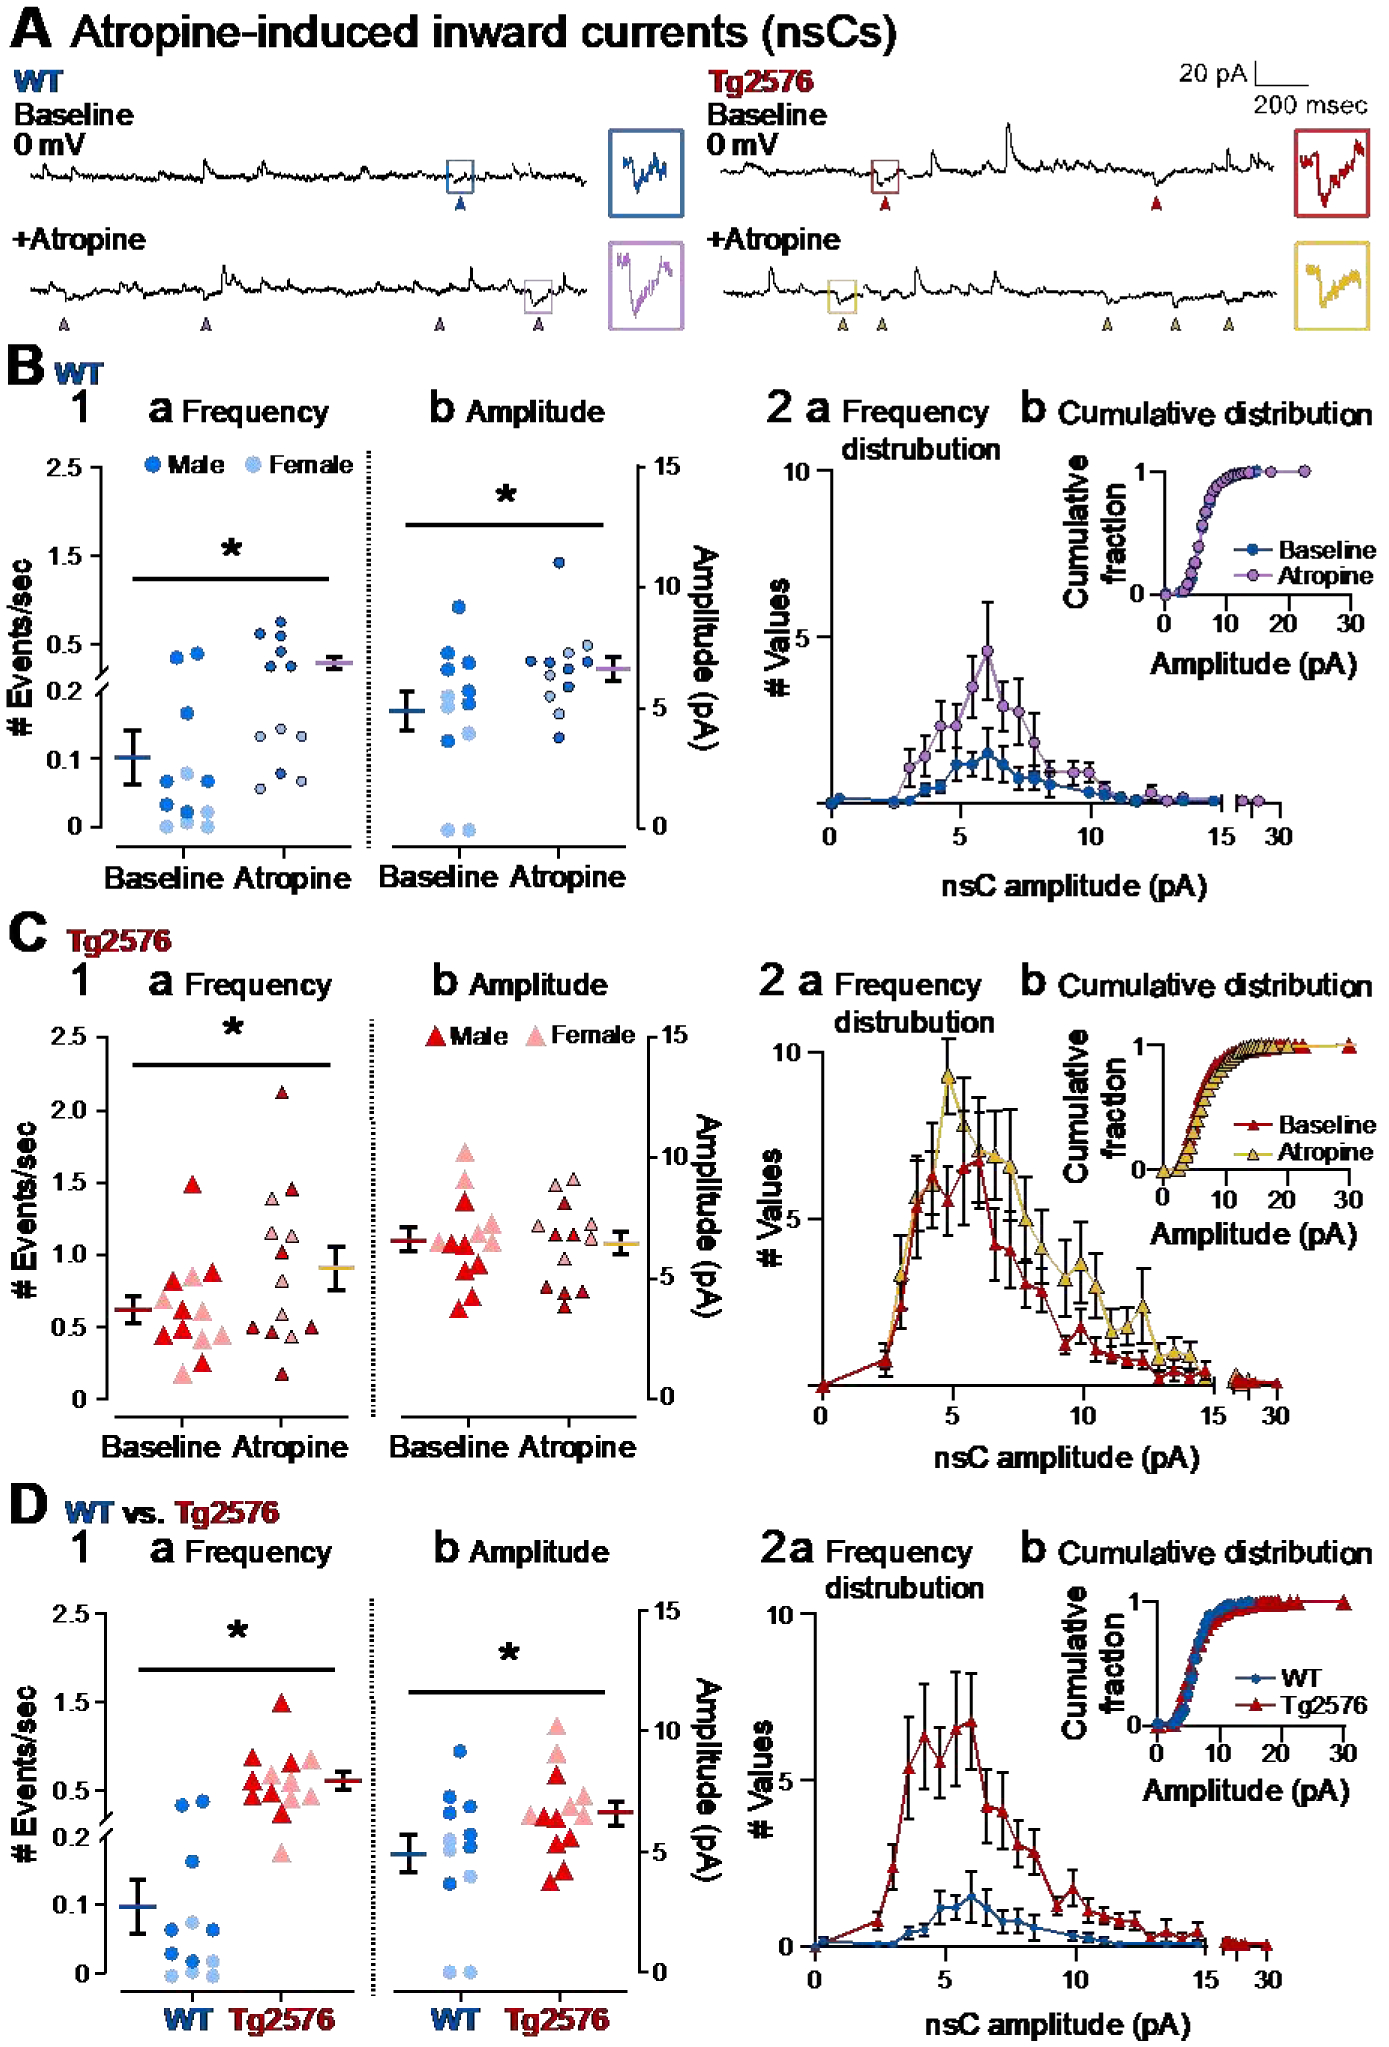
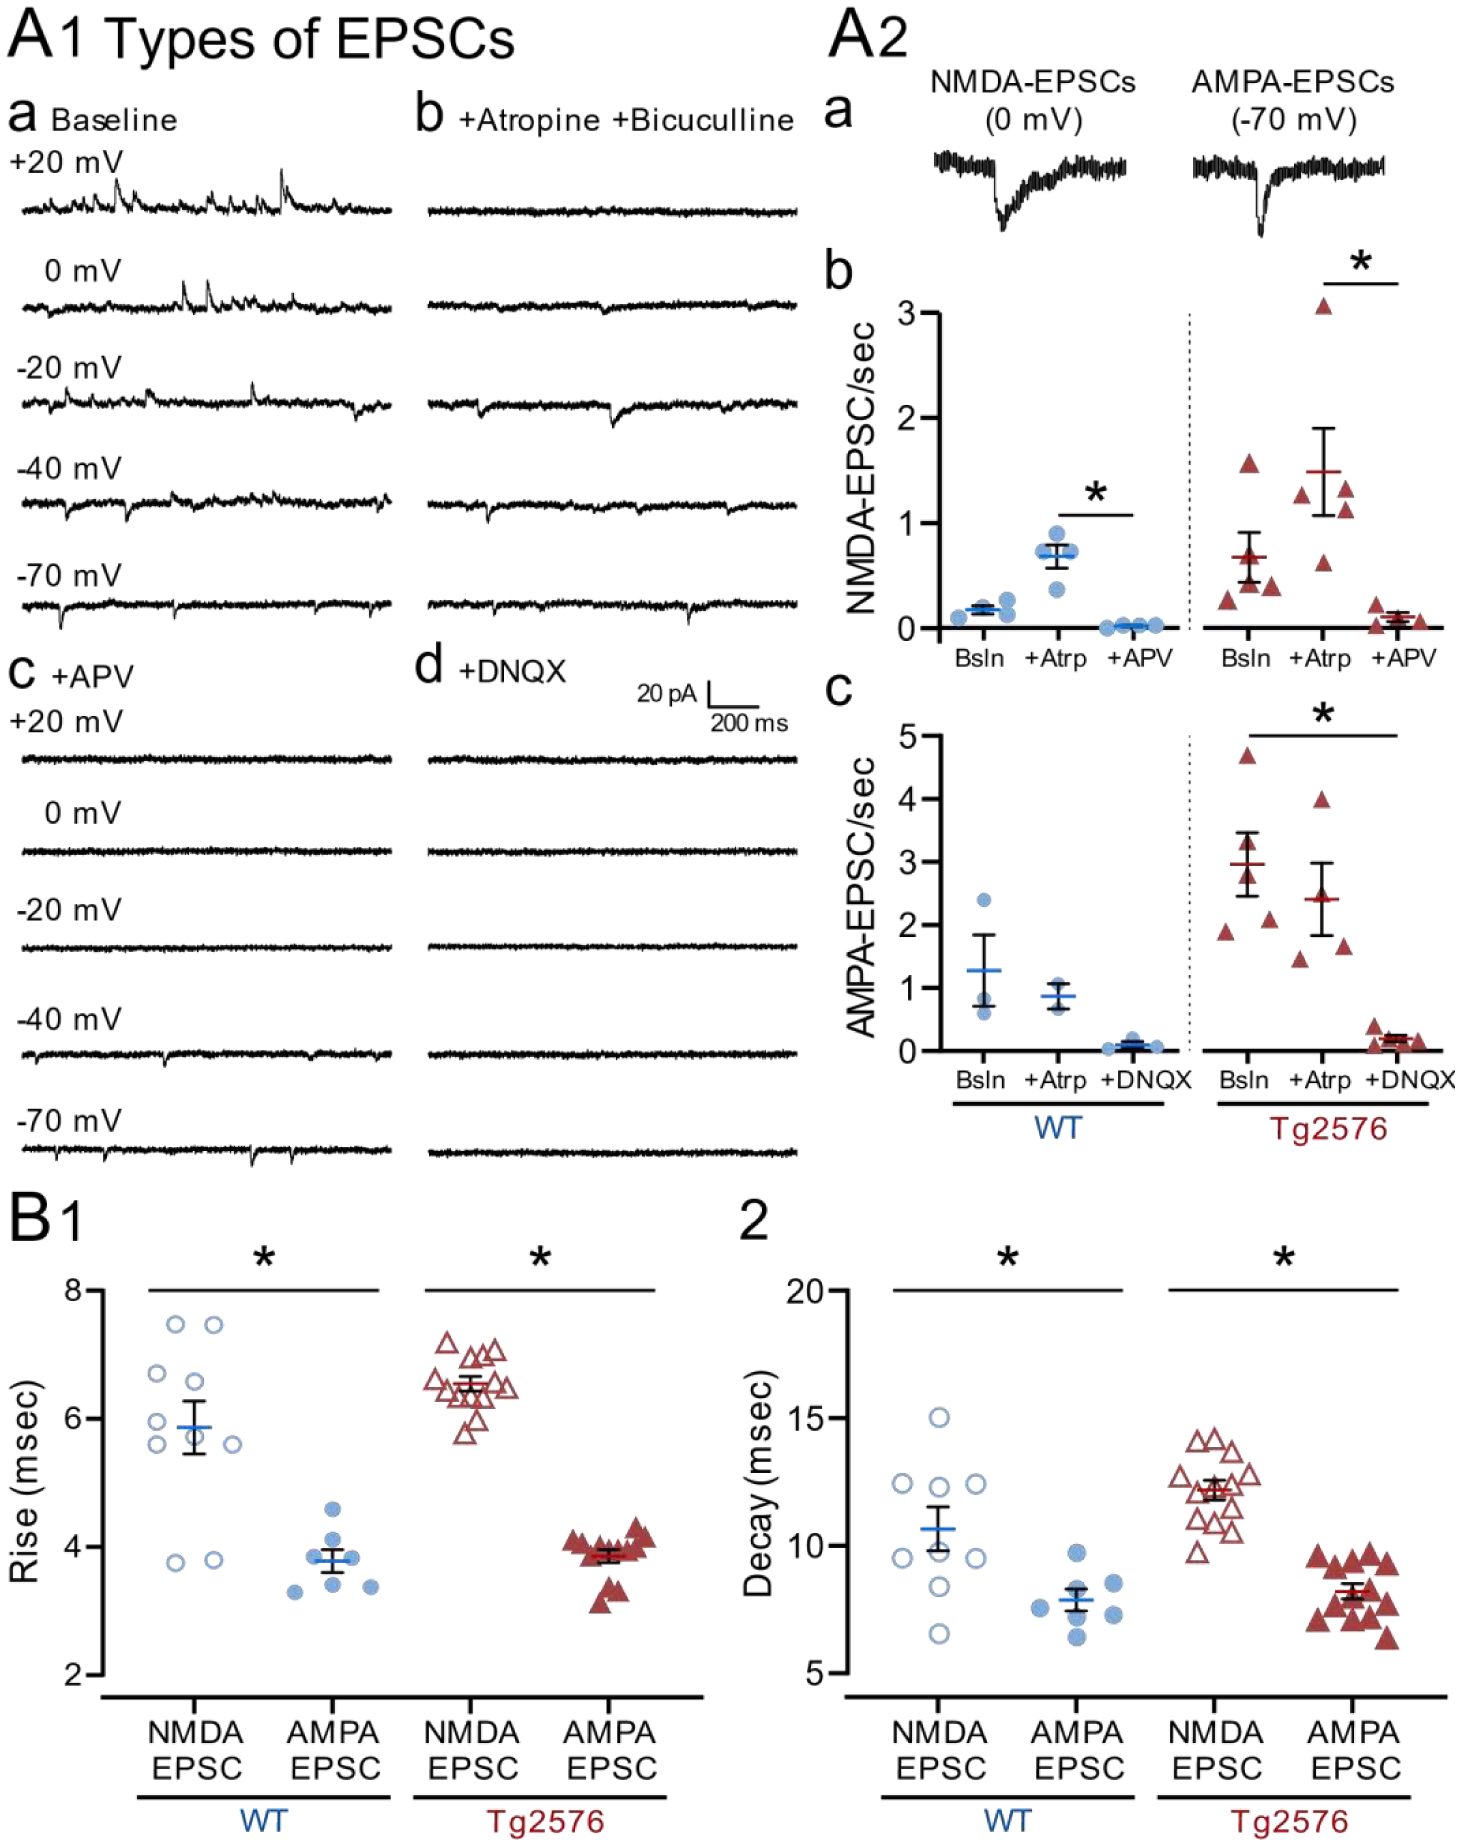
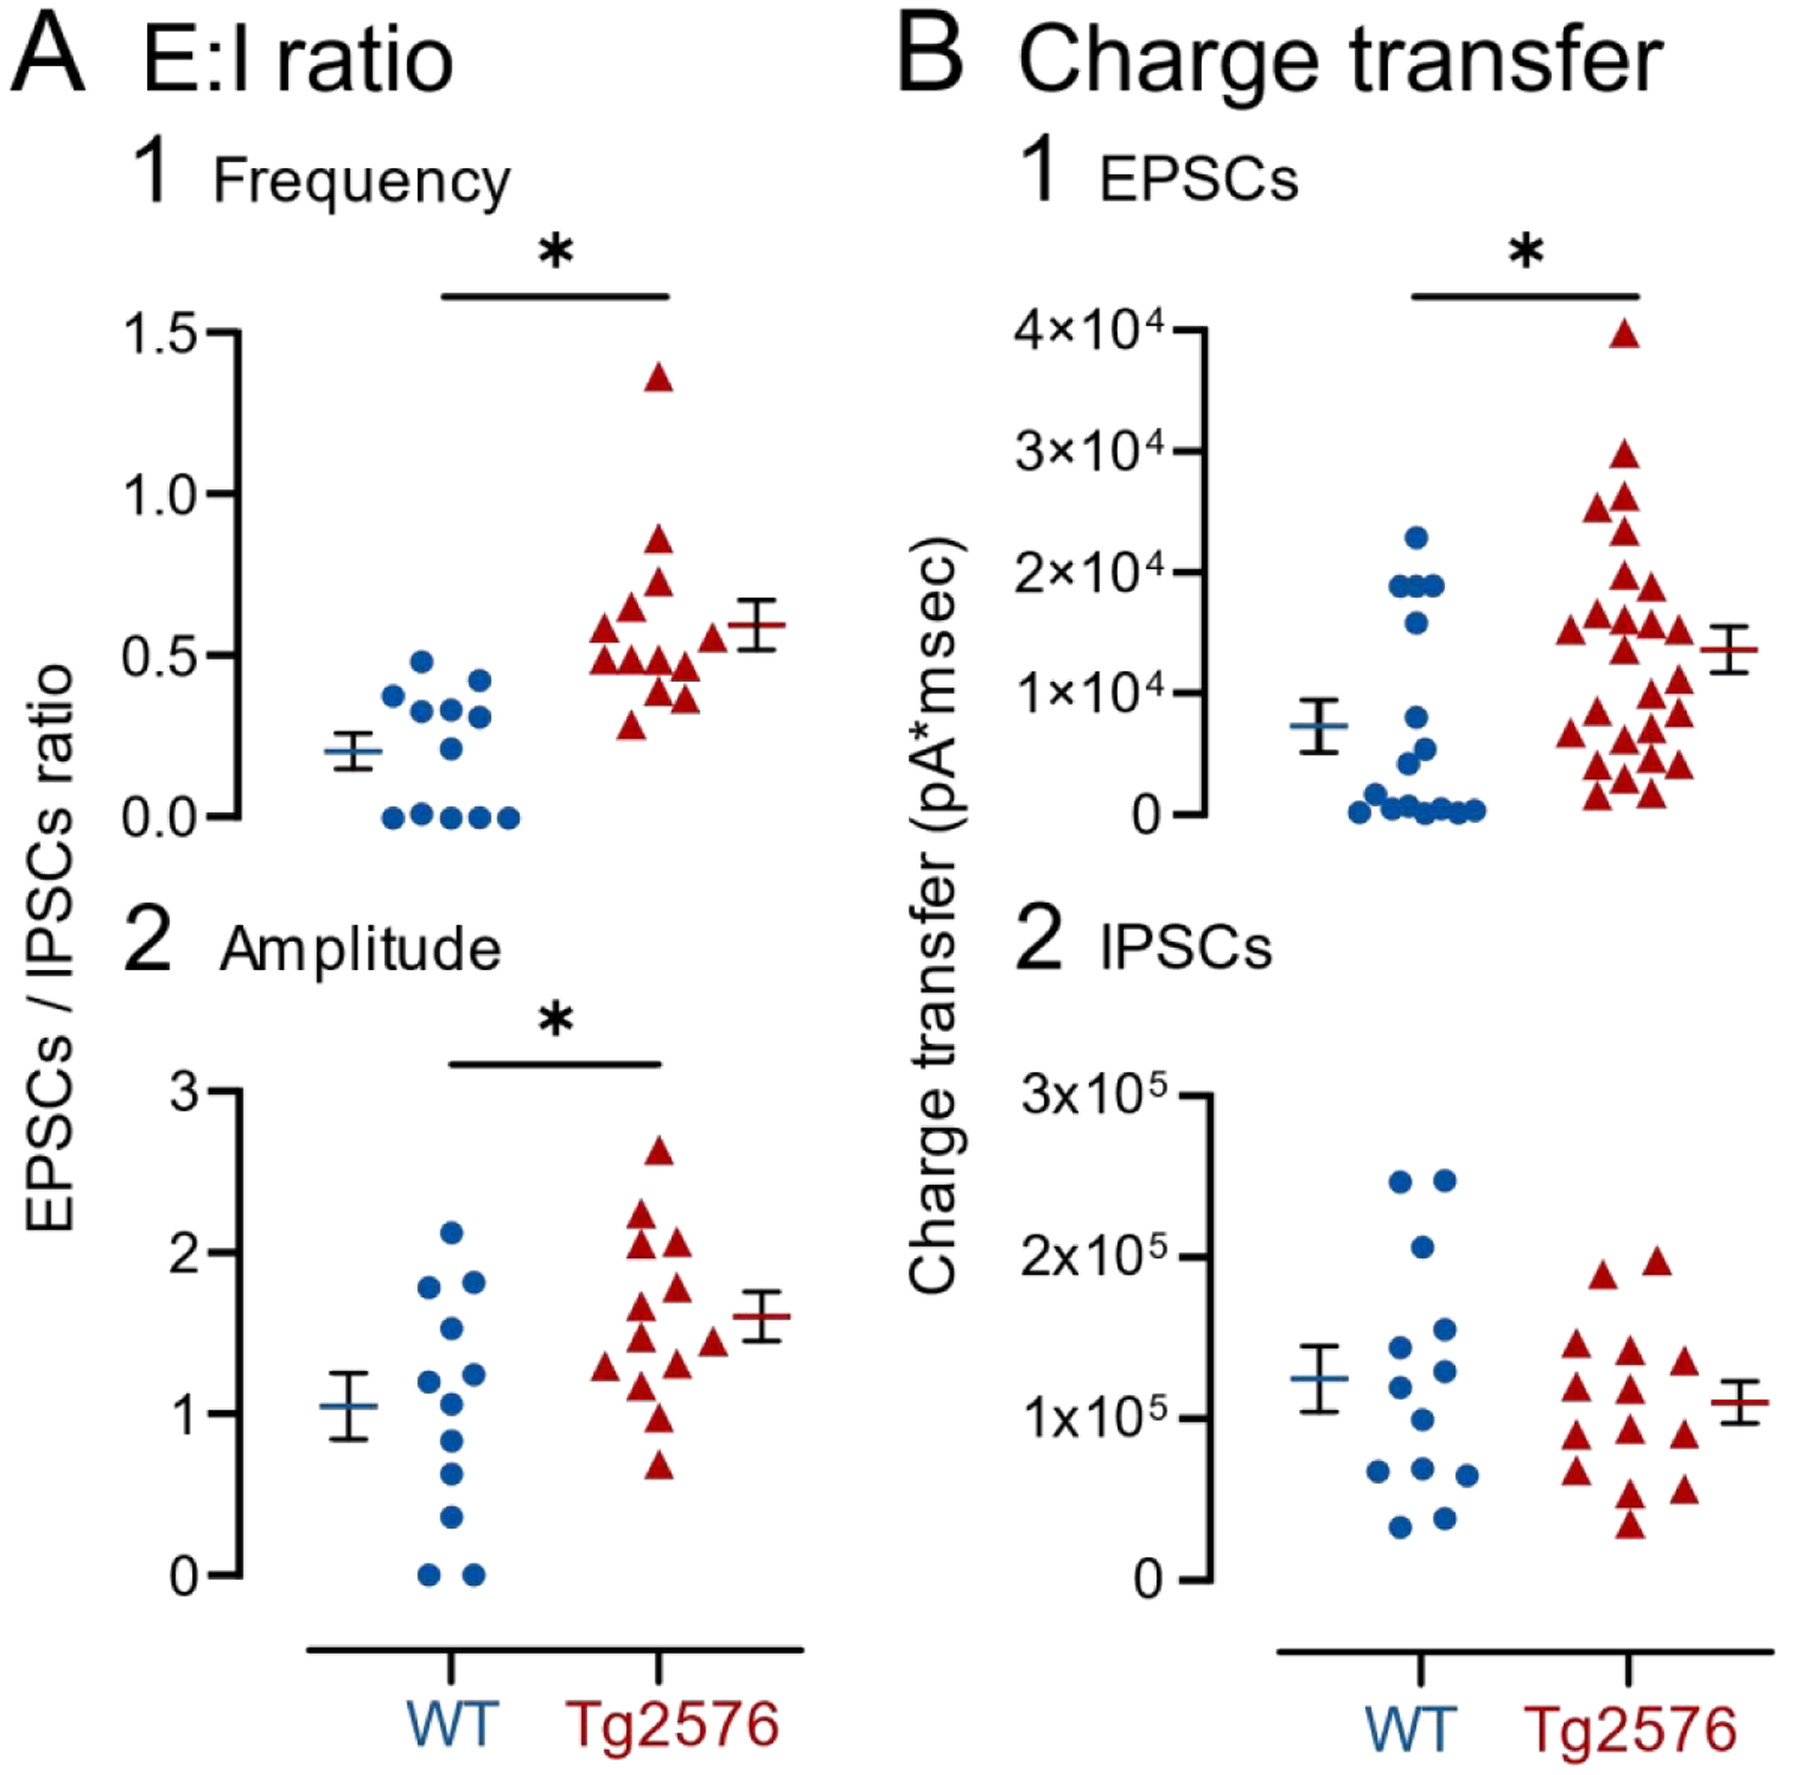
It has been reported that hyperexcitability occurs in a subset of patients with Alzheimer's disease (AD) and hyperexcitability could contribute to the disease. Several studies have suggested that the hippocampal dentate gyrus (DG) may be an important area where hyperexcitability occurs. Therefore, we tested the hypothesis that the principal DG cell type, granule cells (GCs), would exhibit changes at the single-cell level which would be consistent with hyperexcitability and might help explain it. We used the Tg2576 mouse, where it has been shown that hyperexcitability is robust at 2-3 months of age. GCs from 2 to 3-month-old Tg2576 mice were compared to age-matched wild type (WT) mice. Effects of muscarinic cholinergic antagonism were tested because previously we found that Tg2576 mice exhibited hyperexcitability in vivo that was reduced by the muscarinic cholinergic antagonist atropine, counter to the dogma that in AD one needs to boost cholinergic function. The results showed that GCs from Tg2576 mice exhibited increased frequency of spontaneous excitatory postsynaptic potentials/currents (sEPSP/Cs) and reduced frequency of spontaneous inhibitory synaptic events (sIPSCs) relative to WT, increasing the excitation:inhibition (E:I) ratio. There was an inward NMDA receptor-dependent current that we defined here as a novel synaptic current (nsC) in Tg2576 mice because it was very weak in WT mice. Intrinsic properties were distinct in Tg2576 GCs relative to WT. In summary, GCs of the Tg2576 mouse exhibit early electrophysiological alterations that are consistent with increased synaptic excitation, reduced inhibition, and muscarinic cholinergic dysregulation. The data support previous suggestions that the DG contributes to hyperexcitability and there is cholinergic dysfunction early in life in AD mouse models.

Keywords: Acetylcholine; Hyperexcitability; Intrinsic properties; Muscarinic receptors; Synaptic currents; Synaptic potentials.


Conflict of interest statement

Declarations of interest: none.

Figures

Figure 1.
Figure 1.. sEPSPs in GCs from Tg2576 mice are increased relative to WT mice.
(A) The timeline of the electrophysiological recordings for the determination of the sEPSPs and intrinsic properties from GCs. (B1) Representative traces show typical sEPSPs obtained in (a) WT and (b) Tg2576 mice. (B2) Quantification of sEPSP frequency and amplitude in WT and Tg2576 GCs. SEPSP frequency was significantly greater in Tg2576 mice, but not amplitude. (C1) A histogram shows the frequency distribution of sEPSP amplitudes. (C2) The cumulative distribution is shown. Differences between WT and Tg2576 GCs were not significant. Data are represented as mean ± SEM. *p<0.05. Specific p values and statistics are in the text.
Figure 2.
Figure 2.. sEPSCs in GCs from Tg2576 mice are increased relative to WT mice.
(A) The timeline of the electrophysiological recordings for the determination of sEPSCs from GCs. (B1) Representative traces show the typical sEPSCs obtained in (a) WT and (b) Tg2576 mice from −70 mV holding potential. (B2) Quantification of sEPSC frequency and amplitude in WT and Tg2576 GCs. Tg2576 GCs had a significantly greater sEPSC frequency and a reduction in amplitude compared to WT GCs. (C1) A histogram shows the frequency distribution of sEPSCs amplitudes. (C2) The cumulative distribution is shown. The distributions of Tg2576 GCs were significantly different from WT GCs.
Figure 3.
Figure 3.. sIPSCs are decreased in GCs from Tg2576 mice relative to WT mice.
(A) The timeline of the electrophysiological recordings for the determination of the sIPSCs from GCs. (B1) Representative traces show typical sIPSCs obtained in (a) WT and (b) Tg2576 mice at 0 mV holding potential. (B2) Quantification of sIPSC frequency and amplitude in WT and Tg2576 GCs. Tg2576 GCs had a significantly reduced sIPSC frequency, but not in amplitude compared to WT GCs. (C1) A histogram shows the frequency distribution of sIPSC amplitudes. (C2) The cumulative distributions for WT and Tg2576 GCs were significantly different.
Figure 4.
Figure 4.. Differences in intrinsic properties of WT and Tg2576 mice.
(A) The timeline of the electrophysiological recordings for the determination of ntrinsic properties from GCs. (B) Membrane potential responses of representative (1) WT and (2) Tg2576 GCs to consecutive negative current steps from −5 pA to −15 pA using a 5 pA increment. (C) (1) Resting membrane potential (RMP, in mV) and (2) tau (msec) values show that Tg2576 GCs had significantly more hyperpolarized RMPs and shorter tau than WT GCs. (D1) I-V curves and linear regressions used to calculate (input resistance (Rin). I-V curves were based on responses to positive and negative current pulses (−30 to 30 pA) in WT and Tg2576 GCs. The inset shows a representative response to a −5 pA current step from RMP, from which slope was calculated to provide a second estimation of Rin.
Figure 5.
Figure 5.. Differences in the properties of APs in WT and Tg2576 mice.
(A) Representative traces from (1) WT and (2) Tg2576 GCs of responses to increasingly larger current steps (+5 pA increment) from RMP until an AP was generated. The AP is shown at higher gain in the inset above the traces. The phase plots corresponding to the traces are shown at the top. (B) The mean (1) time to peak and (2) half width are shown for an AP at threshold. The APs from Tg2576 GCs had a significantly longer time to peak and half-width compared to WT GCs.
Figure 6.
Figure 6.. Spike frequency adaptation is reduced in GCs from Tg2576 mice compared to WT.
(A) Representative traces of 4 AP trains induced by positive current steps to GCs from (a) WT and (b) Tg2576 mice. The first (1) and the third (3) AP pairs are labeled by the bars below them. (B1) Spike frequency adaptation was quantified in WT and Tg2576 mice by measuring the ISI for each AP pair and plotting them sequentially. The first ISI was significantly longer ISI in Tg2576 mice. (B2) Comparisons of the first and third AP pairs showed that the first ISI was significantly shorter in WT mice, indicating adaptation occurred, but not in Tg2576 mice, suggesting Tg2576 mice have weak adaptation. (C) Representative traces of 7 AP trains induced by positive current steps to GCs from (a) WT and (b) Tg2576 mice. The first (1) and 5th (5) AP pairs are labeled by the bars below the traces. (D1) Spike frequency adaptation was quantified in WT and Tg2576 mice by measuring the ISI for each AP pair and plotting them sequentially. The first ISI was significantly longer in Tg2576 mice. The sequence of ISIs were also significantly different, with Tg2576 mice exhibiting longer ISIs. (D2) Comparisons of the first and fifth AP pairs showed that the first ISI was significantly shorter in WT mice, indicating adaptation occurred, but not Tg2576 mice, suggesting Tg2576 mice have weak adaptation.
Figure 7.
Figure 7.. Atropine produces a small increase in sEPSP frequency in WT GCs but not in Tg2576 GCs.
(A) The timeline of the electrophysiological recordings for the evaluation of the effects of atropine on sEPSPs. Atropine (10 μM) was added to the ACSF for the time period indicated by the box. (B) Representative traces for sEPSPs for WT GCs obtained in baseline conditions (left) and in presence of atropine (right). (B1) Quantification of the (a) frequency and (b) amplitude of sEPSPs for WT GCs are presented. The only effects of atropine that were significant was that atropine increased the mean sEPSP frequency. The magnitude of this effect was small. (B2) Histograms showing the (a) frequency distribution of sEPSPs amplitudes for WT GCs. Insets (b) show that there were no significant effects of atropine on cumulative distributions. (C) Representative traces for sEPSPs for Tg2576 GCs obtained in baseline conditions (left) and in presence of atropine (right). (C1) Quantification of the (a) frequency and (b) amplitude of sEPSPs for Tg2576 GCs are presented. There was no effect in Tg2576 mice. (C2) Histograms showing the (a) frequency distribution of sEPSPs amplitudes for Tg2576 GCs. Insets (b) show that there were no significant effects of atropine on cumulative distributions.
Figure 8.
Figure 8.. Atropine did not affect sEPSCs in GCs of WT and Tg2576 mice.
(A) The timeline of the electrophysiological recordings to determine effects of atropine on sEPSCs of WT and Tg2576 GCs. (B) Representative traces for sEPSCs for WT GCs obtained in baseline conditions (left) and in presence of atropine (right). (B1) Quantification of the (a) frequency and (b) amplitude of sEPSCs for WT GCs showed no significant effects of atropine. (B2) Histograms showing the (a) frequency distribution of sEPSCs amplitudes for WT GCs. Insets (b) show that there were no significant effects of atropine on cumulative distributions. (C) Representative traces for sEPSCs for Tg2576 GCs obtained in baseline conditions (left) and in presence of atropine (right). (C1) Quantification of the (a) frequency and (b) amplitude of sEPSCs for Tg2576 GCs showed no significant effects of atropine. (C2) Histograms showing the (a) frequency distribution of sEPSCs amplitudes for Tg2576 GCs. Insets (b) show that there were no significant effects of atropine on cumulative distributions.
Figure 9.
Figure 9.. Atropine reduces sIPSC frequency and amplitude in both WT and Tg2576 mice.
(A) The timeline of electrophysiological recordings used to determine effects of atropine on sIPSCs of GCs from WT and Tg2576 mice. (B) Representative traces of sIPSCs for WT GCs obtained in baseline conditions (left) and in presence of atropine (right). (B1) Quantification of the (a) frequency and (b) amplitude of sIPSCs for WT GCs show that atropine reduced frequency and amplitude in WT mice. (B2) Histograms showing the (a) frequency distribution of sIPSPs amplitudes for WT GCs. Insets (b) show the cumulative distributions where there is a significant effect of atropine in WT mice. (C) Representative traces of sIPSCs for Tg2576 GCs obtained in baseline conditions (left) and in presence of atropine (right). (C1) Quantification of the (a) frequency and (b) amplitude of sIPSCs for Tg2576 GCs show that atropine reduced frequency and amplitude in Tg2576 mice. (C2) Histograms showing the (a) frequency distribution of sIPSPs amplitudes for Tg2576 GCs. Insets (b) show the cumulative distributions. There was not a significant effect of atropine in Tg2576 mice.
Figure 10.
Figure 10.. A novel spontaneous inward current (nsC) that is greater in Tg2576 GCs than WT GCs and the effects of atropine.
(A) Representative traces show spontaneous inward currents (pointed with arrows) obtained in WT (left) and Tg2576 mice (right) in baseline conditions and in the presence of atropine (10 μM). Holding potential was 0 mV. The small squares mark examples of the spontaneous inward currents, which we refer to as nsCs. The examples of nsCs are expanded on the right. (B1) Mean frequency (a) and amplitude (b) of nsCs are shown for WT mice during the baseline and after atropine was added. Atropine significantly increased the frequency and amplitude of nsCs. (B2) WT nsC frequency distributions (a) and cumulative distributions (b) are shown. Atropine did not cause significant changes to the cumulative distributions relative to baseline conditions. (C1) Mean frequency (a) and amplitude (b) of nsCs are shown for Tg2576 mice. Atropine significantly increased the frequency of nsCs but not the amplitude. (C2) Tg2576 nsC frequency distributions (a) and cumulative distributions (b) are shown. Atropine did not cause significant changes to the cumulative distributions, like WT mice. (D1) Comparisons of WT and Tg2576 GCs for nsC frequency (a) and amplitude (b) during baseline conditions. Tg2576 GCs had significantly more frequent and larger nsCs than WT mice. (D2) NsC frequency distributions (a) and cumulative distributions (b) for WT and Tg2576 GCs during baseline conditions are shown. The cumulative distribution of nsCs did not show a significant difference.
Figure 11.
Figure 11.. Differences in properties of nsCs from other EPSCs in WT and Tg2576 mice.
(A1) Representative traces show spontaneous outward and inward currents (a) before and after sequential addition of (b) atropine and bicuculline, (c) APV and (d) DNQX. All concentrations were 10 μM except APV which was 50 μM. Recordings were made for 2 min at each holding potential. (A2) Representative examples of (a) nsCs at 0 mV (NMDA-EPSCs) and AMPA-EPSCs at −70 mV. (b) Mean frequencies of nsCs (NMDA-EPSCs) are shown for WT (left) and Tg2576 mice (right). (c) Mean frequency of AMPA-EPSCs at −70 mV. Note nsCs (NMDA-EPSCs) were dramatically reduced by APV and AMPA-EPSCs by DNQX. (B) Mean value for the (1) rise and (2) decay times of nsCs at 0 mV (NMDA-EPSCs) and AMPA-EPSCs at −70 mV for Tg2576 and WT mice. The kinetics of NMDA-EPSCs were significantly slower than AMPA-EPSCs.
Figure 12.
Figure 12.. Increased E:I ratio and total charge transfer in Tg2576 compared to WT mice.
(A) Changes in the ratio of EPSCs (NMDA- and AMPA-EPSCs) to IPSCs based on (1) mean frequency or (2) amplitude showed an increased ratio in Tg2576 mice relative to WT mice. (B) Changes in the charge transfer of (1) excitatory currents (NMDA- and AMPA-EPSCs) and (2) inhibitory currents (IPSCs). Tg2576 GCs showed increased charge transfer for EPSCs but not IPSCs.

Similar articles

Cited by

References

    1. Acsady L, et al., 1998. GABAergic cells are the major postsynaptic targets of mossy fibers in the rat hippocampus. J Neurosci. 18, 3386–403.10.1523/JNEUROSCI.18-09-03386.1998. - DOI - PMC - PubMed
    1. Aiken SP, et al., 1995. Reduction of spike frequency adaptation and blockade of M-current in rat CA1 pyramidal neurones by linopirdine (DuP 996), a neurotransmitter release enhancer. Br J Pharmacol. 115, 1163–8.10.1111/j.1476-5381.1995.tb15019.x. - DOI - PMC - PubMed
    1. Alzheimer A, et al., 1995. An english translation of Alzheimer’s 1907 paper, “uber eine eigenartige erkankung der hirnrinde”. Clin Anat. 8, 429–31.10.1002/ca.980080612. - DOI - PubMed
    1. Amaral DG, et al., 2007. The dentate gyrus: Fundamental neuroanatomical organization (dentate gyrus for dummies). Prog Brain Res. 163, 3–22 - PMC - PubMed
    1. Apelt J, et al., 2002. Impairment of cholinergic neurotransmission in adult and aged transgenic Tg2576 mouse brain expressing the Swedish mutation of human beta-amyloid precursor protein. Brain Res. 953, 17–30.10.1016/s0006-8993(02)03262-6. - DOI - PubMed

Publication types