Review
. 2021 Apr 1:229:117726.
doi: 10.1016/j.neuroimage.2021.117726. Epub 2021 Jan 20.

The nonhuman primate neuroimaging and neuroanatomy project

Affiliations
Review

The nonhuman primate neuroimaging and neuroanatomy project

Takuya Hayashi et al. Neuroimage. .

Abstract

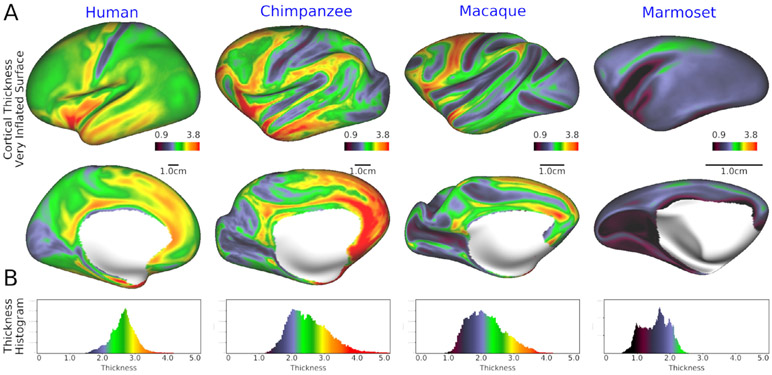
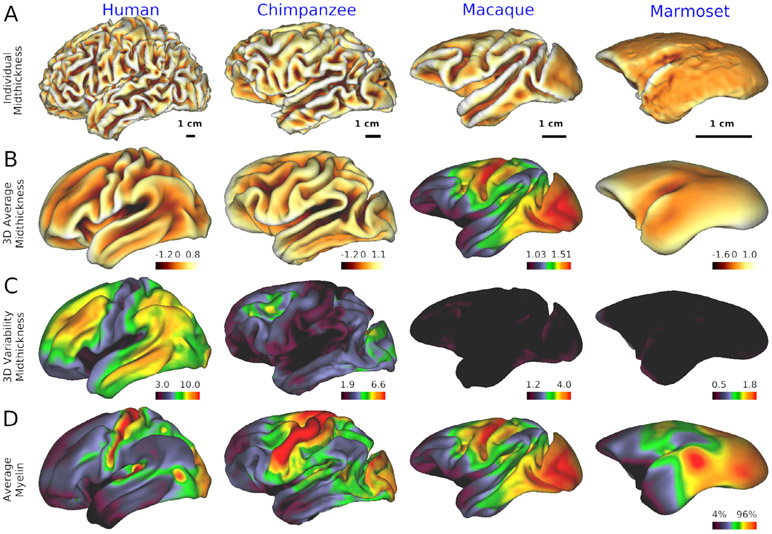
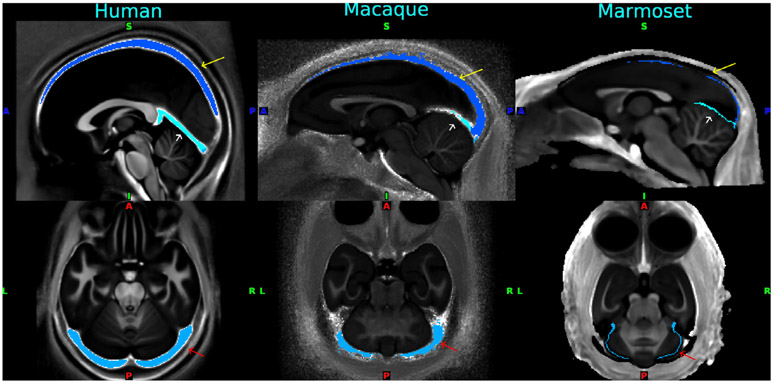
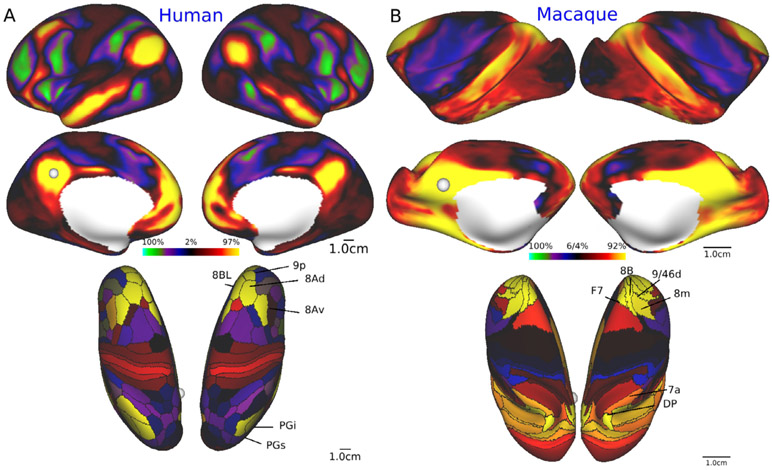
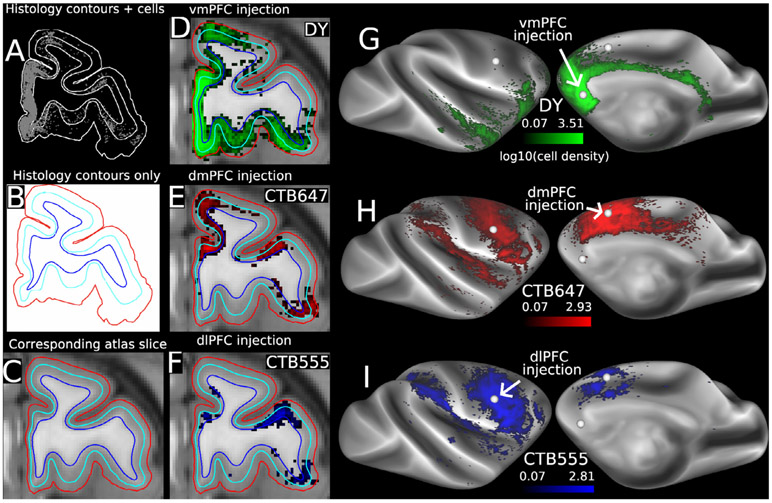
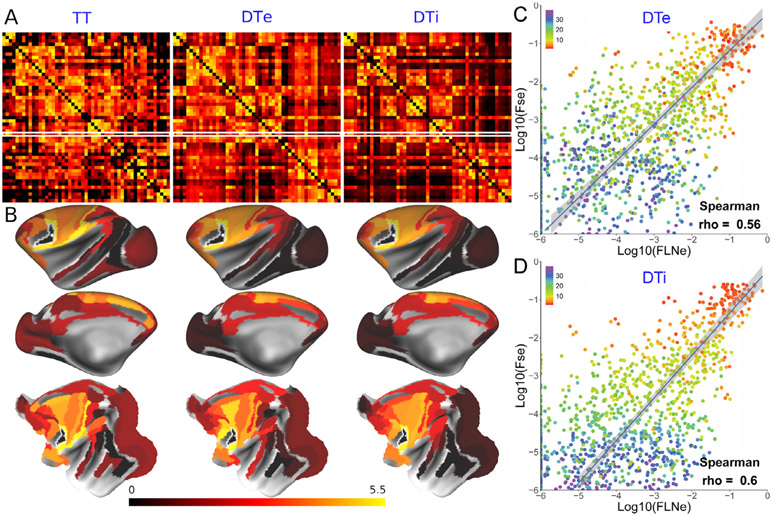
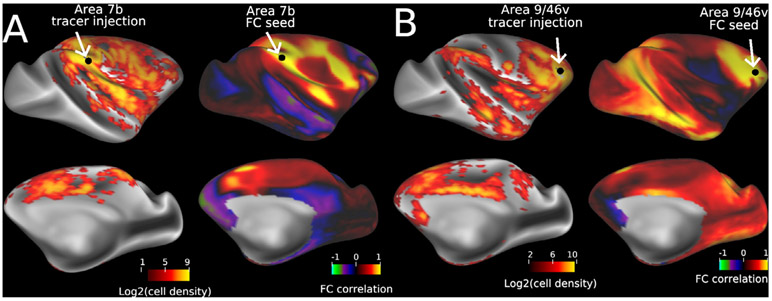
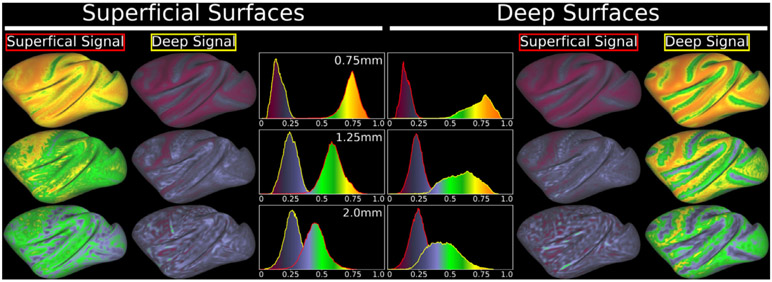
Multi-modal neuroimaging projects such as the Human Connectome Project (HCP) and UK Biobank are advancing our understanding of human brain architecture, function, connectivity, and their variability across individuals using high-quality non-invasive data from many subjects. Such efforts depend upon the accuracy of non-invasive brain imaging measures. However, 'ground truth' validation of connectivity using invasive tracers is not feasible in humans. Studies using nonhuman primates (NHPs) enable comparisons between invasive and non-invasive measures, including exploration of how "functional connectivity" from fMRI and "tractographic connectivity" from diffusion MRI compare with long-distance connections measured using tract tracing. Our NonHuman Primate Neuroimaging & Neuroanatomy Project (NHP_NNP) is an international effort (6 laboratories in 5 countries) to: (i) acquire and analyze high-quality multi-modal brain imaging data of macaque and marmoset monkeys using protocols and methods adapted from the HCP; (ii) acquire quantitative invasive tract-tracing data for cortical and subcortical projections to cortical areas; and (iii) map the distributions of different brain cell types with immunocytochemical stains to better define brain areal boundaries. We are acquiring high-resolution structural, functional, and diffusion MRI data together with behavioral measures from over 100 individual macaques and marmosets in order to generate non-invasive measures of brain architecture such as myelin and cortical thickness maps, as well as functional and diffusion tractography-based connectomes. We are using classical and next-generation anatomical tracers to generate quantitative connectivity maps based on brain-wide counting of labeled cortical and subcortical neurons, providing ground truth measures of connectivity. Advanced statistical modeling techniques address the consistency of both kinds of data across individuals, allowing comparison of tracer-based and non-invasive MRI-based connectivity measures. We aim to develop improved cortical and subcortical areal atlases by combining histological and imaging methods. Finally, we are collecting genetic and sociality-associated behavioral data in all animals in an effort to understand how genetic variation shapes the connectome and behavior.

Keywords: Connectivity; Connectome; Diffusion MRI; Functional MRI; Hierarchy; Human; Macaque; Marmoset; Retrograde tracer.


Conflict of interest statement

Declaration of Competing Interest All the authors have no conflicts of interest to declare.

Figures

Fig. 1.
Fig. 1.. Cortical thickness in human, chimpanzee, macaque and marmoset.
(A) Cortical thickness overlaid on a very-inflated left cortical surface (upper, lateral view; lower, medial view) in human, chimpanzee, macaque, and marmoset. (B) histograms of cortical thickness. The cortical thickness maps were created by averaging a population for each species (N=1092 in humans, 29 in chimp, 30 in macaque and 50 in marmoset). The median, lower 5th percentile and minimum of the averaged cortical thickness is 2.7, 2.0 and 1.5 mm in humans, 2.5, 1.7 and 1.1 mm in chimps, 2.4, 1.4 and 0.9 mm in macaque, and 1.6, 0.9 and 0.6 mm in marmoset (see Table 1). Data at https://balsa.wustl.edu/G39v3.
Fig. 2.
Fig. 2.. Cross-species comparison of individual’s cortical surface, average and variability.
A) cortical midthickness surface in 32k mesh in a single subject. At the single-subject level, cortical folding is more prominent in humans than in other species. The cortical surface is color coded by sulcal depth in the orange-yellow (see color bar and range in the right lower corner in each panel in second row) B) 3-dimensional (3D) average of midthickness surface in 32k mesh, Note that the average cortical surface does not follow the individual’s cortical folding pattern but exhibits relatively smooth cortical surface area, whereas marmoset individual and average cortical surfaces are both smooth and remarkably similar. The 3D variability in cortical midthickness, colormap adjusted by isometric scale of the brain (see Table 1), suggests that this smoothness of the average cortical surface is due to the large cross subject variation in folding patterns. Cortical surface is color coded by sulcal depth. C) Variability (3D standard deviation) of midthickness surface with a colormap range scaled across species by isometric scale of brain size (see Table 1). Note that in humans and chimps, association areas exhibit high 3D variability of midthickness surface as compared with primary sensorimotor, visual, and auditory areas. D) average myelin contrast in human (N=1092), chimpanzee (N=29), macaque (N=30) and marmoset (N=50). Average cortical myelin contrast (estimated from the T1w/T2w ratio) is high in primary sensorimotor, visual and auditory and MT areas in all species but lower in the association areas. Data at https://balsa.wustl.edu/L6xn7.
Fig. 3.
Fig. 3.. Standardized venous sinus maps for each species of human, macaque and marmoset.
Yellow arrow: superior sagittal sinus, white arrow: straight sinus, and red arrow: transverse sinuses. A standardized venous map is used for creating a subject-specific venous map, which is then used for extracting the time series as a feature when automatically denoising functional MRI data using ICA+FIX. The venous maps were overlaid on the standardized map of T1w divided by the T2w image. Data at https://balsa.wustl.edu/pkqlD.
Fig. 4.
Fig. 4.. Default mode network in human and macaque.
Seed-based functional connectivity showing a typical cortical distribution of ‘default mode network’. The seed (white circle) was placed in the left posterior cingulate/precuneus cortex (pC/PCC) of humans (HCP, N=210) and macaques (NHP_NNP Mac30BS, N=30). A) Dense functional connectivity maps (Upper row, lateral view; middle row, medial view) and the dense by parcellated functional connectivity maps (bottom, dorsal view) of the seed at pC/PCC in humans. B) Dense functional connectivity maps (upper row, lateral view; middle row, medial view) and the dense by parcellated functional connectivity maps (bottom, dorsal view) of the seed at pC/PCC in macaque. Functional connectivity is calculated with Pearson’s correlation of the seed time series signal. The parcellation of the cerebral cortex is based on Glasser et al. (2016a, 2016b) in humans and on Markov et al. (2014a) in macaques. Data at https://balsa.wustl.edu/97rzG and https://balsa.wustl.edu/kNq56.
Fig. 5.
Fig. 5.. Key steps in mapping retrograde tracer injection data from individual histological sections to the macaque Yerkes19 surface-based and MRI-based atlas.
A–C: matching histological section contours to corresponding atlas surface contours. In panels B–F, pial contour is red, layer 4 contour is cyan, and gray/white contour is blue. D–F. Volume density (log10 plot) of labeled neurons for each of 3 tracer injections. G–I. Dense surface maps of cell density (log10 plot) for each injection. Color bars apply to volume as well as surface maps. Cell densities thresholded at 0.1 in D–I to compensate for slight smoothing in preprocessing steps.
Fig. 6.
Fig. 6.. Cortico-cortical connectivity based on tract tracing and ex vivo and in vivo diffusion tractography.
A). Connectivity matrices of 51 areas revealed by tract tracing and tractography. Left: 51 ×51 matrix of bidirectional tract tracing (TT) shown retrograde neuronal tracer connectivity injected in 51 cortical areas, and analyzed over 91 cortical areas, shown as FLNe by log10 scale (Markov et al., 2014a), middle: ex vivo diffusion connectivity weights (DTe) presented as log 10 scale of FSe (N=1) (Donahue et al., 2016), right: In vivo diffusion connectivity matrix weights (DTi) shown in FSe (N=15, averaged) (Autio et al., 2020b). The FLNe and FSe of F5 seed-connectivity are highlighted by white line. B) An exemplar surface maps of tracer connectivity weights for an injection in area F5 (white dot), ex vivo diffusion tractography of F5 seed, and in vivo diffusion tractography of F5 seed. Upper: lateral surface of hemisphere, middle: medial surface of hemisphere, bottom: flatmap. C) Scatter plot of TT FLNe vs DTe FSe,and D) TT FLNe vs DTi FSe. The points are color coded by the weighted average connectivity distance estimated from diffusion tractography (N=15) (see colormap at the upper left corner of each graph). At a threshold of 10−6, the numbers of true-positive/true-negative/false-positive/false-negative were 1030/2/235/8 and 1038/1/236/0 in DTe and DTi respectively, resulting in sensitivity of 99% and 100% and specificity of 0.8% and 0.4%, respectively. The blue line (and gray bands around the line) indicates an orthogonal line regression that accounts for the variance in empirical values of both the x- and y-axis. Note that in A and B, the FLNe and FSe are shown as actual log values plus 6 for visualization purposes using Connectome Workbench (wb_view).
Fig. 7.
Fig. 7.. Comparing dense tracer connectivity with functional connectivity.
Two exemplar injection sites (A, area 7b and B, area 9/46v) and corresponding tracer connectivity and seed location from a dataset involving 31 tracer injections (left in each panel) and functional connectivity and the seed from the initial NHP_NNP fMRI dataset, Mac30BS (right in each panel). The Mac30BS dense connectivity was generated using thirty sedated macaques with 102-min fMRI BOLD scan duration each.
Fig. 8.
Fig. 8.. Results of simulation for partial volume/geometric effects in ‘layer’ fMRI analysis at various resolutions in macaque cerebral cortex.
Simulation performed estimation of ‘layer 4’ surface for each subject of macaques (N=30) from Mac30BS, created fMRI-resolution volumes of simulated superficial and deep cortical signal (above and below layer 4, respectively), and re-mapped each layer’s signal onto the subject’s surfaces with ribbon mapping (pial to layer4, and layer4 to white), and these values were then averaged across subjects. In the corresponding layer/surface, a value closer to one indicates better response to layer-specific signal, where the values for the other layer indicate ‘spill-in’ of signals to the undesired layer. The layer 4 surface is approximated by the ‘equal volume method’ (locally, the same amount of cortical volume is superficial to the new surface as is deeper than it) (Van Essen and Maunsell, 1980). The use of conventional resolution in NHP (=2.0 mm) results in significant loss or spill-out of signals in the corresponding layer, and spill-in into the other layer resulting in the overlap of histograms. NHP_NNP 3T protocol (1.25 mm) was partly overlapped in histogram, and ultra-high field MRI protocol (0.75 mm) showed distinct separation between peaks in the histograms, suggesting differentiation of signal between laminae in surface-based group analysis if one only considers geometric constraints (note that the separability of lamina also depends on the point-spread-function of BOLD fMRI or other fMRI approaches). See also Fig. S8 in (Coalson et al., 2018). Data at https://balsa.wustl.edu/0LMl2.

References

    1. Autio JA, Glasser MF, Ose T, Donahue CJ, Bastiani M, Ohno M, Kawabata Y, Urushibata Y, Murata K, Nishigori K, Yamaguchi M, Hori Y, Yoshida A, Go Y, Coalson TS, Jbabdi S, Sotiropoulos SN, Kennedy H, Smith S, Van Essen DC, Hayashi T, 2020b. Towards HCP-Style Macaque Connectomes: 24-Channel 3T Multi-Array Coil, MRI Sequences and Preprocessing. NeuroImage, 116800 doi:10.1016/j.neuroimage.2020.116800. - DOI - PMC - PubMed
    1. Andersson JLR, Skare S, Ashburner J, 2003. How to correct susceptibility distortions in spin-echo echo-planar images: application to diffusion tensor imaging. NeuroImage 20, 870–888. doi:10.1016/S1053-8119(03)00336-7 - DOI - PubMed
    1. Badre D, D’Esposito M, 2007. Functional magnetic resonance imaging evidence for a hierarchical organization of the prefrontal cortex. J. Cogn. Neurosci 19, 2082–2099. doi:10.1162/jocn.2007.19.12.2082. - DOI - PubMed
    1. Bakken TE, Miller JA, Ding S-L, Sunkin SM, Smith KA, Ng L, Szafer A, Dalley RA, Royall JJ, Lemon T, Shapouri S, Aiona K, Arnold J, Bennett JL, Bertagnolli D, Bickley K, Boe A, Brouner K, Butler S, Byrnes E, Caldejon S, Carey A, Cate S, Chapin M, Chen J, Dee N, Desta T, Dolbeare TA, Dotson N, Ebbert A, Fulfs E, Gee G, Gilbert TL, Goldy J, Gourley L, Gregor B, Gu G, Hall J, Haradon Z, Haynor DR, Hejazinia N, Hoerder-Suabedissen A, Howard R, Jochim J, Kinnunen M, Kriedberg A, Kuan CL, Lau C, Lee C-K, Lee F, Luong L, Mastan N, May R, Melchor J, Mosqueda N, Mott E, Ngo K, Nyhus J, Oldre A, Olson E, Parente J, Parker PD, Parry S, Pendergraft J, Potekhina L, Reding M, Riley ZL, Roberts T, Rogers B, Roll K, Rosen D, Sandman D, Sarreal M, Shapovalova N, Shi S, Sjoquist N, Sodt AJ, Townsend R, Velasquez L, Wagley U, Wakeman WB, White C, Bennett C, Wu J, Young R, Youngstrom BL, Wohnoutka P, Gibbs RA, Rogers J, Hohmann JG, Hawrylycz MJ, Hevner RF, Molnár Z, Phillips JW, Dang C, Jones AR, Amaral DG, Bernard A, Lein ES, 2016. A comprehensive transcriptional map of primate brain development. Nature 535, 367–375. doi:10.1038/nature18637. - DOI - PMC - PubMed
    1. Bakker R, Wachtler T, Diesmann M, 2012. CoCoMac 2.0 and the future of tract-tracing databases. Front. Neuroinform 6. doi:10.3389/fninf.2012.00030. - DOI - PMC - PubMed

References under revision of this special issue of NeuroImage

    1. Autio JA, Zhu Q, Li X, Glasser MF, Schwiedrzik CM, Fair DA, Zimmermann J, Yacoub E, Menon RS, Van Essen DC, Hayashi T, Russ B, Vanduffel W, 2020a. Minimal Specifications for Non-Human Primate MRI: Challenges in Standardizing and Harmonizing Data Collection. arXiv:2010.04325 [q-bio]. - PMC - PubMed

Publication types