. 2021 Jan-Jun:296:100094.
doi: 10.1074/jbc.RA120.015177. Epub 2020 Nov 24.

Small-molecule control of neurotransmitter sulfonation

Affiliations

Small-molecule control of neurotransmitter sulfonation

Ian Cook et al. J Biol Chem. 2021 Jan-Jun.

Abstract

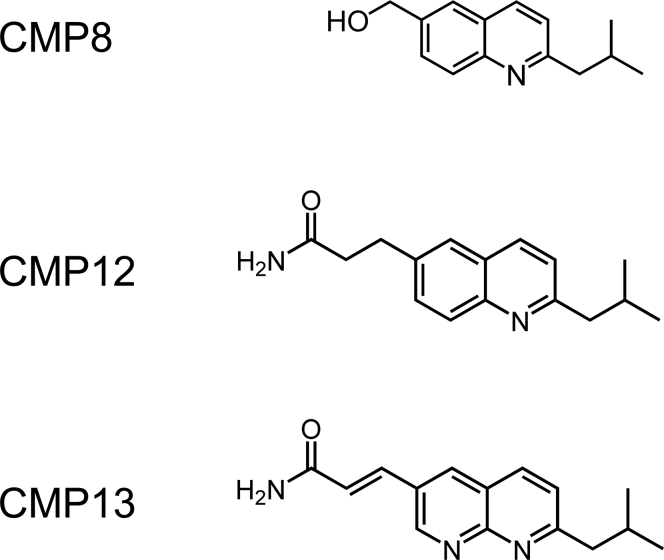
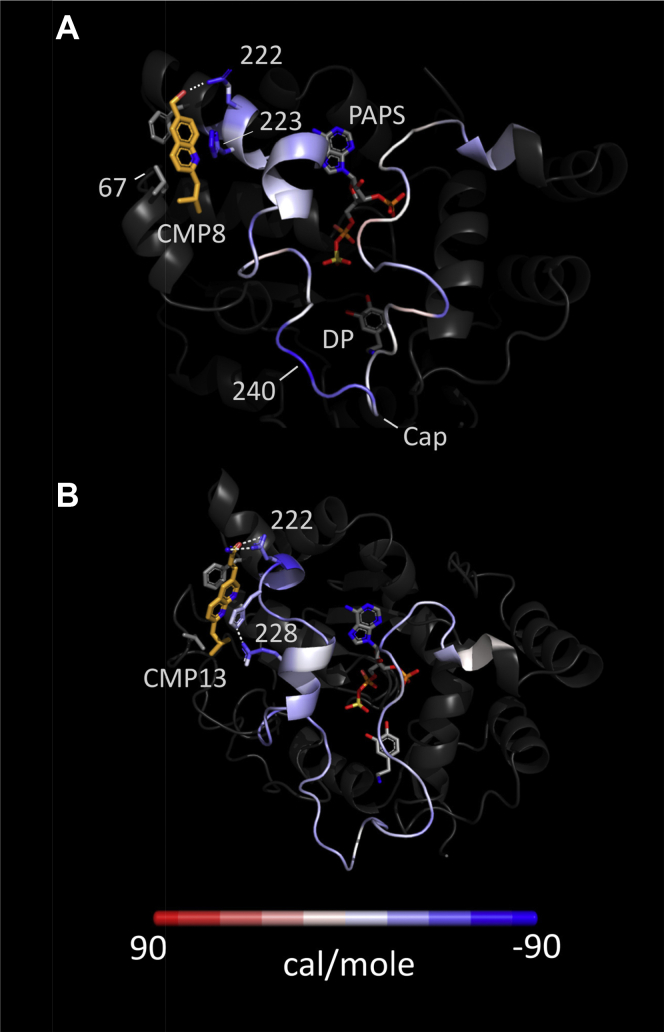
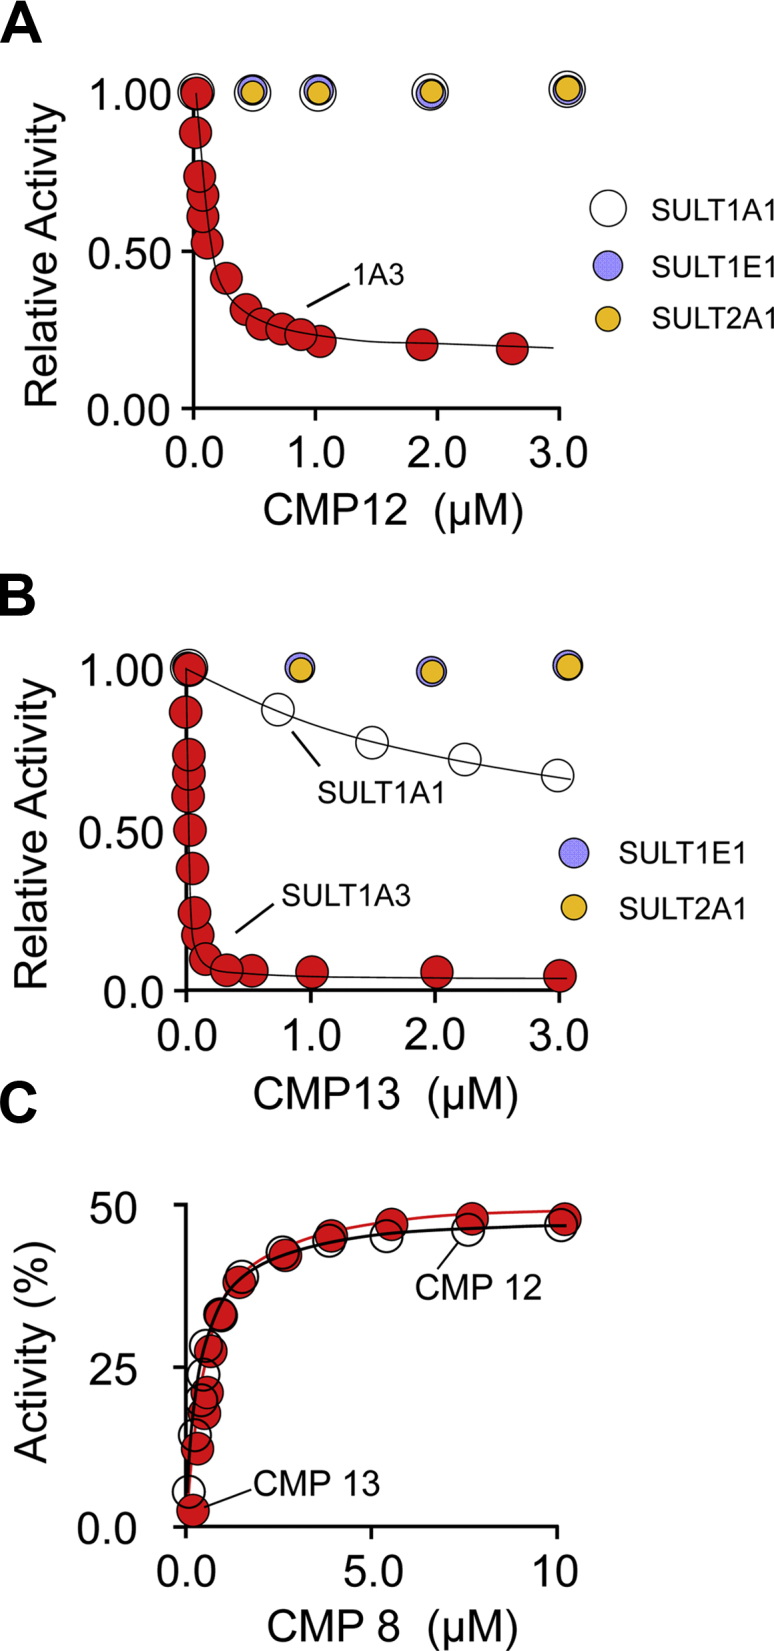
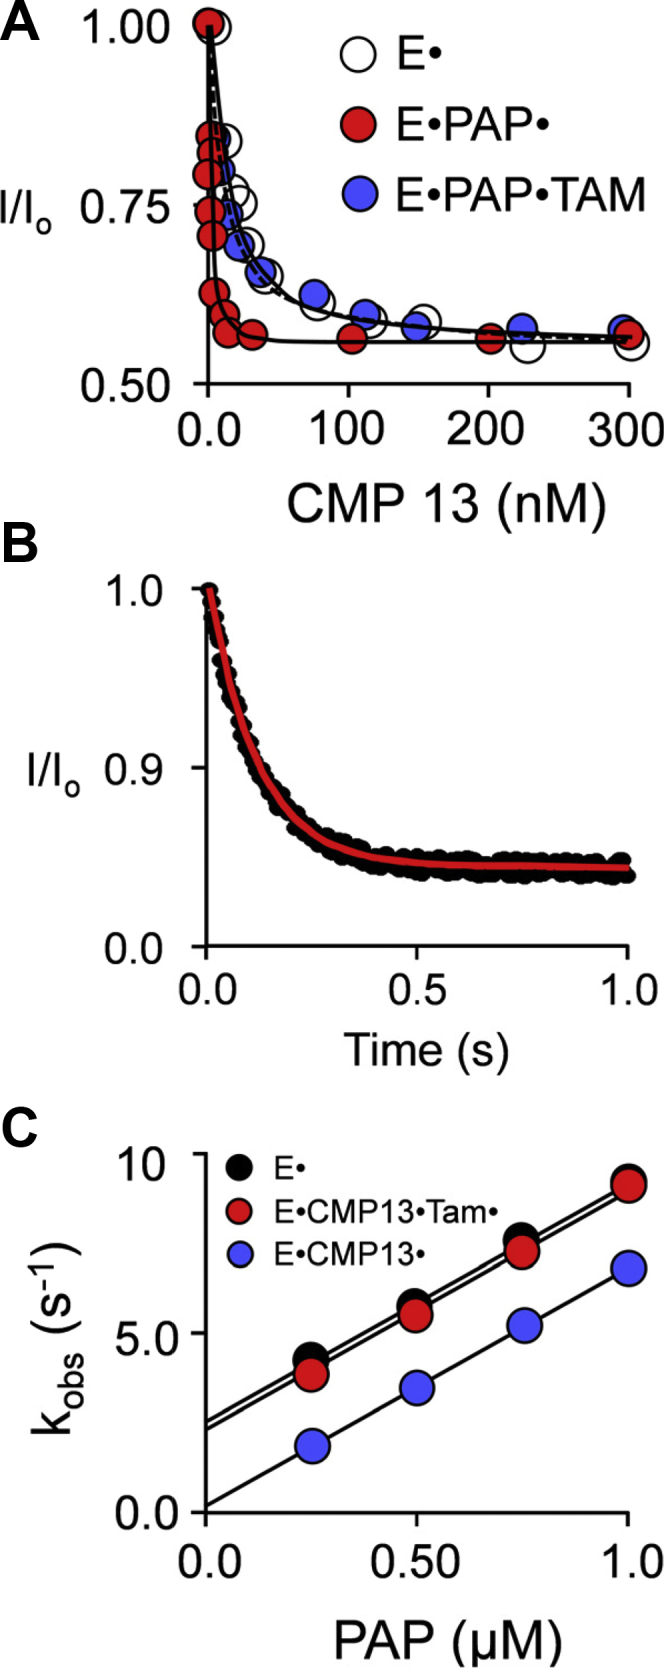
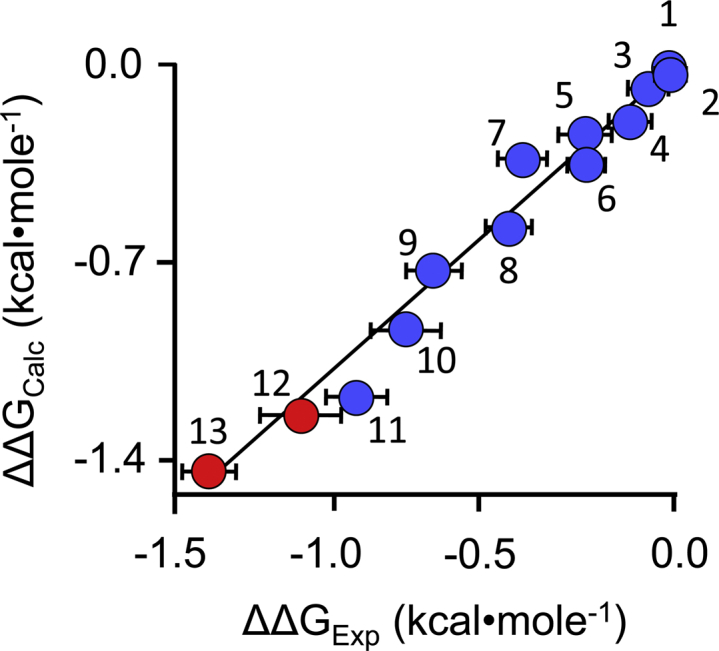
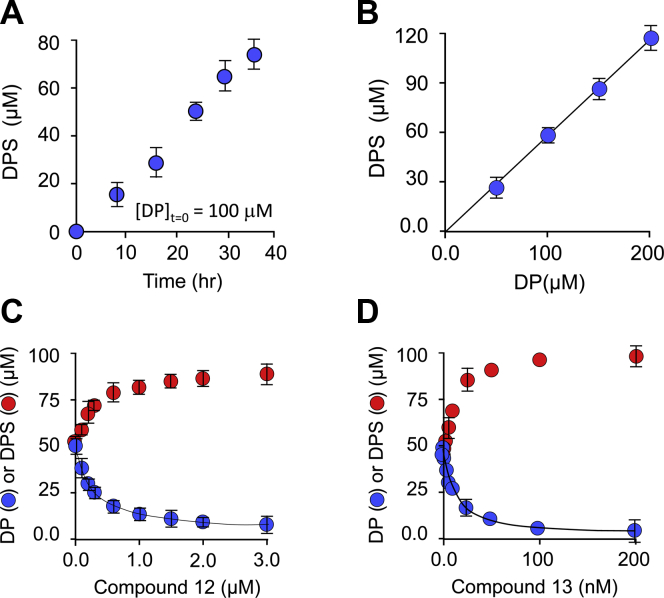
Controlling unmodified serotonin levels in brain synapses is a primary objective when treating major depressive disorder-a disease that afflicts ∼20% of the world's population. Roughly 60% of patients respond poorly to first-line treatments and thus new therapeutic strategies are sought. To this end, we have constructed isoform-specific inhibitors of the human cytosolic sulfotransferase 1A3 (SULT1A3)-the isoform responsible for sulfonating ∼80% of the serotonin in the extracellular brain fluid. The inhibitor design includes a core ring structure, which anchors the inhibitor into a SULT1A3-specific binding pocket located outside the active site, and a side chain crafted to act as a latch to inhibit turnover by fastening down the SULT1A3 active-site cap. The inhibitors are allosteric, they bind with nanomolar affinity and are highly specific for the 1A3 isoform. The cap-stabilizing effects of the latch can be accurately calculated and are predicted to extend throughout the cap and into the surrounding protein. A free-energy correlation demonstrates that the percent inhibition at saturating inhibitor varies linearly with cap stabilization - the correlation is linear because the rate-limiting step of the catalytic cycle, nucleotide release, scales linearly with the fraction of enzyme in the cap-open form. Inhibitor efficacy in cultured cells was studied using a human mammary epithelial cell line that expresses SULT1A3 at levels comparable with those found in neurons. The inhibitors perform similarly in ex vivo and in vitro studies; consequently, SULT1A3 turnover can now be potently suppressed in an isoform-specific manner in human cells.

Keywords: SULT1A3; allosteric; catecholamine; human mammary epithelial cells; inhibitor; molecular dynamics; neurotransmitter; structure activity relationship; sulfotransferase.


Conflict of interest statement

Conflict of interest A provisional patent covering the compounds described in this manuscript has been submitted (US patent application number PCT/US2019/065442). All authors listed on the masthead are co-inventors on the patent.

Figures

Figure 1
Figure 1
The allosteric inhibitors. CMP8, a reference compound in this study, has been described previously (15). The synthesis and characterization of CMP12 and CMP13 are described in Supporting Information.
Figure 2
Figure 2
Energy difference maps. A, the CMP8 map. The stabilizing effects of CMP8 are shown color-coded on the closed active-site cap of SULT1A3. Colors represent the changes in Gibbs potential that occur when CMP8 adds to the enzyme and correspond to the scale shown at the bottom of the figure. Numbers associated with the protein correspond to residue numbers. B, the CMP13 map. The Gibbs potential changes associated with replacing CMP8 with CMP13. SULT1A3, sulfotransferase 1A3.
Figure 3
Figure 3
Affinity, specificity, and binding sites of CMP12 and CMP13. A and B, inhibition studies. Initial rates of SULT-catalyzed 1-HP sulfonation are plotted as a function of inhibitor concentration. Rates are normalized to the rate observed in the absence of the inhibitor. Inhibition of the major SULT isoforms found in the brain and liver were tested. SULT activity was monitored via the sulfonation-dependent change in 1-HP fluorescence (λex = 325 nm, λem = 375 nm (15, 28)). Reaction conditions were as follows: SULT (20 nM, active sites), PAPS (0.50 mM, 17 × Km), 1-HP (5.0 μM, 61 × Km), KPO4 (50 mM), pH 7.5, 25(±2) °C. Less than 5% of the concentration-limiting substrate was converted to the product at reaction endpoints. Each data point is the average of three independent determinations. The lines passing through the data are least-squares fits to a noncompetitive partial-inhibition model (see Experiment and Initial rate). C, CMP8 competes with CMP12 and CMP13. Initial rates at saturating CMP12 or CMP13 are plotted as a function of CMP8 concentration. Rates are normalized to the rate observed in the absence of the inhibitor. Rate measurements were performed as described for panels A and B. Reaction conditions were as follows: SULT1A3 (20 nM, active sites), CMP12 (1.4 μM, 20 × Ki) or CMP13 (0.18 μM, 20 × Ki), CMP8 (0–10 μM, 0–300 × Ki), PAPS (0.50 mM, 17 × Km), 1-HP (5.0 μM, 61 × Km), KPO4 (50 mM), pH 7.5, 25(±2) °C. Lines passing through the data are the predictions of a noncompetitive partial-inhibition model in which inhibitors compete for the same site (see Experiment and Binding competition). SULT, sulfotransferase; PAP, 3′-phosphoadenosine-5′-phosphate; SULT1A3, sulfotransferase 1A3; PAPS, 3’-phosphoadenosine 5’-phosphosulfate; 1-HP, 1-hydroxypyrene.
Figure 4
Figure 4
The inhibition mechanism. A, equilibrium binding. Binding was monitored via ligand-induced changes in SULT1A3 intrinsic fluorescence (λex = 290 nm, λem = 335 nm). CMP13 was titrated into a solution containing SULT1A3 (15 nM, dimer), PAP [0 μM (white dots) or 350 μM, 100 × Kd (red and blue dots)], Tam [0 μM (black and red dots) or 160 μM, 200 × Kd (blue dots)], KPO4 (50 mM), pH 7.5, 25(±2) °C. Each dot represents the average of three independent titrations. Lines passing through the data represent the outcomes predicted by least-squares fitting of the averaged data to a single-binding-site model. B, representative PAP-binding reaction. PAP binding was monitored using a stopped-flow fluorimeter (λex = 290 nm, λem ≥ 330 nm (cutoff filter)). Reactions were initiated by rapidly mixing (1:1 v/v) a solution containing SULT1A3 (30 nM, dimer), CMP13 (1.0 μM, 100 × Kd), Tam (160 μM, 200 × Kd), KPO4 (50 mM), pH 7.5, 25(±2) °C, with a solution that was identical except that it lacked SULT1A3 and contained PAP (2.0 μM). The average of five independent progress curves shown and the kobs was obtained by fitting the data to a single exponential. C, pre–steady-state binding. PAP binding was monitored as described for panel B. Reactions were initiated by mixing (1:1 v/v) a solution containing SULT1A3 (30 nM, dimer), CMP13 [0 μM (black dots) or 1.0 μM, 100 × Kd (red and blue dots)], Tam [0 μM (black and blue dots) or 160 μM, 200 × Kd (red dots)], KPO4 (50 mM), pH 7.5, 25(±2) °C, with a solution that was identical except that it lacked SULT1A3 and contained PAP at twice the indicated concentrations. Each kobs value was determined in triplicate, and the averaged values are shown. kon and koff are given, respectively, by the slopes and intercepts obtained from linear least-squares fitting of the kobs vs [PAP] plot. PAP, 3′-phosphoadenosine-5′-phosphate; SULT1A3, sulfotransferase 1A3; Tam, 4-hydroxy-tamoxifen.
Figure 5
Figure 5
Free-energy correlation. Calculated and experimentally determined ΔΔG values for inhibitor-induced stabilization of the SULT1A3 cap are plotted vs one another. The closed-cap form of the SULT1A3·DP·PAPS complex, which lacks an inhibitor, was used as the reference structure in the MD calculations. The datasets correlate linearly with slope = 1.1 (R = 0.99). Red dots indicate the new compounds described herein; blue dots identify compounds described in a previous study (15). The numbering corresponds to the structures seen in Table 1 and the previous study. Errors in the calculated (Y-axis) dimension are minute. SULT1A3, sulfotransferase 1A3; PAPS, 3’-phosphoadenosine 5’-phosphosulfate; DP, dopamine; MD, molecular dynamics.
Figure 6
Figure 6
HME(+)-cell DPS synthesis and inhibition. A, Time dependence of DPS formation. DP was added at 100 μM to the growth medium of 60 to 70% confluent HME(+)-cells, and the DPS concentration in the medium was determined at the indicated time intervals. B, DP-concentration dependence of DPS synthesis. The Y-axis indicates the concentration of DPS in the growth media 24 h after DP addition. The X-axis indicates the DP concentration added at t = 0 to the growth medium of 60 to 70% confluent HME(+)-cells. C and D, Inhibition of DPS synthesis. DP was added at 100 μM to the HME(+)-cell growth media containing the inhibitor at the indicated concentrations. The levels of DP (red dots) and DPS (blue dots) were determined 24 h after DP addition. The solid line through the DP data is the outcome predicted by least-squares fitting using the following inhibition model: [DPS] = [DPS]-inh – [[DPS]sat’d inh × [I]/(IC50 + [I])]. A–D, dopamine metabolites were separated and quantitated using HPLC (see Experiment); each data point represents the average of three independent determinations, and the sum of DP and DPS concentrations was ≥95% of the total added DP. DP, dopamine; DPS, dopamine sulfate; HME, human mammary epithelial.

References

    1. Merikangas K.R., He J.P., Burstein M., Swanson S.A., Avenevoli S., Cui L., Benjet C., Georgiades K., Swendsen J. Lifetime prevalence of mental disorders in U.S. adolescents: results from the National Comorbidity Survey Replication--Adolescent Supplement (NCS-A) J. Am. Acad. Child. Adolesc. Psychiatry. 2010;49:980–989. - PMC - PubMed
    1. Chesney E., Goodwin G.M., Fazel S. Risks of all-cause and suicide mortality in mental disorders: a meta-review. World Psychiatry. 2014;13:153–160. - PMC - PubMed
    1. Mathers C.D., Loncar D. Projections of global mortality and burden of disease from 2002 to 2030. PLoS Med. 2006;3:e442. - PMC - PubMed
    1. Souery D., Amsterdam J., de Montigny C., Lecrubier Y., Montgomery S., Lipp O., Racagni G., Zohar J., Mendlewicz J. Treatment resistant depression: methodological overview and operational criteria. Eur. Neuropsychopharmacol. 1999;9:83–91. - PubMed
    1. Thomas S.J., Shin M., McInnis M.G., Bostwick J.R. Combination therapy with monoamine oxidase inhibitors and other antidepressants or stimulants: strategies for the management of treatment-resistant depression. Pharmacotherapy. 2015;35:433–449. - PubMed

Publication types

LinkOut - more resources