Meta-Analysis
. 2021 Jan 23;26(1):13.
doi: 10.1186/s12199-020-00931-z.

Anemia as a risk factor for tuberculosis: a systematic review and meta-analysis

Affiliations
Meta-Analysis

Anemia as a risk factor for tuberculosis: a systematic review and meta-analysis

Yemataw Gelaw et al. Environ Health Prev Med. .

Abstract

Background: Tuberculosis is a major public health problem caused by Mycobacterium tuberculosis, occurring predominantly in population with low socioeconomic status. It is the second most common cause of death from infectious diseases. Tuberculosis becomes a double burden among anemic patients. Anemia increases an individual's susceptibility to infectious diseases including tuberculosis by reducing the immunity level. Therefore, the purpose of this study was to determine whether anemia is a risk factor for tuberculosis.

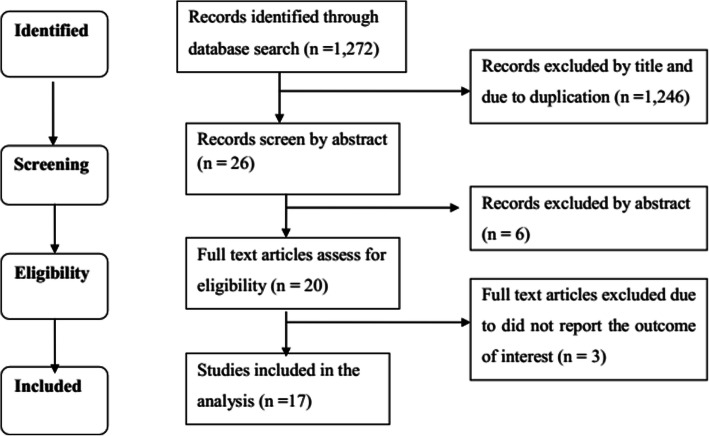
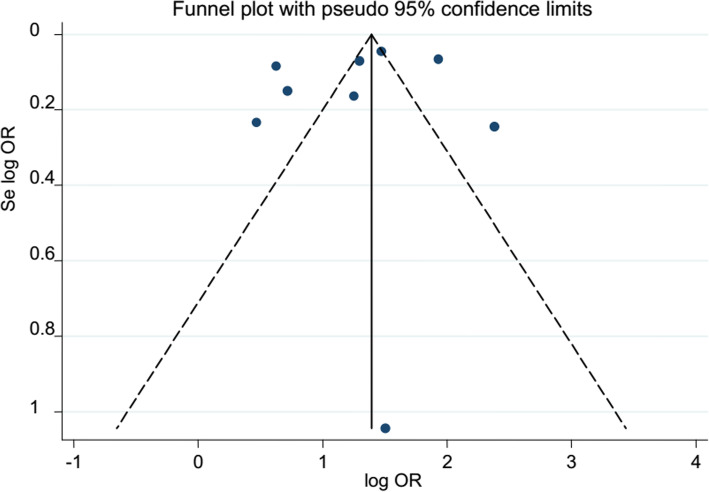
Method: Relevant published articles were searched in electronic databases like PubMed, Google Scholar, EMBASE, and Cochrane Library using the following MeSH terms: risk factor, predictors, tuberculosis, TB, Anaemia, Anemia, hemoglobin, Hgb, and Hb. Articles written in the English, observational studies conducted on the incidence/prevalence of tuberculosis among anemic patients, or papers examined anemia as risk factors for tuberculosis were included. From those studies meeting eligibility criteria, the first author's name, publication year, study area, sample size and age of participants, study design, and effect measure of anemia for tuberculosis were extracted. The data were entered using Microsoft Excel and exported to Stata version 11 for analysis. The random-effects model was applied to estimate the pooled OR and HR, and 95% CI. The sources of heterogeneity were tested by Cochrane I-squared statistics. The publication bias was assessed using Egger's test statistics.

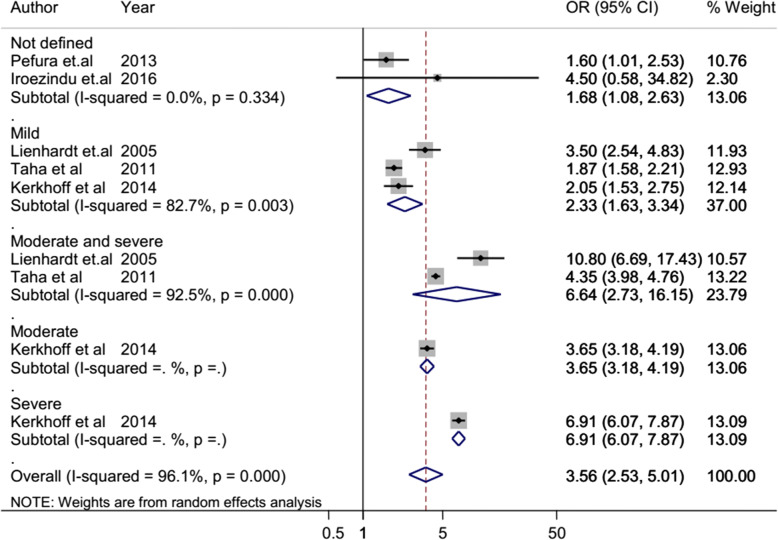
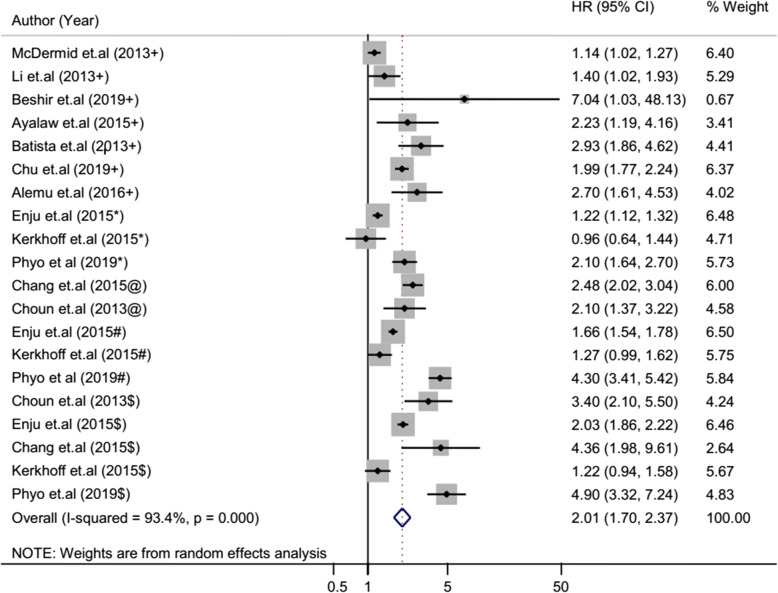
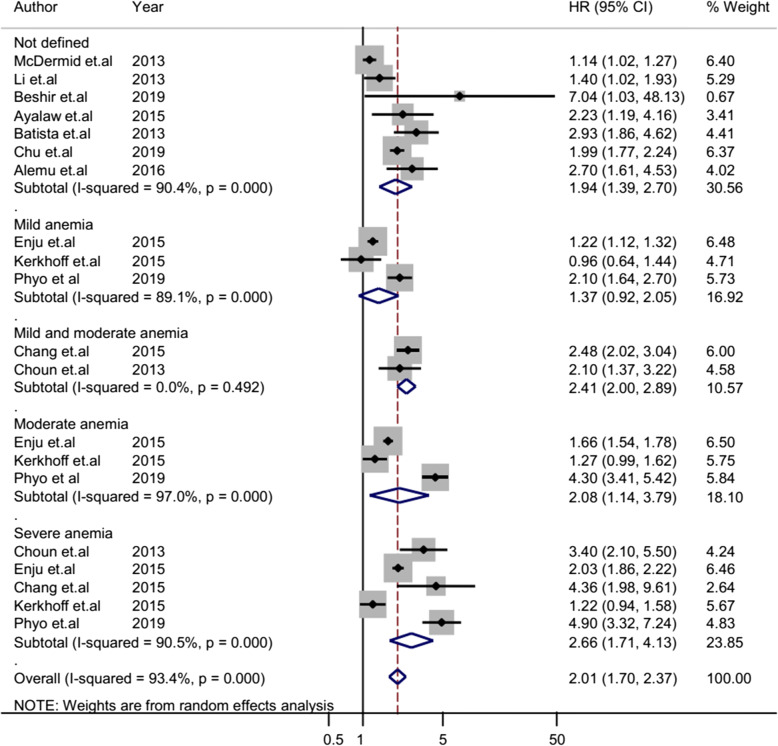
Results: A total of 17 articles with a 215,294 study participants were included in the analysis. The odd of tuberculosis among anemic patients was 3.56 (95% CI 2.53-5.01) times higher than non-anemic patients. The cohort studies showed that the HR of tuberculosis was 2.01 (95% CI 1.70-2.37) times higher among anemic patients than non-anemic patients. The hazard of tuberculosis also increased with anemia severity (HR 1.37 (95% CI 0.92-2.05), 2.08 (95% CI 1.14-3.79), and 2.66 (95% CI 1.71-4.13) for mild, moderate, and severe anemia, respectively).

Conclusion: According to the current systematic review and meta-analysis, we can conclude that anemia was a risk factor for tuberculosis. Therefore, anemia screening, early diagnose, and treatment should be provoked in the community to reduce the burden of tuberculosis.

Keywords: Anemia; Hazard ratio; Systematic review; Tuberculosis; and Meta-analysis.


Conflict of interest statement

The authors declare that they have competing interests.

Figures

Fig. 1
Fig. 1
PRISMA flow chart of study selection. PRISMA: Preferred Reporting Items for Systematic Reviews and Meta-Analysis
Fig. 2
Fig. 2
Funnel plot of case-control and cross-sectional studies; each dot represents individual studies. The y-axis represents standard error of estimate. The x-axis represents logit transformed estimates. log OR logarithm of odds ratio, Se log OR standard error of logarithm of odds ratio
Fig. 3
Fig. 3
Funnel plot of cohort studies; each dot represents individual studies. The y-axis represents standard error of estimate. The x-axis represents logit transformed estimates. log HR logarithm of hazard ratio, Se log HR standard error of logarithm of hazard ratio
Fig. 4
Fig. 4
Forest plot of case-control and cross-sectional studies; pooled effect size (OR) estimates of anemia for the development of TB. The scale in the x-axis represents OR risk estimate of the studies. The hard line represents the OR value showing no association (OR of 1). The dashed line represents the pooled point estimate of OR of anemia for the TB infection. The black dot at the center of the gray box represents the point OR estimate of each study and the line indicates the 95% confidence interval of the estimates. The gray boxes represent the weight of each study contributing to the pooled OR estimate. The blue diamond represents the 95% confidence interval of the pooled OR estimates. OR odds ratio, CI confidence interval, I-squared shows the heterogeneity of the included studies, p indicates the statistical significance of the heterogeneity, + anemia severity not defined, * mild anemia, & moderate and severe anemia, # moderate anemia, $ severe anemia
Fig. 5
Fig. 5
Forest plot of sub-group analysis pooled effect size (OR) estimates of anemia for tuberculosis infection by study design. The scale in the x-axis represents OR risk estimate of the studies. The hard line represents the odd ratio value showing no association (odds ratio of 1). The dashed line represents the pooled point estimate of OR of anemia for the tuberculosis infection. The black dot at the center of the gray box represents the point OR estimate of each study, and the line indicates the 95% confidence interval of the estimates. The gray boxes represent the weight of each study contributing to the pooled OR estimate. The first two blue diamonds represent the 95% confidence interval for sub group analysis pooled OR estimate and the last blue diamond represents the 95% confidence interval for overall pooled OR estimate. OR odds ratio, CI confidence interval, I2 shows the heterogeneity of the included studies, p indicates the statistical significance of the heterogeneity, + anemia severity not defined, * mild anemia, & moderate and severe anemia, # moderate anemia, $ severe anemia
Fig. 6
Fig. 6
Forest plot of case-control and cross-sectional studies; sub-group analysis pooled effect size (OR) estimates of anemia for TB by anemia severity. The scale in the x-axis represents OR risk estimate of the studies. The hard line represents the OR value showing no association (OR of 1). The dashed line represents the pooled point estimate of OR of anemia for the TB. The black dot at the center of the gray box represents the point OR estimate of each study, and the line indicates the 95% confidence interval of the estimates. The gray boxes represent the weight of each study contributing to the pooled OR estimate. The first five blue diamonds represent the 95% confidence interval for subgroup analysis pooled OR estimate, and the last blue diamond represents the 95% confidence interval for overall pooled OR estimate. OR odds ratio, CI confidence interval, I2 shows the heterogeneity of the included studies, p indicates the statistical significance of the heterogeneity
Fig. 7
Fig. 7
Forest plot of cohort studies; pooled effect size (HR) estimates of anemia for the development of TB. The scale in the x-axis represents HR risk estimate of the studies. The hard line represents the HR value showing no association (HR of 1). The dashed line represents the pooled point estimate of HR of anemia for the TB infection. The black dot at the center of the gray box represents the point HR estimate of each study, and the line indicates the 95% confidence interval of the estimates. The gray box represents the weight of each study contributing to the pooled HR estimate. The blue diamond represents the 95% confidence interval of the pooled HR estimate. HR hazard ratio, CI confidence interval, I2 shows the heterogeneity of the included studies, p indicates the statistical significance of the heterogeneity, + anemia severity not defined, * mild anemia, @ mild and moderate anemia, # moderate anemia, $ severe anemia
Fig. 8
Fig. 8
Forest plot of cohort studies; sub-group analysis pooled effect size (HR) estimates of anemia for TB by participant age. The scale in the x-axis represents HR risk estimate of the studies. The hard line represents the odd ratio value showing no association (HR of 1). The dashed line represents the pooled point estimate of HR of anemia for the TB infection. The black dot at the center of the gray box represents the point HR estimate of each study, and the line indicates the 95% confidence interval of the estimates. The gray boxes represent the weight of each study contributing to the pooled HR estimate. The first two blue diamonds represent the 95% confidence interval for subgroup analysis pooled HR estimate, and the last blue diamond represents the 95% confidence interval for overall pooled HR estimate. HR hazard ratio, CI confidence interval, I2 shows the heterogeneity of the included studies, p indicates the statistical significance of the heterogeneity, + anemia severity not defined, * mild anemia, @ mild and moderate anemia, # moderate anemia, $ severe anemia
Fig. 9
Fig. 9
Forest plot of cohort studies; sub-group analysis pooled effect size (HR) estimates of anemia for TB by anemia severity. The scale in the x-axis represents HR risk estimate of the studies. The hard line represents the HR value showing no association (HR of 1). The dashed line represents the pooled point estimate of HR of anemia for the TB infection. The black dot at the center of the gray box represents the point HR estimate of each study, and the line indicates the 95% confidence interval of the estimates. The gray boxes represent the weight of each study contributing to the pooled HR estimate. The first five blue diamonds represent the 95% confidence interval for subgroup analysis pooled HR estimate, and the last blue diamond represents the 95% confidence interval for overall pooled HR estimate. HR hazard ratio, CI confidence interval, I-squared shows the heterogeneity of the included studies, p indicates the statistical significance of the heterogeneity

References

    1. Stevens GA, Finucane MM, De-Regil LM, Paciorek CJ, Flaxman SR, Branca F, et al. Global, regional, and national trends in haemoglobin concentration and prevalence of total and severe anaemia in children and pregnant and non-pregnant women for 1995–2011: a systematic analysis of population-representative data. Lancet Glob Health. 2013;1(1):16–25. doi: 10.1016/S2214-109X(13)70001-9. - DOI - PMC - PubMed
    1. WHO, Haemoglobin concentrations for the diagnosis of anaemia and assessment of severity; World Health Organization; Available from: https://www.who.int/vmnis/indicators/haemoglobin.pdf; Access date; October 20, 2020.
    1. De Benoist B, Cogswell M, Egli I, McLean E. Worldwide prevalence of anaemia 1993-2005. WHO Global Database of anaemia: World Health Organization; 2008. - PubMed
    1. Cote C, Zilberberg MD, Mody SH, Dordelly LJ, Celli B. Haemoglobin level and its clinical impact in a cohort of patients with COPD. Eur Respir J. 2007;9(5):923–929. doi: 10.1183/09031936.00137106. - DOI - PubMed
    1. Barzegari S, Afshari M, Movahednia M, Moosazadeh M. Prevalence of anemia among patients with tuberculosis: a systematic review and meta-analysis. Indian J Tuberc. 2019;66(2):299–307. doi: 10.1016/j.ijtb.2019.04.002. - DOI - PubMed

LinkOut - more resources