. 2021 Jan 23;16(1):4.
doi: 10.1186/s13024-021-00425-8.

Comprehensive metabolic profiling of Parkinson's disease by liquid chromatography-mass spectrometry

Affiliations

Comprehensive metabolic profiling of Parkinson's disease by liquid chromatography-mass spectrometry

Yaping Shao et al. Mol Neurodegener. .

Abstract

Background: Parkinson's disease (PD) is a prevalent neurological disease in the elderly with increasing morbidity and mortality. Despite enormous efforts, rapid and accurate diagnosis of PD is still compromised. Metabolomics defines the final readout of genome-environment interactions through the analysis of the entire metabolic profile in biological matrices. Recently, unbiased metabolic profiling of human sample has been initiated to identify novel PD metabolic biomarkers and dysfunctional metabolic pathways, however, it remains a challenge to define reliable biomarker(s) for clinical use.

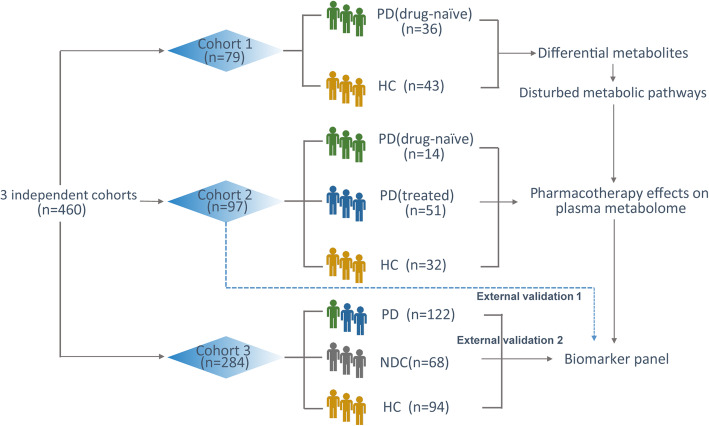
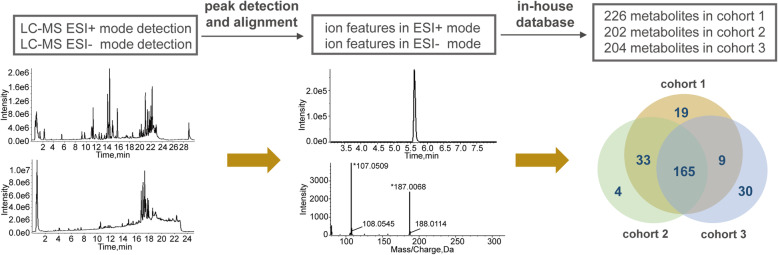
Methods: We presented a comprehensive metabolic evaluation for identifying crucial metabolic disturbances in PD using liquid chromatography-high resolution mass spectrometry-based metabolomics approach. Plasma samples from 3 independent cohorts (n = 460, 223 PD, 169 healthy controls (HCs) and 68 PD-unrelated neurological disease controls) were collected for the characterization of metabolic changes resulted from PD, antiparkinsonian treatment and potential interferences of other diseases. Unbiased multivariate and univariate analyses were performed to determine the most promising metabolic signatures from all metabolomic datasets. Multiple linear regressions were applied to investigate the associations of metabolites with age, duration time and stage of PD. The combinational biomarker model established by binary logistic regression analysis was validated by 3 cohorts.

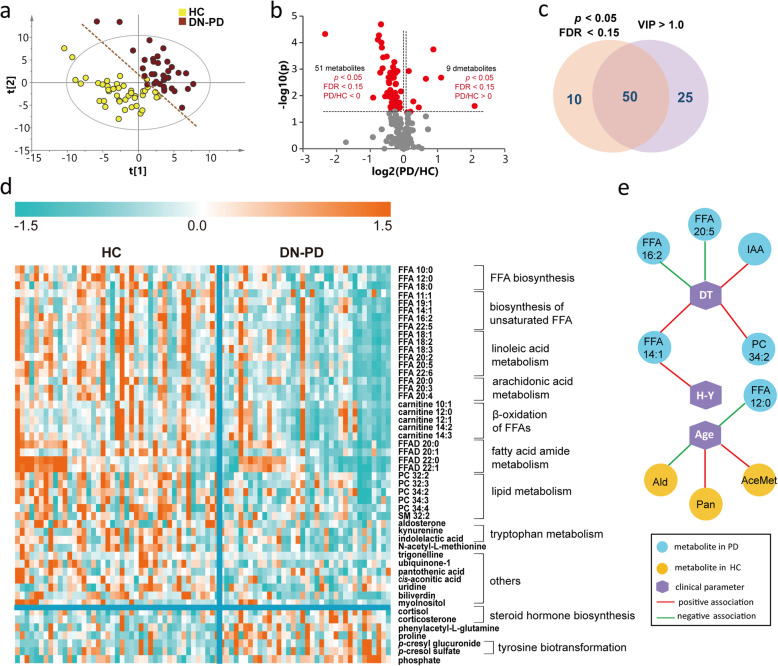
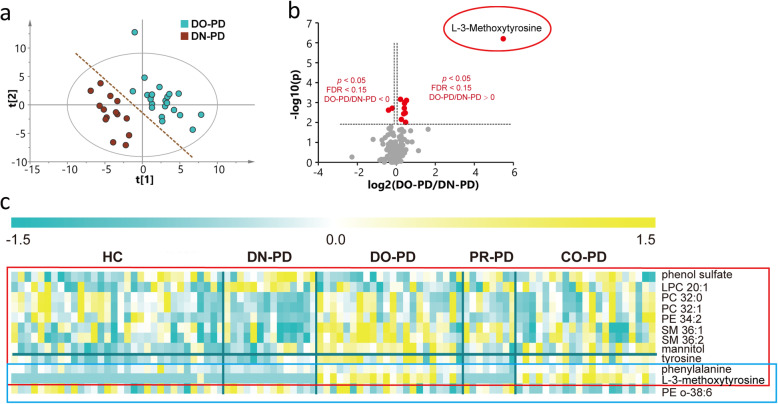
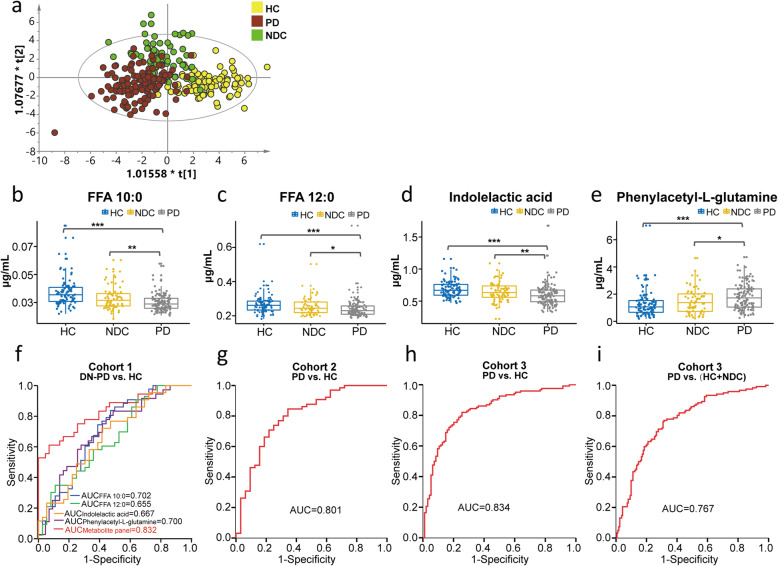
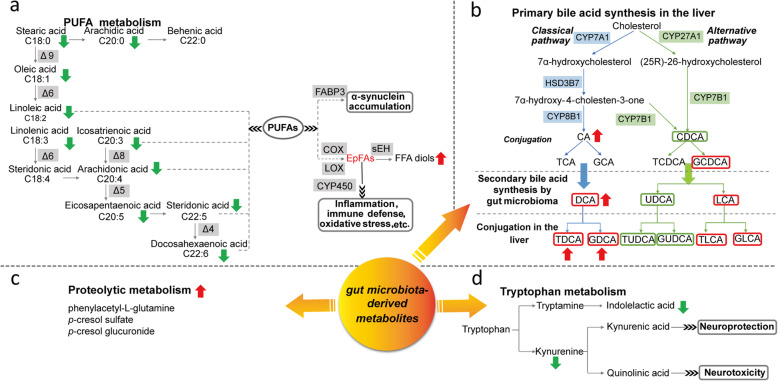
Results: A list of metabolites including amino acids, acylcarnitines, organic acids, steroids, amides, and lipids from human plasma of 3 cohorts were identified. Compared with HC, we observed significant reductions of fatty acids (FFAs) and caffeine metabolites, elevations of bile acids and microbiota-derived deleterious metabolites, and alterations in steroid hormones in drug-naïve PD. Additionally, we found that L-dopa treatment could affect plasma metabolome involved in phenylalanine and tyrosine metabolism and alleviate the elevations of bile acids in PD. Finally, a metabolite panel of 4 biomarker candidates, including FFA 10:0, FFA 12:0, indolelactic acid and phenylacetyl-glutamine was identified based on comprehensive discovery and validation workflow. This panel showed favorable discriminating power for PD.

Conclusions: This study may help improve our understanding of PD etiopathogenesis and facilitate target screening for therapeutic intervention. The metabolite panel identified in this study may provide novel approach for the clinical diagnosis of PD in the future.

Keywords: Bile acid profile; Biomarker; Metabolic disturbances; Metabolomics; Parkinson’s disease.


Conflict of interest statement

The author declares no competing interests.

Figures

Fig. 1
Fig. 1
Flow chart of the experimental design. Totally, 460 plasma samples were collected and divided into three independent data sets for metabolomics analysis
Fig. 2
Fig. 2
Overview of the detection and identification of metabolites in three cohorts. Briefly, each plasma sample was analyzed by both LC-MS ESI+ mode and ESI- mode to facilitate the ionization and detection of alkaline compounds and acidic compounds, respectively. After peak detection and alignment and metabolite recognition, 226, 202 and 204 metabolites were identified in each cohort
Fig. 3
Fig. 3
Altered metabolic profiles in drug-naïve PD compared with HC. a PLS-DA score plot of DN-PD and HC in cohort 1. R2X = 0.212, R2Y = 0.758, Q2 = 0.594. The analysis of variance was based on cross-validated prediction residuals (CV-ANOVA) data: p = 9.6139E-014, F factor = 26.7611. b Volcano plot of the differential metabolites in DN-PD filtered by univariate analysis. c Venn plot of the differential metabolites filtered by PLS-DA model and univariate analysis. d Heat map of the 50 differential metabolites in DN-PD. Blue indicates a decreased level, orange indicates an increased level. e Associations of metabolites with disease severity, duration time and age. DT: duration time; IAA: indolelactic acid; Ald: aldosterone; Pan: pantothenic acid; AceMet: N-acetyl-L-methionine
Fig. 4
Fig. 4
Impacts of drug therapies on plasma metabolome of PD. a PLS-DA score plot of DN-PD and DO-PD in cohort 2. R2X = 0.179, R2Y = 0.863, Q2 = 0.323. CV-ANOVA data: p = 0.0030, F factor = 5.0488. b Volcano plot of the significantly changed metabolites in the plasma of PD patients after L-dopa treatment. c Heat map of differential metabolites between treated PD and DN-PD, which showed possible drug effects to the plasma metabolome
Fig. 5
Fig. 5
Differential metabolites in PD compared with HC and NDC. a OPLS-DA score plot of PD, HC and NDC in cohort 3. R2X = 0.389, R2Y = 0.543, Q2 = 0.347. CV-ANOVA data: p = 0, F factor = 17.7056. b ~ e Box plots of FFA 10:0, FFA 12:0, indolelactic acid and phenylacetyl-L-glutamine in three groups. Data were expressed as means ± SE. *: p < 0.05, **: p < 0.01, ***: p < 0.001. The ROC curves of the metabolite panel to discriminate PD from control groups. f DN-PD vs. HC in cohort 1. The ranges of AUC values at the 95% confidence interval (CI) for FFA 10:0, FFA 12:0, indolelactic acid, phenylacetyl-L-glutamine and metabolite panel were 0.584 ~ 0.820, 0.534 ~ 0.776, 0.547 ~ 0.787, 0.585 ~ 0.816 and 0.742 ~ 0.922, respectively. g PD vs. HC in cohort 2. The AUC value ranges from 0.704 to 0.898 at 95% CI. h PD vs. HC in cohort 3. The AUC value ranges from 0.778 to 0.889 at 95% CI. i. PD vs. (HC + NDC) in cohort 3. The AUC value ranges from 0.711 to 0.822 at 95% CI
Fig. 6
Fig. 6
Metabolic disturbances in PD. a Alterations in PUFA metabolism. b. Alterations in bile acid synthesis pathway. The red frame indicates cytotoxic bile acid, the green frame indicates neuroprotective bile acid. c The proteolytic metabolism products were increased in PD. d Alterations in tryptophan metabolism

References

    1. de Lau LM, Breteler MM. Epidemiology of Parkinson's disease. Lancet Neurol. 2006;5:525–535. doi: 10.1016/S1474-4422(06)70471-9. - DOI - PubMed
    1. Tysnes OB, Storstein A. Epidemiology of Parkinson's disease. J Neural Transm (Vienna) 2017;124:901–905. doi: 10.1007/s00702-017-1686-y. - DOI - PubMed
    1. Hatano T, Saiki S, Okuzumi A, Mohney RP, Hattori N. Identification of novel biomarkers for Parkinson's disease by metabolomic technologies. J Neurol Neurosurg Psychiatry. 2016;87:295–301. doi: 10.1136/jnnp-2014-309676. - DOI - PubMed
    1. Cressatti M, Juwara L, Galindez JM, Velly AM, Nkurunziza ES, Marier S, Canie O, Gornistky M, Schipper HM. Salivary microR-153 and microR-223 levels as potential diagnostic biomarkers of idiopathic Parkinson's disease. Mov Disord. 2020;35:468-77. - PubMed
    1. Burte F, Houghton D, Lowes H, Pyle A, Nesbitt S, Yarnall A, Yu-Wai-Man P, Burn DJ, Santibanez-Koref M, Hudson G. Metabolic profiling of Parkinson's disease and mild cognitive impairment. Mov Disord. 2017;32:927–932. doi: 10.1002/mds.26992. - DOI - PMC - PubMed

Publication types