. 2021 Jan 23;9(1):26.
doi: 10.1186/s40168-020-00977-9.

Seasonal shifts in the gut microbiome indicate plastic responses to diet in wild geladas

Affiliations

Seasonal shifts in the gut microbiome indicate plastic responses to diet in wild geladas

Alice Baniel et al. Microbiome. .

Abstract

Background: Adaptive shifts in gut microbiome composition are one route by which animals adapt to seasonal changes in food availability and diet. However, outside of dietary shifts, other potential environmental drivers of gut microbial composition have rarely been investigated, particularly in organisms living in their natural environments.

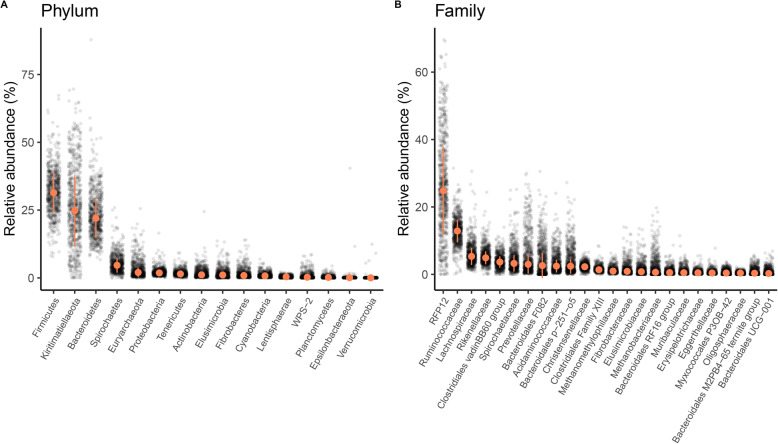
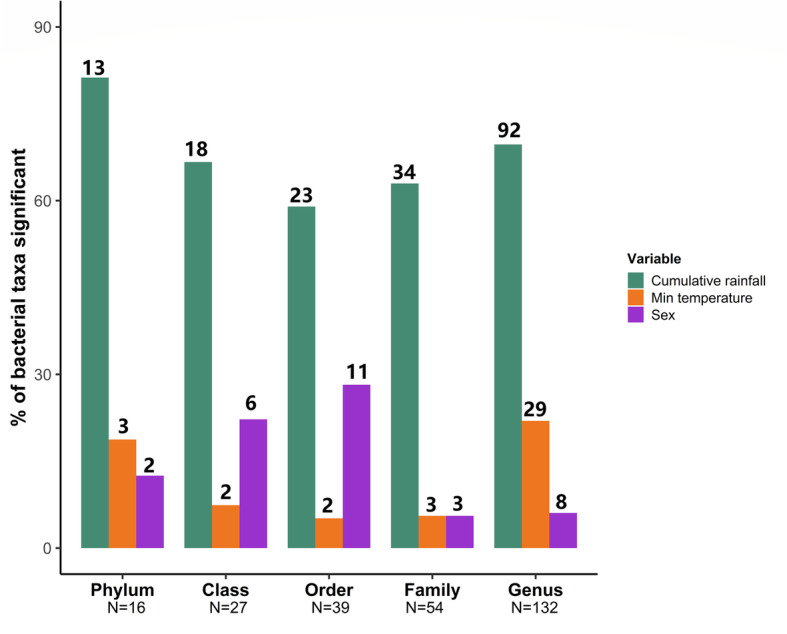
Results: Here, we generated the largest wild nonhuman primate gut microbiome dataset to date to identify the environmental drivers of gut microbial diversity and function in 758 samples collected from wild Ethiopian geladas (Theropithecus gelada). Because geladas live in a cold, high-altitude environment and have a low-quality grass-based diet, they face extreme thermoregulatory and energetic constraints. We tested how proxies of food availability (rainfall) and thermoregulatory stress (temperature) predicted gut microbiome composition of geladas. The gelada gut microbiome composition covaried with rainfall and temperature in a pattern that suggests distinct responses to dietary and thermoregulatory challenges. Microbial changes were driven by differences in the main components of the diet across seasons: in rainier periods, the gut was dominated by cellulolytic/fermentative bacteria that specialized in digesting grass, while during dry periods the gut was dominated by bacteria that break down starches found in underground plant parts. Temperature had a comparatively smaller, but detectable, effect on the gut microbiome. During cold and dry periods, bacterial genes involved in energy, amino acid, and lipid metabolism increased, suggesting a stimulation of fermentation activity in the gut when thermoregulatory and nutritional stress co-occurred, and potentially helping geladas to maintain energy balance during challenging periods.

Conclusion: Together, these results shed light on the extent to which gut microbiota plasticity provides dietary and metabolic flexibility to the host, and might be a key factor to thriving in changing environments. On a longer evolutionary timescale, such metabolic flexibility provided by the gut microbiome may have also allowed members of Theropithecus to adopt a specialized diet, and colonize new high-altitude grassland habitats in East Africa. Video abstract.

Keywords: Graminivory; Gut microbiome; Primates; Seasonality; Thermoregulation; Theropithecus gelada.


Conflict of interest statement

The authors declare no competing interests.

Figures

Fig. 1
Fig. 1
Taxonomic composition of the gelada gut at the phylum and family levels. Relative abundance (a) of all bacterial phyla and (b) of the 24 most abundant families (relative abundance> 0.02%) in the gelada feces. The median and median absolute deviation (error limit) are represented in orange.
Fig. 2
Fig. 2
Rainfall structures the gelada gut microbiome. a Partial residual plot of Shannon alpha diversity index according to cumulative rainfall (in mm). Black dots represent the partial residuals from the LMM (i.e., showing the association between cumulative rainfall and alpha diversity, while controlling for all other predictors). The blue line and confidence intervals come from a linear regression (for representation only). Seven outlier samples (with a particularly low Shannon index) were omitted for clarity of representation. b Visualization of between-sample dissimilarity (based on Aitchison distance) on the first principal component (PC1) according to cumulative rainfall. c Compositional barplot of the five most abundant phyla in the dry (< 100 mm of rain in the past month, N = 362) and wet (> 200 mm of rain in the past month, N = 282) samples (cumulative rainfall was converted to a categorical variable for representation purposes). d Loading scores of each amplicon sequence variant (ASV) on the first principal component. ASVs with a loading score > 0.4 (characteristics of the wet season) and < −0.4 (characteristic of the dry season) are colored.
Fig. 3
Fig. 3
Rainfall exerts the strongest effect on bacterial relative abundance. Percent of taxa that are significantly associated (Benjamini-Hochberg corrected p values: pBH < 0.05) with rainfall (purple bars), temperature (orange bars), or sex (green bars), across five taxonomic levels. For a given bacterial taxon, the significance of each predictor was assessed using a negative binomial GLMM of the count of this taxon per sample (controlling for sequencing depth as an offset factor, and including individual and unit membership as random effects). Only taxa with pBH < 0.05 were considered significant. The numbers above the bars depict the number of taxa significantly differentially abundant, while the numbers below indicate the total taxa measured per level. Age was not significantly associated with relative abundance of any taxa at any level
Fig. 4
Fig. 4
Rainfall predicts the relative abundance of many bacterial taxa. a Families and b Genera that are found differentially abundant according to cumulative rainfall. The estimate of the cumulative rainfall effect for each taxon comes from a negative binomial GLMM modeled separately for the counts of each taxon across  samples (controlling for sequencing depth as an offset factor, and including individual and unit membership as random effects). Taxa starting with “*” were fit with a binomial model instead. Only taxa with pBH < 0.05 were considered significant. For ease of representation on panel B, only genera with effect sizes > |0.2| are represented. The full list of differentially abundant genera can be found in Table S7. Assignment of the “broad function” of a family or genus is for representation only, and is a simplification of the various functions subsumed within each taxonomic group.
Fig. 5
Fig. 5
Relative abundance in six bacterial taxa (family or genus) that are significantly associated with rainfall. a Families more abundant during the wet season and b Families more abundant during the dry season. Note that the tick marks on the y-axis are spaced on a log10 scale (except for RFP12 which is plotted on a raw scale because of its high abundance). The blue line and confidence intervals come from a linear regression (for representation only). The significance of those effects has been estimated using negative binomial GLMMs including individual and unit membership as random effects
Fig. 6
Fig. 6
Rainfall predicts the functional profile of the gut microbiome. a Bacterial pathways at level 2 of KEGG Orthology (KO) that are differentially abundant according to cumulative rainfall (in mm). The estimate of the “rainfall” effect for each pathway comes from a LMM fitted on the relative abundance of each pathway per sample. Only pathways with pBH < 0.05 are reported. Relative abundance of the three most enhanced functional pathways during b the wet season and c the dry season according to monthly cumulative rainfall. Note that the tick marks on the y-axis are spaced on a log10 scale. The blue line and confidence intervals come from a linear regression (for representation only). The significance of the rainfall effect effects per pathway was estimated using LMMs including individual and unit membership as random effects

References

    1. Dufour DL, Sauther ML. Comparative and evolutionary dimensions of the energetics of human pregnancy and lactation. Am J Hum Biol. 2002;14:584–602. doi: 10.1002/ajhb.10071. - DOI - PubMed
    1. McNab BK. The physiological ecology of vertebrates: a view from energetics: Cornell University Press; Ithaca, NY. 2002.
    1. van Schaik CP, Brockman DK. Seasonality in primate ecology, reproduction, and life history. Seasonality Primates. 2005;44:1.
    1. Doran D. Influence of seasonality on activity patterns, feeding behavior, ranging, and grouping patterns in Tai chimpanzees. Int J Primatol. 1997;18:183–206. doi: 10.1023/A:1026368518431. - DOI
    1. Gursky S. Effect of seasonality on the behavior of an insectivorous primate, Tarsius spectrum. Int J Primatol. 2000;21:477–495. doi: 10.1023/A:1005444020059. - DOI

Publication types

LinkOut - more resources