. 2021 Jan 7:14:612749.
doi: 10.3389/fnins.2020.612749. eCollection 2020.

Mild Traumatic Brain Injury Induces Transient, Sequential Increases in Proliferation, Neuroblasts/Immature Neurons, and Cell Survival: A Time Course Study in the Male Mouse Dentate Gyrus

Affiliations

Mild Traumatic Brain Injury Induces Transient, Sequential Increases in Proliferation, Neuroblasts/Immature Neurons, and Cell Survival: A Time Course Study in the Male Mouse Dentate Gyrus

Lyles R Clark et al. Front Neurosci. .

Abstract

Mild traumatic brain injuries (mTBIs) are prevalent worldwide. mTBIs can impair hippocampal-based functions such as memory and cause network hyperexcitability of the dentate gyrus (DG), a key entry point to hippocampal circuitry. One candidate for mediating mTBI-induced hippocampal cognitive and physiological dysfunction is injury-induced changes in the process of DG neurogenesis. There are conflicting results on how TBI impacts the process of DG neurogenesis; this is not surprising given that both the neurogenesis process and the post-injury period are dynamic, and that the quantification of neurogenesis varies widely in the literature. Even within the minority of TBI studies focusing specifically on mild injuries, there is disagreement about if and how mTBI changes the process of DG neurogenesis. Here we utilized a clinically relevant rodent model of mTBI (lateral fluid percussion injury, LFPI), gold-standard markers and quantification of the neurogenesis process, and three time points post-injury to generate a comprehensive picture of how mTBI affects adult hippocampal DG neurogenesis. Male C57BL/6J mice (6-8 weeks old) received either sham surgery or mTBI via LFPI. Proliferating cells, neuroblasts/immature neurons, and surviving cells were quantified via stereology in DG subregions (subgranular zone [SGZ], outer granule cell layer [oGCL], molecular layer, and hilus) at short-term (3 days post-injury, dpi), intermediate (7 dpi), and long-term (31 dpi) time points. The data show this model of mTBI induces transient, sequential increases in ipsilateral SGZ/GCL proliferating cells, neuroblasts/immature neurons, and surviving cells which is suggestive of mTBI-induced neurogenesis. In contrast to these ipsilateral hemisphere findings, measures in the contralateral hemisphere were not increased in key neurogenic DG subregions after LFPI. Our work in this mTBI model is in line with most literature on other and more severe models of TBI in showing TBI stimulates the process of DG neurogenesis. However, as our DG data in mTBI provide temporal, subregional, and neurogenesis-stage resolution, these data are important to consider in regard to the functional importance of TBI-induction of the neurogenesis process and future work assessing the potential of replacing and/or repairing DG neurons in the brain after TBI.

Keywords: LFPI; TBI; dentate gyrus; neurogenesis; proliferation.


Conflict of interest statement

The authors declare that the research was conducted in the absence of any commercial or financial relationships that could be construed as a potential conflict of interest.

Figures
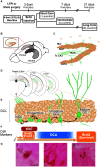
FIGURE 1
FIGURE 1
Experimental timeline and overview of dentate gyrus (DG) neurogenesis and immunohistochemical markers used. (A) Timeline of experimental procedures. 6-8 week old male C57BL6/J mice received lateral fluid percussive injury (LFPI) or Sham surgery, and 150 mg/kg i.p. Bromodeoxyuridine (BrdU) injection 3 days post-injury (dpi). The Short-Term group was perfused 3 dpi (2 h post-BrdU); the Intermediate group perfused 7 dpi (4 days post-BrdU); and the Long-Term group perfused 31 dpi (28 days post-BrdU). (B) Schematic of a whole mouse brain showing bilateral location of the hippocampus (gray structure). Exploded inset (red dotted lines) depicts a coronal section through the dorsal hippocampus (tan indicates primary cell layers) with the granule cell layer (GCL) of the DG indicated. (C) Schematic of enlarged DG subregions. GCL is represented by densely packed tan circles; individual tan circles represent dorsal boundary of DG (hippocampal fissure). Green circles/lines are GCL GCs and their axons project through the Hilus to eventually reach CA3 (not pictured). Mol: molecular layer. SGZ: subgranular zone. oGCL: outer granule cell layer. (D) Schematic of location of DG (green lines) in coronal sections of a mouse brain at three distances from Bregma (−2.4, −3.1, and 4-3.5 mm). (E,F) Exploded inset of red dotted line in (D) depicts stages of GCL neurogenesis and the antibodies with which cells in each neurogenesis stage can be labeled. Neural stem cells (NSCs) asymmetrically divide to create progenitor cells, whose progeny differentiate into immature granule cells, some of which survive to become mature granule cells. BrdU (in the Short-Term group) and Ki67 (all groups) mark dividing cells; doublecortin (DCX) marks neuroblasts/immature neurons (in all groups); and BrdU in the Long-term group marks surviving cells (cells that were dividing and labeled at the time of BrdU injection, and have survived to 31 dpi). (G) Representative photomicrographs of cells stained with antibodies against Ki67 (Gi), DCX (Gii), or BrdU (Giii). Scale bar = 10 um.
FIGURE 2
FIGURE 2
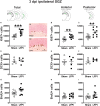
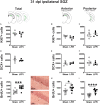
Relative to Sham, LFPI increases the number of Ki67-immunoreactive (Ki67+) proliferating cells in the ipsilateral mouse subgranular zone (SGZ) 3 dpi. As in Figure 1D, green lines in schematics (top row) indicate the ipsilateral SGZ/GCL. Stereological quantification of Ki67+ (A–C; Sham n = 9, LFPI n = 9), DCX+ (D–F; Sham n = 5, LFPI n = 5), and BrdU+ (G–I; Sham n = 9, LFPI n = 9) cells in the SGZ (Ki67, BrdU) and SGZ/GCL (DCX). Immunopositive cells were quantified considering immunopositive cells in the SGZ across the entire longitudinal axis (see sample representative schematics above A,D,G), and also divided into anterior DG (see sample schematic above B,E,H) and posterior DG (see sample schematic above C,F,I), operationally defined as Bregma levels −0.92 to −2.6; and −2.6 to −3.97, respectively. Representative photomicrographs of Sham (Ai) and LFPI (Aii) Ki67-stained tissue are shown alongside quantification of total Ki67+ cells. Scale bar = 50 μm. T-test, **p < 0.01 and ***p < 0.001.
FIGURE 3
FIGURE 3
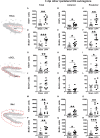
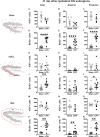
Relative to Sham, LFPI increases the number of Ki67+ and BrdU+ proliferating cells in the ipsilateral DG hilus and molecular layer (Mol) 3 dpi. Stereological quantification of Ki67+ (A–C, G–I, M–O; Sham n = 9, LFPI n = 9) and BrdU+ (D–F, J–L, P–R; Sham n = 9, LFPI n = 9) cells in the hilus (A–F; red dotted line region, top-left schematic), outer granule cell layer (G–L; red dotted line region, middle-left schematic), and molecular layer (M–R; red dotted line region, bottom-left schematic). Immunopositive cells were quantified across the entire longitudinal axis (A,D,G,J,M,P), and also broken up into anterior (B,E,H,K,N,Q), and posterior (C,F,I,L,O,R) bins, operationally defined as Bregma levels −0.92 to −2.6; and −2.6 to −3.97, respectively. T-test, *p < 0.05, **p < 0.01, and ***p < 0.001.
FIGURE 4
FIGURE 4
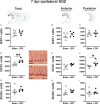
Relative to Sham, LFPI increases the number of DCX+ neuroblasts/immatures neurons in the ipsilateral mouse SGZ/GCL 7 dpi. Green lines in schematics (top row) indicate these measures were taken in the ipsilateral SGZ/GCL. Stereological quantification of Ki67+ (A–C; Sham n = 5, LFPI n = 5), DCX+ (D–F; Sham n = 5, LFPI n = 5), and BrdU+ (G–I; Sham n = 5, LFPI n = 5) cells in the SGZ (Ki67, BrdU) and GCL (DCX). Immunopositive cells were quantified across the entire longitudinal axis (A,D,G), and also broken up into anterior (B,E,H) and posterior (C,F,I) bins, operationally defined as Bregma levels −0.92 to −2.6; and −2.6 to −3.97, respectively. Representative photomicrographs of Sham (Di) and LFPI (Dii) DCX-stained tissue are shown alongside quantification of total DCX+ cells. Scale bar = 50 μm. T-test, *p < 0.05, **p < 0.01.
FIGURE 5
FIGURE 5
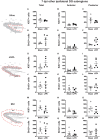
Relative to Sham, LFPI does not change the number of Ki67+ or BrdU+ cells in the ipsilateral DG hilus, oGCL, and Mol 7 dpi. Stereological quantification of Ki67+ (A–C,G–I,M–O; Sham n = 5, LFPI n = 5) and BrdU+ (D–F,J–L,P–R; Sham n = 5, LFPI n = 5) cells in the hilus (A–F; red dotted line region, top-left schematic), outer granule cell layer (G–L; red dotted line region, middle-left schematic), and molecular layer (M–R; red dotted line region, bottom-left schematic). Immunopositive cells were quantified across the entire longitudinal axis (A,D,G,J,M,P), and also broken up into anterior (B,E,H,K,N,Q), and posterior (C,F,I,L,O,R) bins, operationally defined as Bregma levels −0.92 to −2.6; and −2.6 to −3.97, respectively.
FIGURE 6
FIGURE 6
Relative to Sham, LFPI increases the number of BrdU+ surviving cells in the ipsilateral mouse SGZ 31 dpi. Green lines in schematics (top row) indicate these measures were taken in the ipsilateral SGZ/GCL. Stereological quantification of Ki67+ (A–C; Sham n = 5, LFPI n = 5), DCX+ (D–F; Sham n = 5, LFPI n = 5), and BrdU+ (G–I; Sham n = 10, LFPI n = 10) cells in the SGZ (Ki67, BrdU) and GCL (DCX). Immunopositive cells were quantified across the entire longitudinal axis (A,D,G), and also broken up into anterior (B,E,H) and posterior (C,F,I) bins, operationally defined as Bregma levels −0.92 to −2.6; and −2.6 to −3.97, respectively. Representative photomicrographs of Sham (Gi) and LFPI (Gii) BrdU-stained tissue are shown alongside quantification of total BrdU+ cells. Scale bar = 50 μm. T-test, *p < 0.05, ***p < 0.001, and ****p < 0.0001.
FIGURE 7
FIGURE 7
Relative to Sham, LFPI increases the number of BrdU+ surviving cells in the ipsilateral DG hilus, posterior oGCL, and Mol 31 dpi. Stereological quantification of Ki67+ (A–C,G–I,M–O; Sham n = 5, LFPI n = 5) and BrdU+ (D–F,J–L,P–R; Sham n = 10, LFPI n = 10) cells in the hilus (A–F; red dotted line region, top-left schematic), outer granule cell layer (G–L; red dotted line region, middle-left schematic), and molecular layer (M–R; red dotted line region, bottom-left schematic). Immunopositive cells were quantified across the entire longitudinal axis (A,D,G,J,M,P), and also broken up into anterior (B,E,H,K,N,Q) and posterior (C,F,I,L,O,R) bins, operationally defined as Bregma levels −0.92 to −2.6; and −2.6 to −3.97, respectively. T-test, *p < 0.05, **p < 0.01, and ****p < 0.0001.
FIGURE 8
FIGURE 8
Summary of neurogenesis changes in LFPI vs. Sham mice at three time points post-injury. Percent change in LFPI vs. Sham number of cells immunoreactive for Ki67, DCX, and BrdU in the ipsilateral (top) and contralateral (bottom) dentate gyrus (DG) subregions 3 dpi (left column), 7 dpi (middle column), and 31 dpi (right column). These summary percentages reflect data presented in Figures 2–7 and Supplementary Figures 1–6. =, not changed vs. Sham. Light-blue shading, increased in LFPI vs. Sham. Rose shading, decreased in LFPI vs. Sham. White, not determined. Light-gray shading, not part of this study. 1quantified in both SGZ and GCL. Mol, molecular layer. oGCL, outer granule cell layer. SGZ, subgranular zone.

Similar articles

Cited by

References

    1. Acosta S. A., Tajiri N., Shinozuka K., Ishikawa H., Grimmig B., Diamond D. M., et al. (2013). Long-term upregulation of inflammation and suppression of cell proliferation in the brain of adult rats exposed to traumatic brain injury using the controlled cortical impact model. PLoS One 8:e53376. 10.1371/journal.pone.0053376 - DOI - PMC - PubMed
    1. Aertker B. M., Bedi S., Cox C. S., Jr. (2016). Strategies for CNS repair following TBI. Exp. Neurol. 275(Pt 3) 411–426. 10.1016/j.expneurol.2015.01.008 - DOI - PubMed
    1. Aimone J. B., Li Y., Lee S. W., Clemenson G. D., Deng W., Gage F. H. (2014). Regulation and function of adult neurogenesis: from genes to cognition. Physiol. Rev. 94 991–1026. 10.1152/physrev.00004.2014 - DOI - PMC - PubMed
    1. Aleem M., Goswami N., Kumar M., Manda K. (2020). Low-pressure fluid percussion minimally adds to the sham craniectomy-induced neurobehavioral changes: Implication for experimental traumatic brain injury model. Exp. Neurol. 329:113290. 10.1016/j.expneurol.2020.113290 - DOI - PubMed
    1. Arguello A. A., Harburg G. C., Schonborn J. R., Mandyam C. D., Yamaguchi M., Eisch A. J. (2008). Time course of morphine’s effects on adult hippocampal subgranular zone reveals preferential inhibition of cells in S phase of the cell cycle and a subpopulation of immature neurons. Neuroscience 157 70–79. 10.1016/j.neuroscience.2008.08.064 - DOI - PMC - PubMed

LinkOut - more resources