

Progressive Shifts in the Gut Microbiome Reflect Prediabetes and Diabetes Development in a Treatment-Naive Mexican Cohort
- PMID: 33488518
- PMCID: PMC7821428
- DOI: 10.3389/fendo.2020.602326
Progressive Shifts in the Gut Microbiome Reflect Prediabetes and Diabetes Development in a Treatment-Naive Mexican Cohort
Abstract
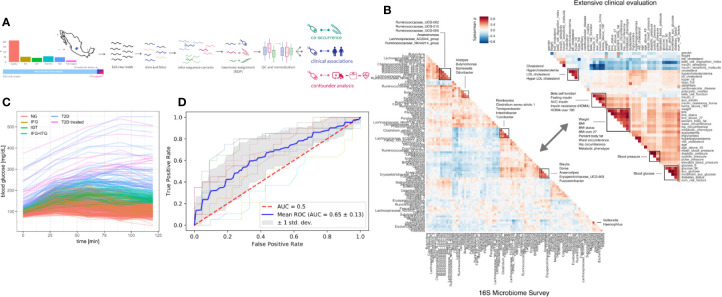
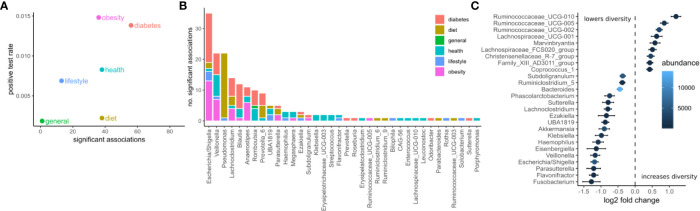
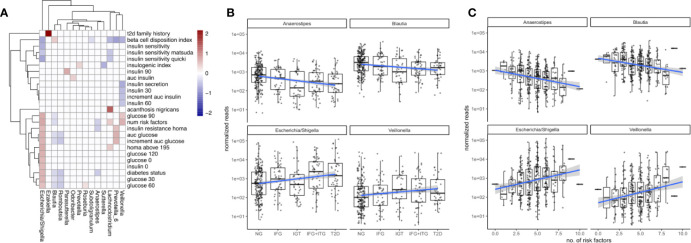
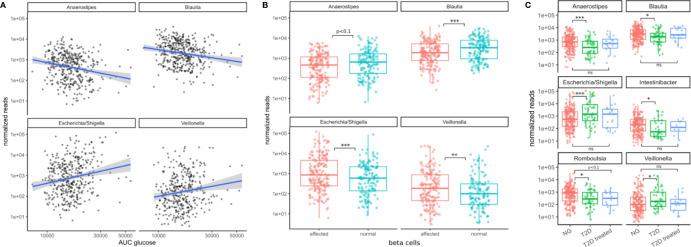
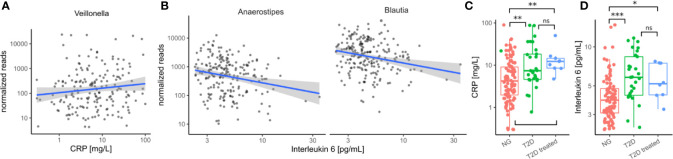
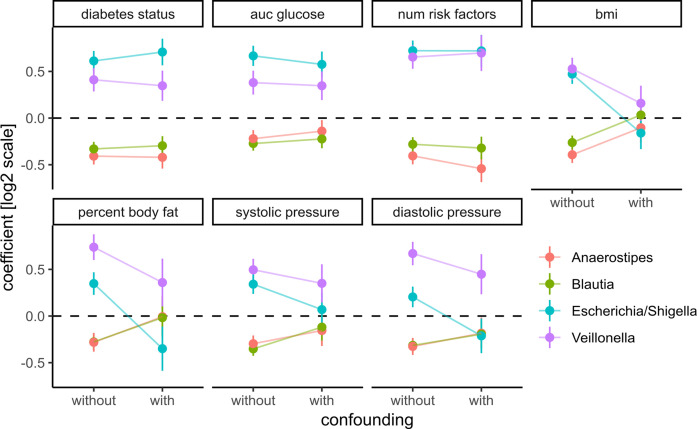
Type 2 diabetes (T2D) is a global epidemic that affects more than 8% of the world's population and is a leading cause of death in Mexico. Diet and lifestyle are known to contribute to the onset of T2D. However, the role of the gut microbiome in T2D progression remains uncertain. Associations between microbiome composition and diabetes are confounded by medication use, diet, and obesity. Here we present data on a treatment-naive cohort of 405 Mexican individuals across varying stages of T2D severity. Associations between gut bacteria and more than 200 clinical variables revealed a defined set of bacterial genera that were consistent biomarkers of T2D prevalence and risk. Specifically, gradual increases in blood glucose levels, beta cell dysfunction, and the accumulation of measured T2D risk factors were correlated with the relative abundances of four bacterial genera. In a cohort of 25 individuals, T2D treatment-predominantly metformin-reliably returned the microbiome to the normoglycemic community state. Deep clinical characterization allowed us to broadly control for confounding variables, indicating that these microbiome patterns were independent of common T2D comorbidities, like obesity or cardiovascular disease. Our work provides the first solid evidence for a direct link between the gut microbiome and T2D in a critically high-risk population. In particular, we show that increased T2D risk is reflected in gradual changes in the gut microbiome. Whether or not these T2D-associated changes in the gut contribute to the etiology of T2D or its comorbidities remains to be seen.
Keywords: Mexico; deep phenotyping; metformin; microbiome; type 2 diabetes.
Copyright © 2021 Diener, Reyes-Escogido, Jimenez-Ceja, Matus, Gomez-Navarro, Chu, Zhong, Tejero, Alm, Resendis-Antonio and Guardado-Mendoza.
Conflict of interest statement
The authors declare that the research was conducted in the absence of any commercial or financial relationships that could be construed as a potential conflict of interest.
Figures
Similar articles
-
The gut microbiome and type 2 diabetes status in the Multiethnic Cohort.PLoS One. 2021 Jun 23;16(6):e0250855. doi: 10.1371/journal.pone.0250855. eCollection 2021. PLoS One. 2021. PMID: 34161346 Free PMC article.
-
Changes in the type 2 diabetes gut mycobiome associate with metformin treatment across populations.mBio. 2024 Jun 12;15(6):e0016924. doi: 10.1128/mbio.00169-24. Epub 2024 May 20. mBio. 2024. PMID: 38767350 Free PMC article.
-
Trans-ethnic gut microbiota signatures of type 2 diabetes in Denmark and India.Genome Med. 2021 Mar 3;13(1):37. doi: 10.1186/s13073-021-00856-4. Genome Med. 2021. PMID: 33658058 Free PMC article.
-
Metformin use in prediabetes: A review of evidence and a focus on metabolic features among peri-menopausal women.Diabetes Obes Metab. 2025 Jun;27 Suppl 3(Suppl 3):3-15. doi: 10.1111/dom.16442. Epub 2025 May 6. Diabetes Obes Metab. 2025. PMID: 40329646 Free PMC article. Review.
-
Prevention and Treatment of Type 2 Diabetes: A Pathophysiological-Based Approach.Trends Endocrinol Metab. 2018 Jun;29(6):370-379. doi: 10.1016/j.tem.2018.03.014. Epub 2018 Apr 14. Trends Endocrinol Metab. 2018. PMID: 29665986 Review.
Cited by
-
Type 2 diabetes, gut microbiome, and systems biology: A novel perspective for a new era.Gut Microbes. 2022 Jan-Dec;14(1):2111952. doi: 10.1080/19490976.2022.2111952. Gut Microbes. 2022. PMID: 36004400 Free PMC article. Review.
-
Application of tongue image characteristics and oral-gut microbiota in predicting pre-diabetes and type 2 diabetes with machine learning.Front Cell Infect Microbiol. 2024 Nov 4;14:1477638. doi: 10.3389/fcimb.2024.1477638. eCollection 2024. Front Cell Infect Microbiol. 2024. PMID: 39559704 Free PMC article.
-
Impact of Ketogenic and Mediterranean Diets on Gut Microbiota Profile and Clinical Outcomes in Drug-Naïve Patients with Diabesity: A 12-Month Pilot Study.Metabolites. 2025 Jan 6;15(1):22. doi: 10.3390/metabo15010022. Metabolites. 2025. PMID: 39852366 Free PMC article.
-
Dysbiosis signatures of gut microbiota and the progression of type 2 diabetes: a machine learning approach in a Mexican cohort.Front Endocrinol (Lausanne). 2023 Jun 27;14:1170459. doi: 10.3389/fendo.2023.1170459. eCollection 2023. Front Endocrinol (Lausanne). 2023. PMID: 37441494 Free PMC article.
-
Gut Microbiota Composition in Prediabetes and Newly Diagnosed Type 2 Diabetes: A Systematic Review of Observational Studies.Front Cell Infect Microbiol. 2022 Aug 15;12:943427. doi: 10.3389/fcimb.2022.943427. eCollection 2022. Front Cell Infect Microbiol. 2022. PMID: 36046745 Free PMC article.
References
-
- Guardado-Mendoza R, Davalli AM, Chavez AO, Hubbard GB, Dick EJ, Majluf-Cruz A, et al. Pancreatic islet amyloidosis, -cell apoptosis, and -cell proliferation are determinants of islet remodeling in type-2 diabetic baboons. Proc Natl Acad Sci (2009) 106:13992–7. 10.1073/pnas.0906471106 - DOI - PMC - PubMed
Publication types
MeSH terms
Substances
LinkOut - more resources
Full Text Sources
Other Literature Sources
Medical