. 2021 Jan 6:11:610009.
doi: 10.3389/fmicb.2020.610009. eCollection 2020.

Evidence That Microorganisms at the Animal-Water Interface Drive Sea Star Wasting Disease

Affiliations

Evidence That Microorganisms at the Animal-Water Interface Drive Sea Star Wasting Disease

Citlalli A Aquino et al. Front Microbiol. .

Abstract

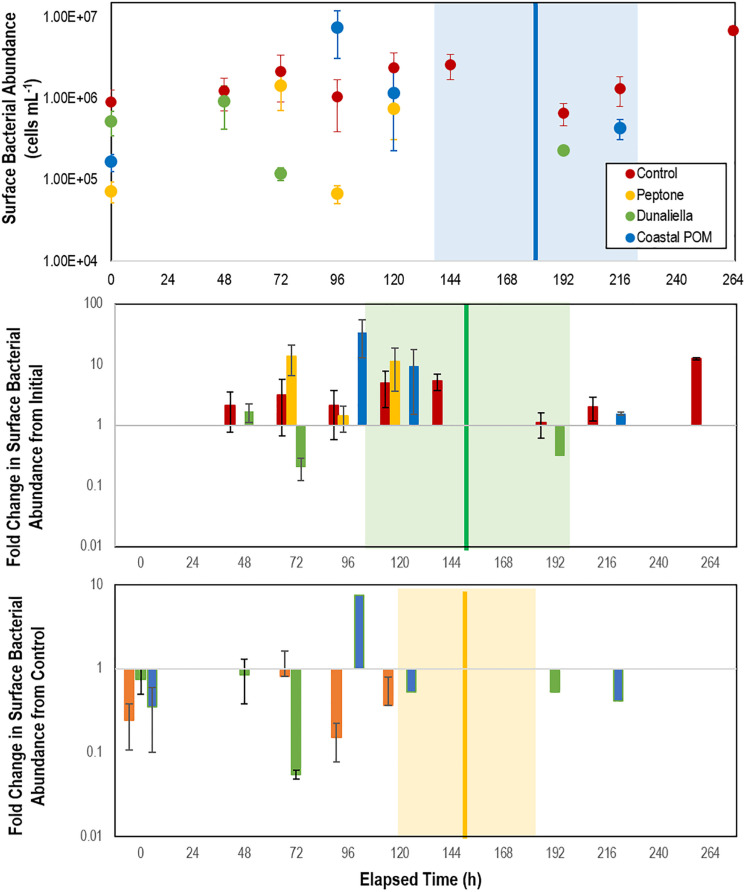
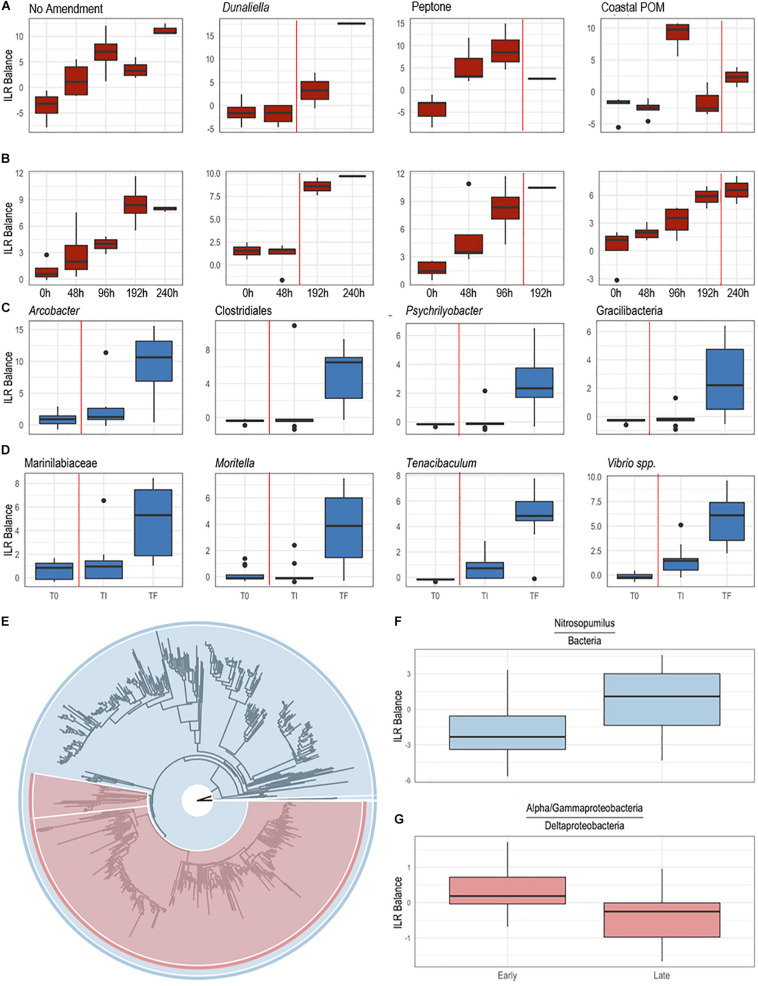
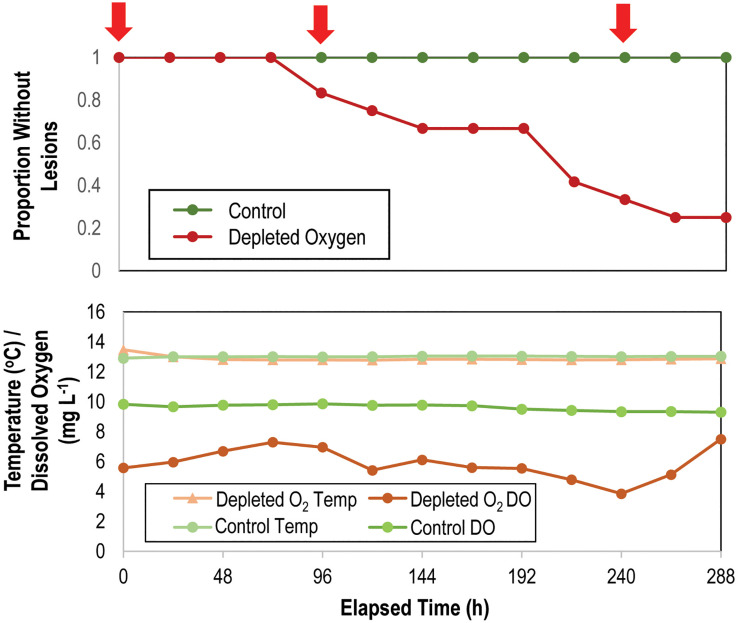
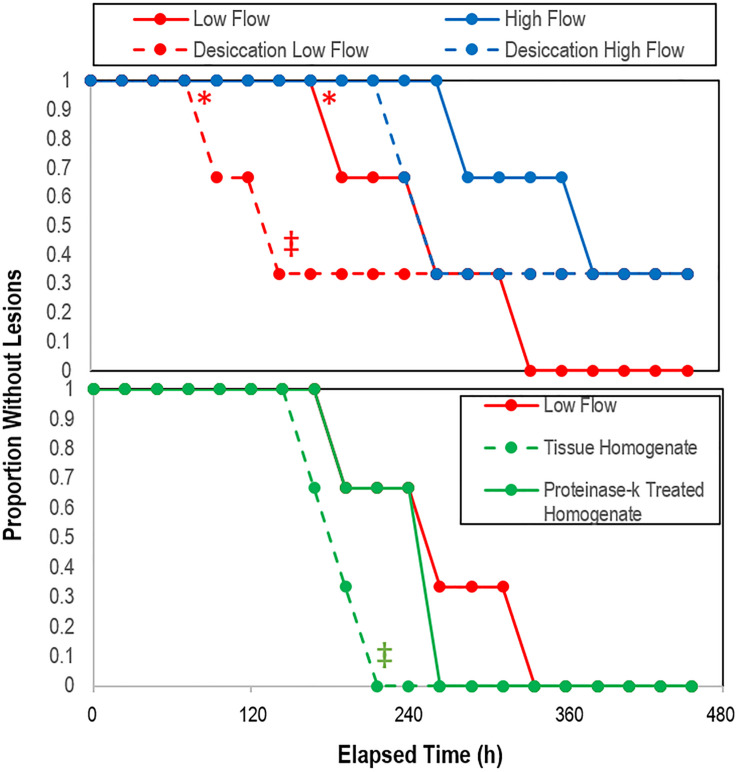
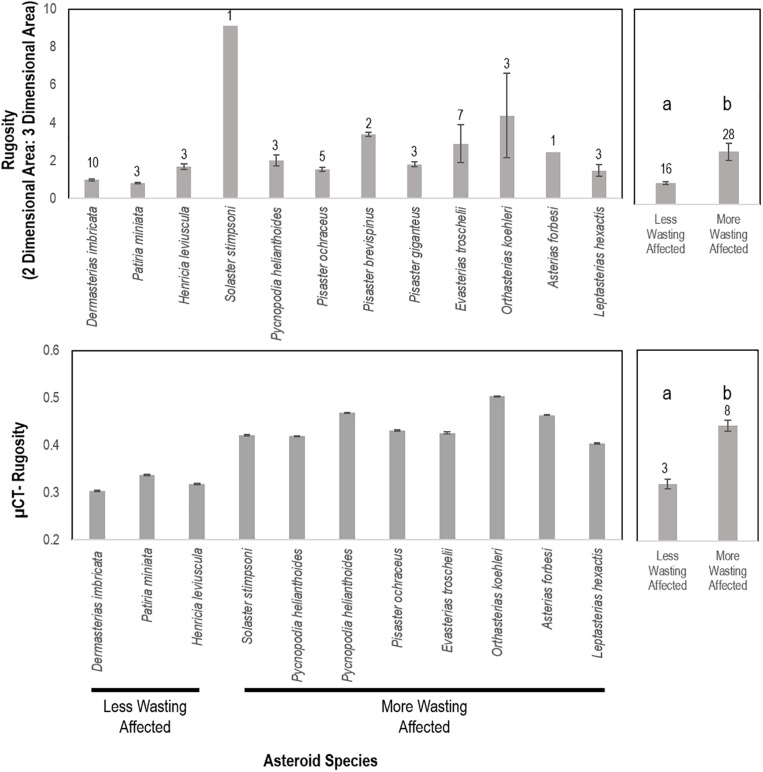
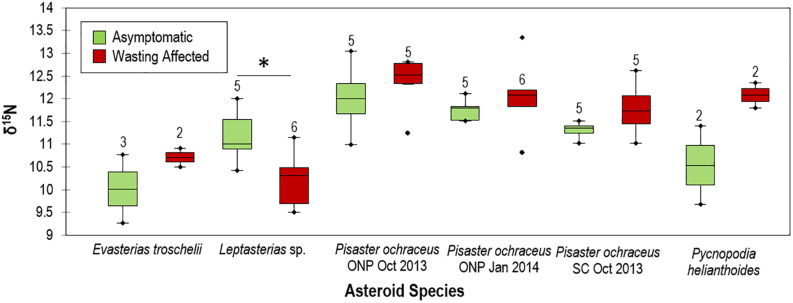
Sea star wasting (SSW) disease describes a condition affecting asteroids that resulted in significant Northeastern Pacific population decline following a mass mortality event in 2013. The etiology of SSW is unresolved. We hypothesized that SSW is a sequela of microbial organic matter remineralization near respiratory surfaces, one consequence of which may be limited O2 availability at the animal-water interface. Microbial assemblages inhabiting tissues and at the asteroid-water interface bore signatures of copiotroph proliferation before SSW onset, followed by the appearance of putatively facultative and strictly anaerobic taxa at the time of lesion genesis and as animals died. SSW lesions were induced in Pisaster ochraceus by enrichment with a variety of organic matter (OM) sources. These results together illustrate that depleted O2 conditions at the animal-water interface may be established by heterotrophic microbial activity in response to organic matter loading. SSW was also induced by modestly (∼39%) depleted O2 conditions in aquaria, suggesting that small perturbations in dissolved O2 may exacerbate the condition. SSW susceptibility between species was significantly and positively correlated with surface rugosity, a key determinant of diffusive boundary layer thickness. Tissues of SSW-affected individuals collected in 2013-2014 bore δ15N signatures reflecting anaerobic processes, which suggests that this phenomenon may have affected asteroids during mass mortality at the time. The impacts of enhanced microbial activity and subsequent O2 diffusion limitation may be more pronounced under higher temperatures due to lower O2 solubility, in more rugose asteroid species due to restricted hydrodynamic flow, and in larger specimens due to their lower surface area to volume ratios which affects diffusive respiratory potential.

Keywords: heterotroph; oxygen; phytoplankton; remineralization; sea star wasting.


Conflict of interest statement

The authors declare that the research was conducted in the absence of any commercial or financial relationships that could be construed as a potential conflict of interest.

Figures

FIGURE 1
FIGURE 1
Conceptualization of how microbial activities in the DBL may precipitate SSW. Under typical conditions (A), DBL conditions are normoxic. When OM increases in overlying waters (B; e.g., during elevated primary productivity, from terrestrial runoff, or from decaying asteroid carcasses), microbial heterotrophic respiration and cell abundance are stimulated, which may result in the formation of depleted O2 within the DBL. This in turn results in longer distances over which diffusion must occur to maintain animal respiratory demand. Over time (C) depleted O2 conditions in the DBL results in tissue damage, and prevalence of strict and facultative anaerobes. Because their growth is less efficient than aerobic metabolisms their abundance is less than at onset of depleted O2 conditions. Release of labile OM from decaying tissues (D) and persistent OM-rich conditions within the asteroid DBL result in animal mortality.
FIGURE 2
FIGURE 2
Proportion of grossly normal P. ochraceus (n = 5 each treatment) incubated in flow-through conditions at the Bodega Marine Lab in response to organic matter enrichments (Peptone, Dunaliella tertiolecta culture POM, and coastal POM collected from the inflow at the Bodega Marine Laboratory in August 2019). Dissolved O2 and temperature were measured in flow-through sea tables bearing each OM treatment. Error Bars = SE. The red arrows above the top panel indicate sampling for microbiome analyses. * indicates wasting speed (i.e., time to appearance of first lesion) was significantly (p < 0.05, Student’s t-test) faster than control. indicates that the overall trend in lesion formation was significantly different to controls (p < 0.05, log-rank test).
FIGURE 3
FIGURE 3
Abundance of bacteria in proximity to P. ochraceus surfaces (top), fold change from initial (middle), and relative to controls (bottom). During first 10 days of experiment in response to organic matter enrichment (n = 5 for each treatment) as assessed by SYBR Gold staining and epifluorescence microscopy. Control specimens are indicated in red, while the mean of specimens that wasted in Peptone, Dunaliella tertiolecta POM, and Coastal POM are indicated separately. The solid vertical line on the top panel represents the mean time that asteroids developed lesions in the coastal POM treatment, the solid line on the middle panel represents the mean time for lesion development in Dunaliella tertiolecta POM treatments, and solid line on the bottom panel represents the mean time for lesion development in peptone treatments (separated between panels for clarity). The shaded regions represent lesion development standard error for respective treatments.
FIGURE 4
FIGURE 4
Relative abundance of bacterial orders derived from P. ochraceus epidermal swabs. Specimens were enriched with the indicated organic material and sampled until lesion genesis. n values reflect the number of healthy specimens at each given timepoint. The solid blue line on each panel indicates when lesions first formed per treatment, and the solid red line on each panel indicates the mean lesion time within the treatment.
FIGURE 5
FIGURE 5
Differential abundance of bacterial taxa from surface swabs [(A,B,E–G); P. ochraceus August 2019]; and body wall samples [(C,D); P. ochraceus June 2018]. (A,B) were derived from a PhyloFactor object and show the ILR balance of Flavobacteriales (A) and Rhodobacterales (B) relative to all other sOTUs. Organic amendment is given above boxplots. Total sample numbers for each treatment (which varied due to the loss of asteroids over the course of the experiment to wasting) is given in Figure 4. The vertical red line in panels (A–D) indicate the average time at which asteroids formed lesions. (C,D) Boxplots were derived using PhyloFactor (Washburne et al., 2017), which uses a generalized linear model to regress the isometric log-ratio (ILR balance) between opposing clades (contrasted by an edge) on a phylogenetic tree. This was done iteratively, with each iteration, or factor, maximizing the F statistic from regression. Shown taxa represent either a single factor or combination of factors (when, for example, multiple factors identified different sOTUs with the same taxonomic classification). Labels represent either the highest taxonomic resolution or the highest classification shared by all sOTUs of a given clade. T0, experiment commencement; TI, lesion genesis; TF, time of death. (E–G) Balance contrast of early (before lesion genesis) samples compared to late (immediately prior to lesion genesis) samples. Samples were transformed using the Phylogenetic Isometric Log-Ratio (PhILR; Silverman et al., 2017) transform, which uses a phylogenetic tree (E) to convert an sOTU table into a new matrix of coordinates derived from the ILR of clades that descend from a common node. We used a sparse logistic regression with an l1 penalty of λ = 0.15 (Silverman et al., 2017) to analyze the ILR at each node, and included a select number of “balances” with positive coefficients (F,G). (F) is the balance of Nitrosopumilus (colored blue in (E), comprises the thin sliver on the right side of the tree) relative to the rest of the dataset [also shown in blue in (E)]. A positive shift indicates an increase in Nitrosopumilus relative to its denominator. (G) is the balance between a clade of Alpha/Gammaproteobacteria [large, red clade in (E)] and Deltaproteobacteria [Bdellovibrionales and Desulfobacterales; small, red clade in (E)]. A negative shift indicates that the denominator, Deltaproteobacteria, is increasing relative to Alpha/Gammaproteobacteria.
FIGURE 6
FIGURE 6
Proportion of grossly normal P. ochraceus (n = 6) remaining over time during longitudinal study of microbiome composition in the absence of external stimuli. The mean flow rate into aquariums was 3.81 ± 0.05 mL s–1 (average residence time in aquariums 37 min). The panel below shows temperature and pH during the experimental period.
FIGURE 7
FIGURE 7
Proportion of grossly normal Asterias forbesi (n = 12 per treatment) incubated in normoxic and depleted oxygen water (top) and variation in temperature and O2 in incubation aquaria (bottom) over time. The red arrows at top indicate samples which were included in analysis of microbiome composition (see Supplementary Figure S6).
FIGURE 8
FIGURE 8
Proportion grossly normal P. ochraceus over time in response to treatment (top) desiccation (n = 3), and (bottom) treatment with crude and proteinase k-treated tissue homogenates (n = 2). * indicates that low flow lesion genesis time was significantly different (p < 0.05, Student’s t-test) to high flow rate; ‡ indicates that the overall trend of desiccation under low vs high flow rate and with the addition of proteinase-k treated homogenate vs. low flow controls was significant (p < 0.05, log-rank test).
FIGURE 9
FIGURE 9
Rugosity of similarly sized specimens between wasting-affected and less wasting affected species as determined by whole animal computed tomography (top) and of an asteroid ray by micro-computed tomography (bottom). a,b denote significant difference at p < 0.001. More and less wasting affected assignment were based upon previous work and defined in the text.
FIGURE 10
FIGURE 10
Correspondence between mean time of wasting mass mortality (indicated by solid orange line (SE range indicated by lighter orange bar) compared with physico-chemical parameters (top), the mean number of days in which oxygen was < 50% saturation for ≥ 6 h at 1 and 7 m (middle) and mean chlorophyll a concentration (bottom) at Penn Cove, Whidbey Island from 2014 to 2019. Temp, temperature; DO, dissolved oxygen; Sal, salinity. Data was analyzed from the Penn Cove Shellfish data buoy (retrieved from http://nvs.nanoos.org).
FIGURE 11
FIGURE 11
Comparison of grossly normal and wasting δ15N values between species. ONP = Starfish point, Olympic national park and SC = Davenport, Santa Cruz, CA. * indicates p < 0.05. Numbers above box plots indicate n of specimens used in comparison.

References

    1. Aalto E. A., Lafferty K. D., Sokolow S. H., Grewelle R. E., Ben-Horin T., Boch C. A., et al. (2020). Models with environmental drivers offer a plausible mechanism for the rapid spread of infectious disease outbreaks in marine organisms. Sci. Rep. 10:5975. - PMC - PubMed
    1. Amir A., Mcdonald D., Navas-Molina J. A., Kopylova E., Morton J. T., Zech Xu Z., et al. (2017). Deblur rapidly resolves single-nucleotide community sequence patterns. mSystems 2:e00191-16. - PMC - PubMed
    1. Amon R. M. W., Benner R. (1996). Bacterial utilization of different size classes of dissolved organic matter. Limnol. Oceanogr. 41 41–51. 10.4319/lo.1996.41.1.0041 - DOI
    1. Aquino C. A., Besemer R. M., Derito C. M., Kocian J., Porter I. R., Raimondi P. T., et al. (2020). Evidence for boundary layer oxygen diffusion limitation as a key driver of asteroid wasting. bioRxiv [Preprint] 10.1101/2020.1107.1131.231365 - DOI
    1. Barott K. L., Rohwer F. L. (2012). Unseen players shape benthic competition on coral reefs. Trend Microbiol. 20 621–628. 10.1016/j.tim.2012.08.004 - DOI - PubMed