. 2021 Jan 2:2021:6613029.
doi: 10.1155/2021/6613029. eCollection 2021.

Combined Use of Chitosan and Olfactory Mucosa Mesenchymal Stem/Stromal Cells to Promote Peripheral Nerve Regeneration In Vivo

Affiliations

Combined Use of Chitosan and Olfactory Mucosa Mesenchymal Stem/Stromal Cells to Promote Peripheral Nerve Regeneration In Vivo

Rui D Alvites et al. Stem Cells Int. .

Abstract

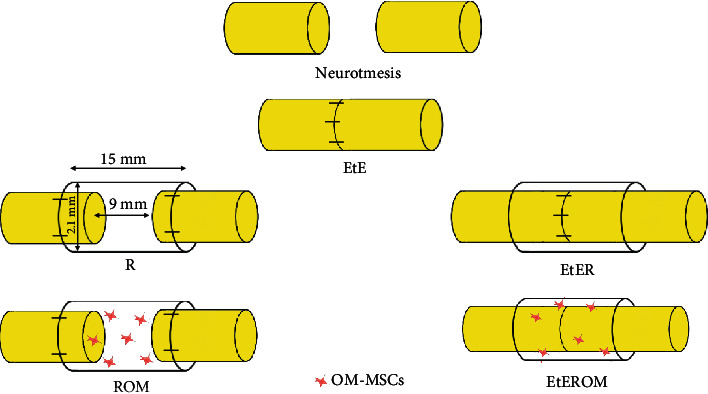
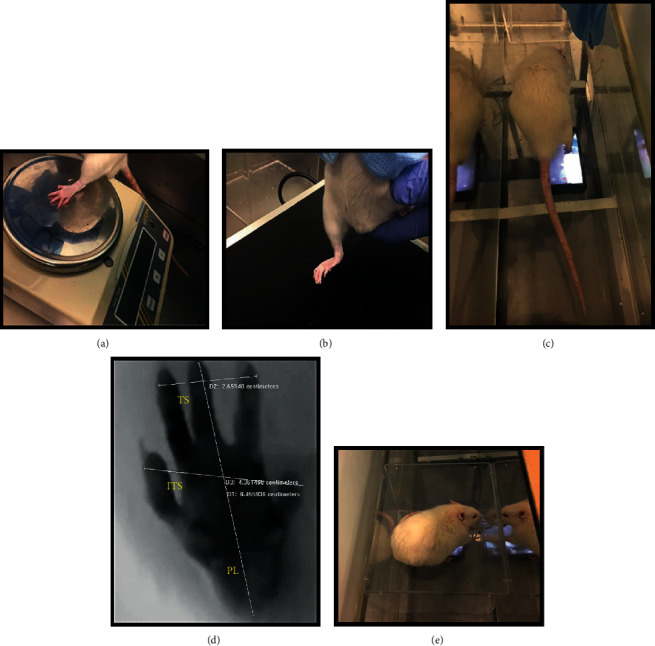
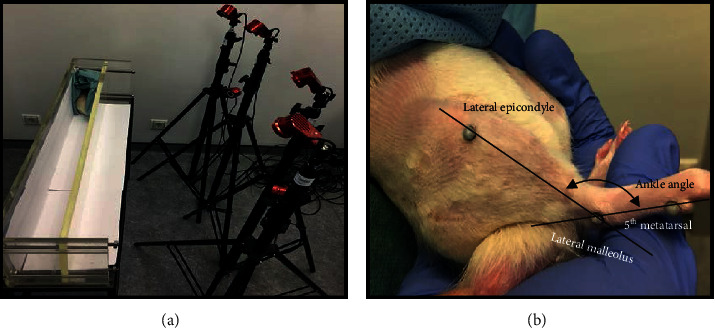
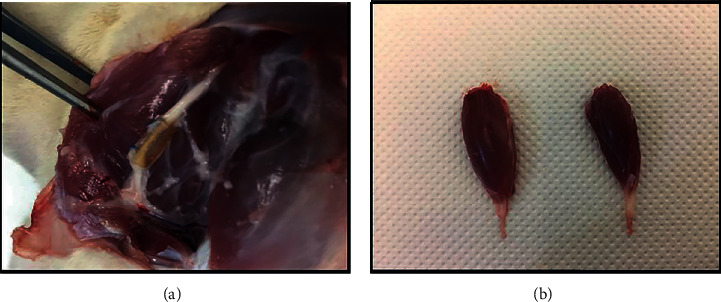
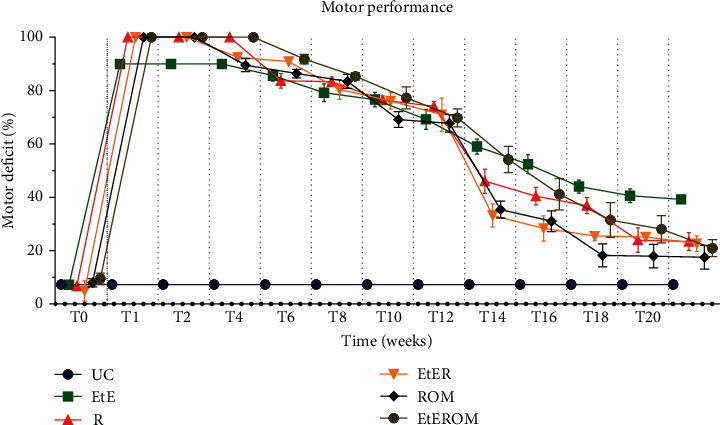
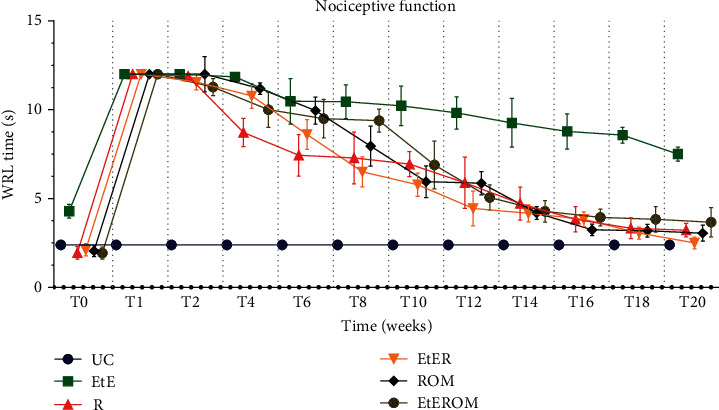
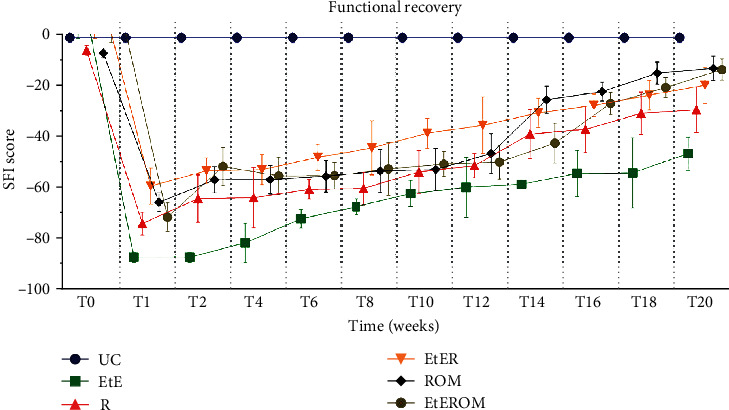
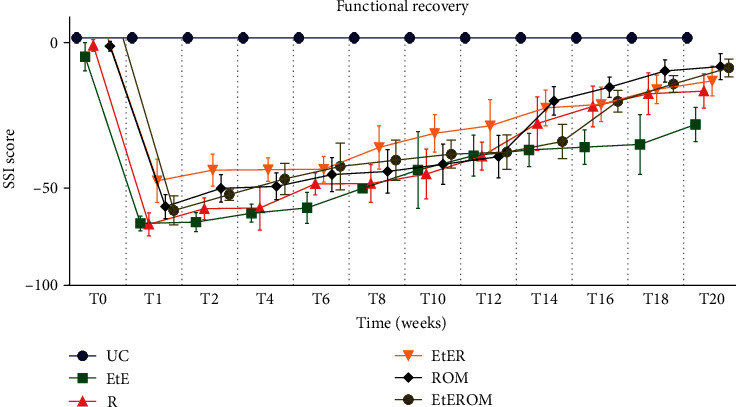
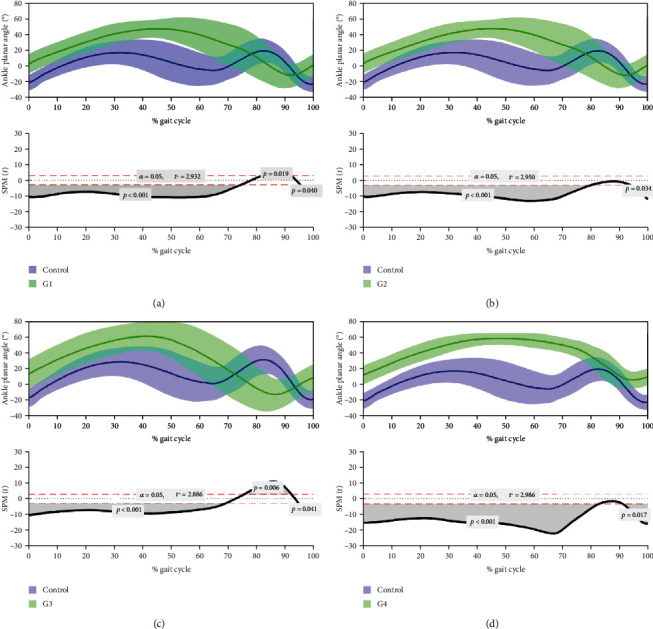
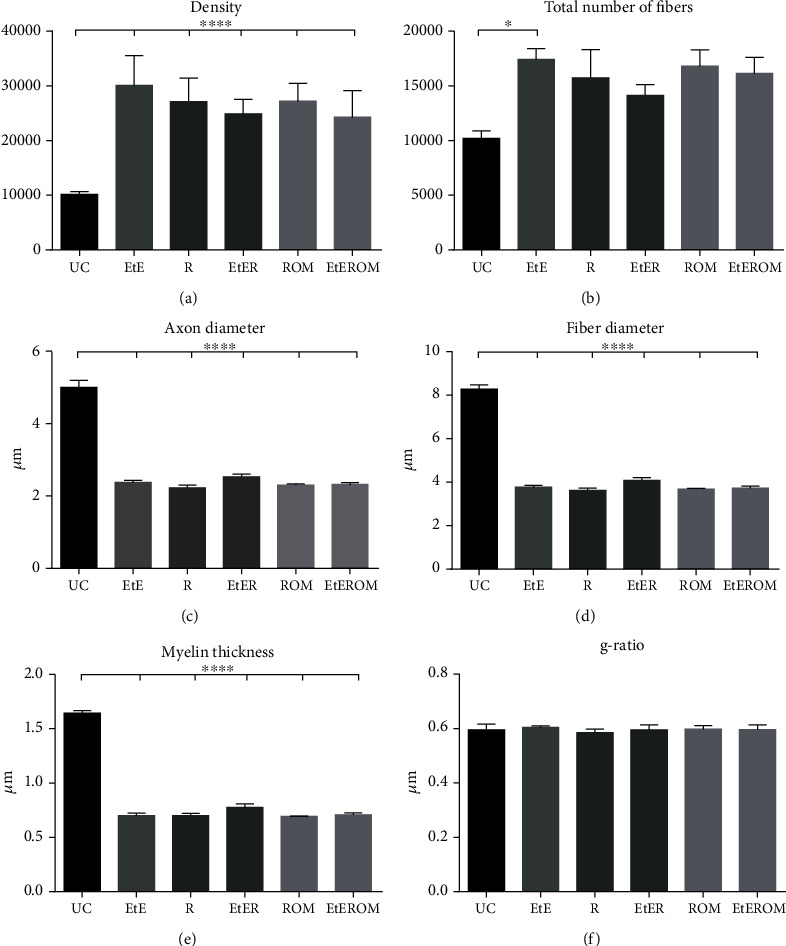
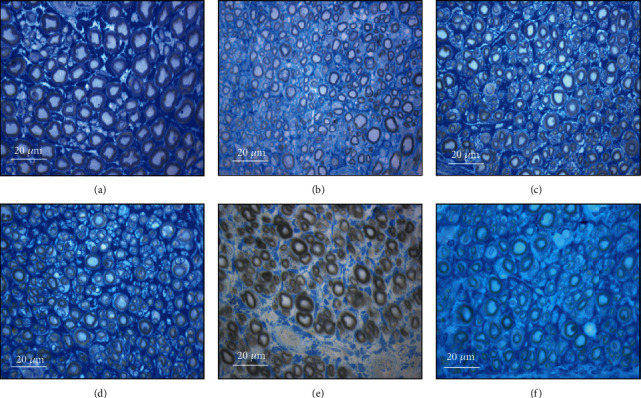
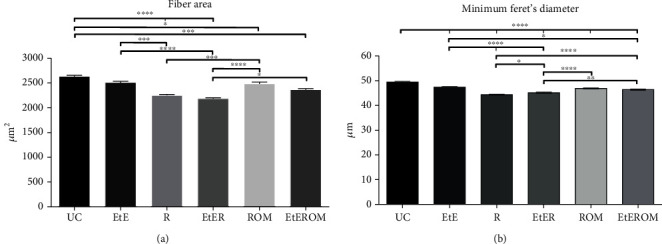
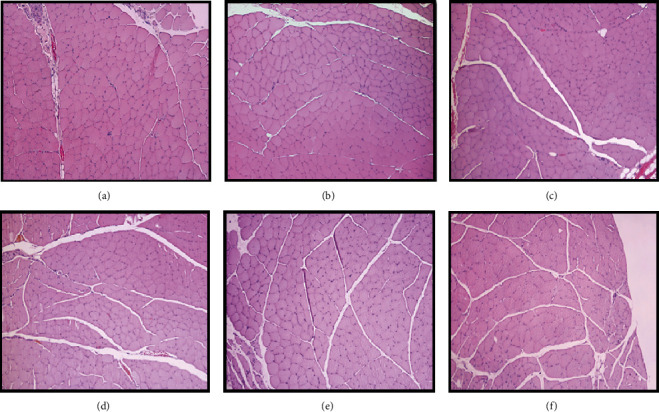
Peripheral nerve injury remains a clinical challenge with severe physiological and functional consequences. Despite the existence of multiple possible therapeutic approaches, until now, there is no consensus regarding the advantages of each option or the best methodology in promoting nerve regeneration. Regenerative medicine is a promise to overcome this medical limitation, and in this work, chitosan nerve guide conduits and olfactory mucosa mesenchymal stem/stromal cells were applied in different therapeutic combinations to promote regeneration in sciatic nerves after neurotmesis injury. Over 20 weeks, the intervened animals were subjected to a regular functional assessment (determination of motor performance, nociception, and sciatic indexes), and after this period, they were evaluated kinematically and the sciatic nerves and cranial tibial muscles were evaluated stereologically and histomorphometrically, respectively. The results obtained allowed confirming the beneficial effects of using these therapeutic approaches. The use of chitosan NGCs and cells resulted in better motor performance, better sciatic indexes, and lower gait dysfunction after 20 weeks. The use of only NGGs demonstrated better nociceptive recoveries. The stereological evaluation of the sciatic nerve revealed identical values in the different parameters for all therapeutic groups. In the muscle histomorphometric evaluation, the groups treated with NGCs and cells showed results close to those of the group that received traditional sutures, the one with the best final values. The therapeutic combinations studied show promising outcomes and should be the target of new future works to overcome some irregularities found in the results and establish the combination of nerve guidance conduits and olfactory mucosa mesenchymal stem/stromal cells as viable options in the treatment of peripheral nerves after injury.


Conflict of interest statement

The authors declare that there are no conflicts of interest regarding the publication of this article.

Figures

Figure 1
Figure 1
Experimental therapies applied to the sciatic nerve after neurotmesis injury. The applied NGCs are 15 mm long and have an internal diameter of 2.1 mm.
Figure 2
Figure 2
(a) Execution of the EPT test, with extension of the paw on the weighing machine to test motor performance. (b) Execution of the WRL test, with positioning of the right paw on the heating plate to test nociception. (c) Determination of the SFI with video recording of the animal's paw in contact with the acrylic corridor during gait. (d) Analysis of the animal's paw in contact with the acrylic corridor during gait, with determination of the PL, TS, and ITS values. (e) Determination of SSI with photographic record of the animal's paw in contact with the acrylic box. EPT: extended postural thrust; WRL: withdrawal reflex latency; SFI: sciatic functional index; SSI: static sciatic index; PL: print length; TS: toe spread; ITS: intermediate toe spread.
Figure 3
Figure 3
(a) Image capture set for kinematic analysis. At the end of the acrylic track, a shelter is placed to attract the animal, guaranteeing a straight line during locomotion. (b) Anatomical positions for placement of the reflective markers on the hind limb of the rat, with the respective ankle angle.
Figure 4
Figure 4
(a) Exposure of the sciatic nerve of the ROM therapeutic group, 20 weeks after surgery. It is possible to observe the regenerated nerve filling all the lumen of the NGC, with the two nerve tops connected. (b) Comparison of the mass of cranial tibial muscles of the healthy limb (left) and subject to neurotmesis (right) after collection at 20 weeks.
Figure 5
Figure 5
ΔCt values for the different genes under study in OM-MSCs undifferentiated and after neurogenic differentiation. Higher delta-CT values represent lower expression. Results are presented as mean ± SEM.
Figure 6
Figure 6
Immunolabeling of rat brain tissue (control) and of undifferentiated and differentiated OM-MSCs (P6). Magnifications: 100x (control) and 400x (OM-MSCs): (a) positive immunoexpression of the intermediate filaments of the astroglial cells; (b) (+) the black arrow highlights weak cytoplasm immunoreactivity; (c) (+++) the black arrow highlights strong cytoplasm immunoreactivity; (d) positive immunoexpression of neuronal nuclei; (e (0), f (+)) the black arrow highlights weak cytoplasm immunoreactivity; the grey arrow also highlights nuclear immunopositivity; (g) positive neuronal membrane and periplasmic immunoreactivity; (h (0), i (++)) the black arrow highlights moderate membranous immunoreactivity. The inserts highlight the immunoexpression of each marker.
Figure 7
Figure 7
Corrected absorbance of the different groups assessed by the PrestoBlue® viability assay, in different time points. Results are presented as mean ± SEM.
Figure 8
Figure 8
SEM images of the Reaxon® NGC and OM-MSCs: (a) Reaxon® NGC, magnification: 100x; (b) external surface of Reaxon® NGC, magnification: 100x; (c) inner surface of Reaxon® NGC, magnification: 500x; (d) OM-MSC adhered to the inner surface of the Reaxon® NGC, magnification: 2000x; (e) OM-MSCs adhered to the inner surface of the Reaxon® NGC, magnification: 5000x; (f) OM-MSC adhered to the inner surface of the Reaxon® NGC, magnification: 10000x.
Figure 9
Figure 9
SEM and EDS evaluation of the Reaxon® NGC and OM-MSCs: (a) OM-MSC cell layer adhered to the inner face of the Reaxon® NGC, magnification: 10000x; (b) EDS evaluation of the Z1 region-OM-MSCs; (c) EDS evaluation of the Z2 region-OM-MSC cell layer; (d) EDS evaluation of the Z3 region-inner surface of the Reaxon® NGC without a cell layer.
Figure 10
Figure 10
Values of motor deficit (%) over the 20 weeks of the recovery period. Results are presented as mean ± SEM.
Figure 11
Figure 11
WRL values (s) over the 20-week recovery period. Results are presented as mean ± SEM.
Figure 12
Figure 12
Functional assessment (SFI) over the 20-week recovery period. Results are presented as mean ± SEM.
Figure 13
Figure 13
Functional assessment (SSI) over the 20-week recovery period. Results are presented as mean ± SEM.
Figure 14
Figure 14
Kinematic evaluation of rats 20 weeks after neurotmesis: (a) R; (b) EtER; (c) ROM; (d) EtEROM. Upper graphs show the mean θ° during UC gait (blue) versus the pattern of experimental groups (green) at the level of the ankle joint. Lower graphs show SPM statistic as a function of the gait cycle. SPM unpaired t-tests were performed, comparing the mean kinematic angle of each pattern to the respective mean kinematic angle of UC (α = 0.05). The moments of the gait cycle in which the critical threshold (t) was exceeded (corresponding to the moment when the θ° of the experimental groups is superior to the θ° of UC) are represented by the grey area of the lower graphs. G1 = R; G2 = EtER; G3 = ROM; G4 = EtEROM; SPM: statistical parametric mapping.
Figure 15
Figure 15
Results of the stereological assessment of sciatic nerve fibers 20 weeks after neurotmesis: (a) density; (b) total number of fibers; (c) axon diameter; (d) fiber diameter; (e) myelin thickness; (f) g-ratio. Results are presented as mean ± SEM.
Figure 16
Figure 16
Light micrographs of toluidine blue-stained sciatic nerve semithin sections for the different groups: (a) UC; (b) EtE; (c) R; (d) EtER; (e) ROM; (f) EtEROM.
Figure 17
Figure 17
Histomorphometric analysis of cranial tibial muscle: (a) individual fiber area; (b) minimum Feret's diameter of the muscle fibers. Results are presented as mean ± SEM.
Figure 18
Figure 18
Histological images of the cranial tibial muscles subjected to histomorphometric analysis in the different groups: (a) UC; (b) EtE; (c) R; (d) EtER; (e) ROM; (f) EtEROM. H&E, magnifications: 100x.

References

    1. Hussain G., Wang J., Rasul A., et al. Current status of therapeutic approaches against peripheral nerve injuries: a detailed story from injury to recovery. International Journal of Biological Sciences. 2020;16(1):116–134. doi: 10.7150/ijbs.35653. - DOI - PMC - PubMed
    1. Kuffler D. P., Foy C. Restoration of neurological function following peripheral nerve trauma. International Journal of Molecular Sciences. 2020;21(5):p. 1808. doi: 10.3390/ijms21051808. - DOI - PMC - PubMed
    1. Wojtkiewicz D. M., Saunders J., Domeshek L., Novak C. B., Kaskutas V., Mackinnon S. E. Social impact of peripheral nerve injuries. Hand. 2014;10(2):161–167. doi: 10.1007/s11552-014-9692-0. - DOI - PMC - PubMed
    1. Alvites R. D., Branquinho M. V., Caseiro A. R., et al. Biomaterials and Cellular Systems at the Forefront of Peripheral Nerve Regeneration. Peripheral Nerves-Injuries, Disorders and Treatment: Intech Open; 2020.
    1. Seddon H. J. A classification of nerve injuries. British Medical Journal. 1942;2(4260):237–239. doi: 10.1136/bmj.2.4260.237. - DOI - PMC - PubMed