. 2021 Jan 2:2021:8869849.
doi: 10.1155/2021/8869849. eCollection 2021.

Apolipoprotein E Polymorphism and Oxidative Stress in Human Peripheral Blood Cells: Can Physical Activity Reactivate the Proteasome System through Epigenetic Mechanisms?

Affiliations

Apolipoprotein E Polymorphism and Oxidative Stress in Human Peripheral Blood Cells: Can Physical Activity Reactivate the Proteasome System through Epigenetic Mechanisms?

Rebecca Piccarducci et al. Oxid Med Cell Longev. .

Abstract

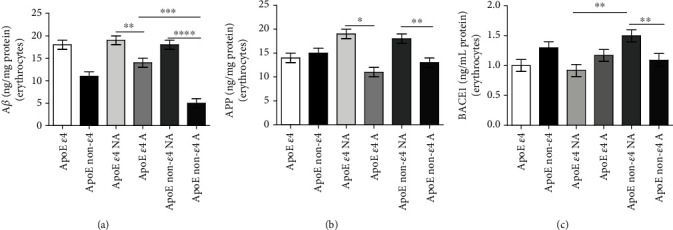
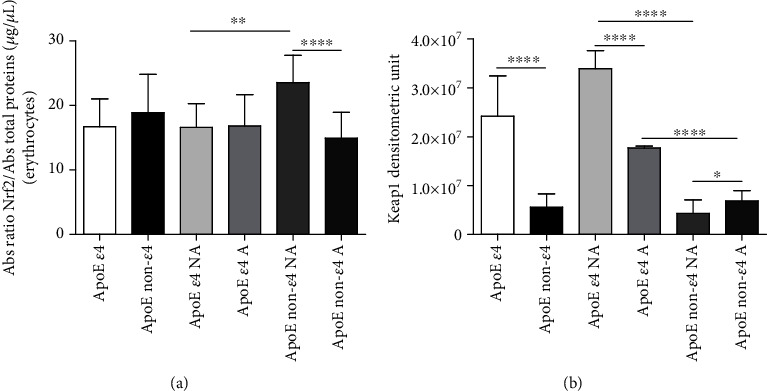
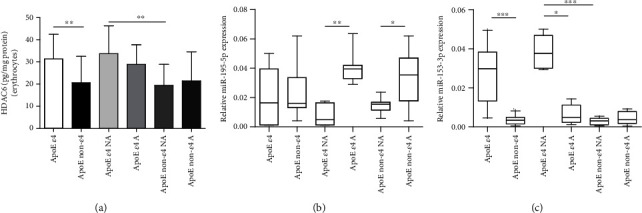
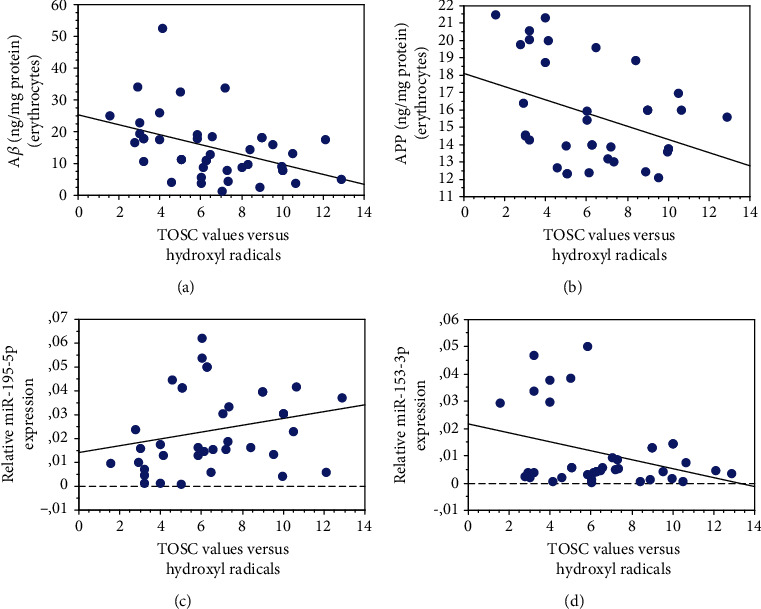
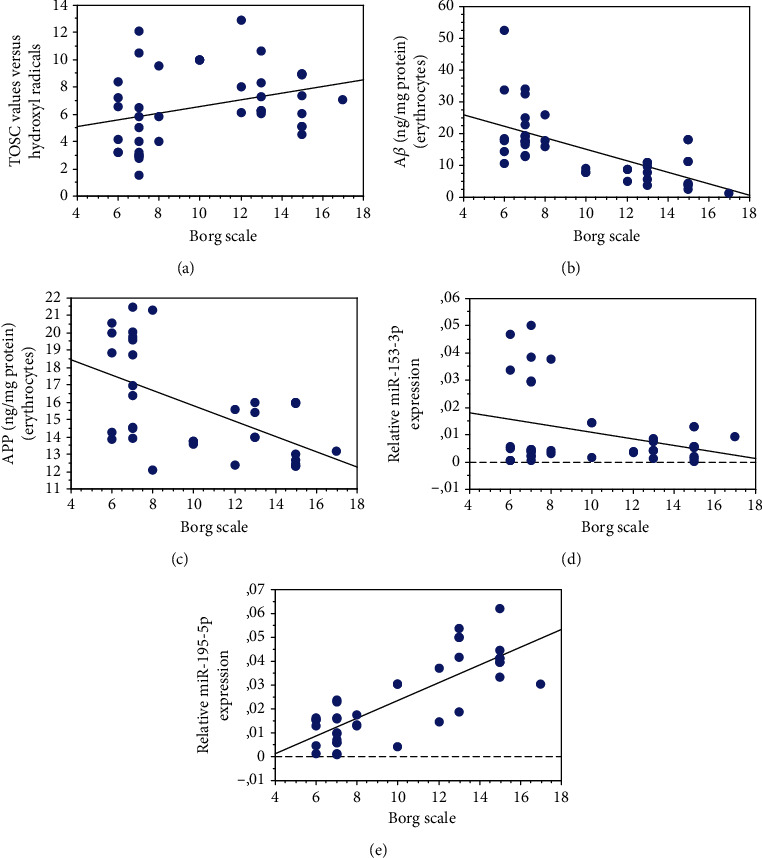
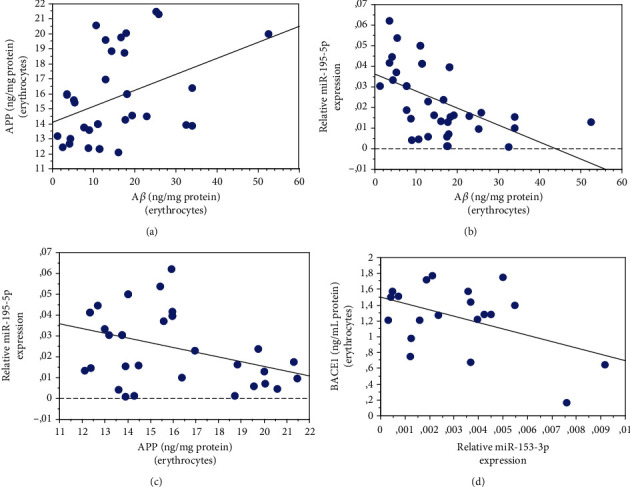
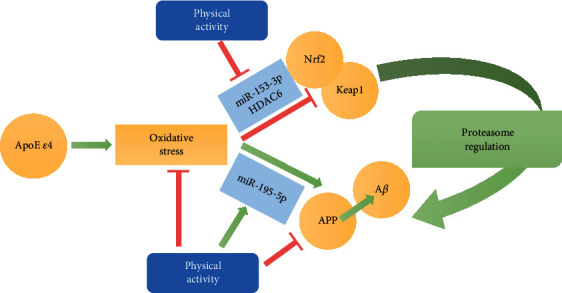
Alzheimer's disease (AD) is characterized by proteasome activity impairment, oxidative stress, and epigenetic changes, resulting in β-amyloid (Aβ) production/degradation imbalance. Apolipoprotein E (ApoE) is implicated in Aβ clearance, and particularly, the ApoE ε4 isoform predisposes to AD development. Regular physical activity is known to reduce AD progression. However, the impact of ApoE polymorphism and physical exercise on Aβ production and proteasome system activity has never been investigated in human peripheral blood cells, particularly in erythrocytes, an emerging peripheral model used to study biochemical alteration. Therefore, the influence of ApoE polymorphism on the antioxidant defences, amyloid accumulation, and proteasome activity was here evaluated in human peripheral blood cells depending on physical activity, to assess putative peripheral biomarkers for AD and candidate targets that could be modulated by lifestyle. Healthy subjects were enrolled and classified based on the ApoE polymorphism (by the restriction fragment length polymorphism technique) and physical activity level (Borg scale) and grouped into ApoE ε4/non-ε4 carriers and active/non-active subjects. The plasma antioxidant capability (AOC), the erythrocyte Aβ production/accumulation, and the nuclear factor erythroid 2-related factor 2 (Nrf2) mediated proteasome functionality were evaluated in all groups by the chromatographic and immunoenzymatic assay, respectively. Moreover, epigenetic mechanisms were investigated considering the expression of histone deacetylase 6, employing a competitive ELISA, and the modulation of two key miRNAs (miR-153-3p and miR-195-5p), through the miRNeasy Serum/Plasma Mini Kit. ApoE ε4 subjects showed a reduction in plasma AOC and an increase in the Nrf2 blocker, miR-153-3p, contributing to an enhancement of the erythrocyte concentration of Aβ. Physical exercise increased plasma AOC and reduced the amount of Aβ and its precursor, involving a reduced miR-153-3p expression and a miR-195-5p enhancement. Our data highlight the impact of the ApoE genotype on the amyloidogenic pathway and the proteasome system, suggesting the positive impact of physical exercise, also through epigenetic mechanisms.


Conflict of interest statement

The authors declare that there is no conflict of interest regarding the publication of this paper.

Figures

Figure 1
Figure 1
Plasma AOC levels detected by the TOSC assay. The plasma AOC towards hydroxyl radicals was detected by the TOSC assay, as described in Materials and Methods: high TOSC values are associated with elevated antioxidant capacity. The data are shown as the mean value ± SD and are representative of three independent experiments (n = 3). P values were adjusted with the unpaired t-test: ∗∗∗∗P < 0.0001 between the indicated subgroups. GraphPad Prism 7 was used to create the figure.
Figure 2
Figure 2
Erythrocyte Aβ, APP, and BACE1 accumulation measured by using a sandwich ELISA kit. The whole blood was collected by volunteers, and erythrocytes were isolated through sequential centrifugations, as described in Materials and Methods. A sandwich ELISA kit was employed to measure the erythrocyte concentration of Aβ (a), APP (b), and BACE1 (c). The data are shown as the median value with range and are representative of three independent experiments (n = 3). P values were adjusted with the unpaired t-test: P < 0.05, ∗∗P < 0.01, ∗∗∗P < 0.001, and ∗∗∗∗P < 0.0001 between the indicated subgroups. GraphPad Prism 7 was used to create the figure.
Figure 3
Figure 3
Erythrocyte Nrf2 and plasma Keap1 quantified by the transcription factor assay and western blot analysis, respectively. (a) Nrf2 was measured in erythrocytes, isolated from the whole blood of healthy volunteers, through a high-throughput assay that combines quick ELISA with a sensitive and specific nonradioactive one for transcription factor activation. By this kind of assay, only the activated Nrf2 is detected (Materials and Methods). (b) Plasma collected from healthy volunteers was considered to identify the presence of the Keap1 through western blot analysis that is shown as the densitometric unit of the bands (Materials and Methods). The data are shown as the mean value ± SD and are representative of three independent experiments (n = 3). P values were adjusted with the unpaired t-test: P < 0.05, ∗∗P < 0.01, and ∗∗∗∗P < 0.0001 between the indicated subgroups. GraphPad Prism 7 was used to create the figure.
Figure 4
Figure 4
Erythrocyte HDAC6 concentration quantified by using a competitive ELISA kit and circulating expression of miR-195-5p and miR-153-3p. (a) HDAC6 was quantified in erythrocytes, isolated from the whole blood of the total cohort, employing a competitive ELISA kit (Materials and Methods). The data are shown as the mean value ± SD and are representative of three independent experiments (n = 3). P values were adjusted with the unpaired t-test: ∗∗P < 0.01 between the indicated subgroups. The expression of miR-195-5p (b) and miR-153-3p (c) was analysed in plasma samples of non-active and active subjects, classified based on ApoE ε4 polymorphism. The analysis was performed through the miRNeasy Serum/Plasma Mini Kit, as described in Materials and Methods. The relative expression was calculated by the Ct method and normalized on miR-93-5p. Statistical analysis was performed by Kruskal-Wallis (nonparametric) followed by Dunn's multiple comparison test. P < 0.05, ∗∗P < 0.01, and ∗∗∗P < 0.001 between the indicated subgroups. GraphPad Prism 7 was used to create the figure.
Figure 5
Figure 5
Correlation of erythrocyte and plasma parameters with AOC expressed as TOSC values versus hydroxyl radicals. Correlation analysis between Aβ (a), APP (b), miR-195-5p (c), and miR-153-3p (d) with plasma AOC. Correlation between variables was determined by simple linear regression analysis, using the StatView program (Abacus Concepts, Inc., SAS Institute, Cary, NC). P and R2 values obtained for each correlation are reported in the respective panel.
Figure 6
Figure 6
Correlation of plasma and erythrocyte parameters with the physical activity level expressed as the Borg scale. Correlation analysis between AOC (a), Aβ (b), APP (c), miR-153-3p (d), and miR-195-5p (e) with physical activity. Correlation between variables was determined by simple linear regression analysis, using the StatView program (Abacus Concepts, Inc., SAS Institute, Cary, NC). P and R2 values obtained for each correlation are reported in the respective panel.
Figure 7
Figure 7
Correlation of erythrocyte and plasma parameters with erythrocyte Aβ accumulation. Correlation analysis between erythrocyte Aβ and APP (a) and plasma miR-195-5p (b). Correlation analysis between erythrocyte APP and plasma miR-195-5p (c). Correlation analysis between erythrocyte BACE1 concentrations and plasma miR-153-3p (d). Correlation between variables was determined by simple linear regression analysis, using the StatView program (Abacus Concepts, Inc., SAS Institute, Cary, NC). P and R2 values obtained for each correlation are reported in the respective panel.
Figure 8
Figure 8
Influence of ApoE ε4 polymorphism and physical activity in the pathways of the proteasome system. The presence of ApoE ε4 polymorphism was associated with an elevated concentration of the proteasome-related Keap1, which inhibited Nfr2 and impaired the proteasome system. These events lead to an enhancement of Aβ and miR-153-3p, as well as to minor plasma AOC. Aside from ApoE polymorphism, regular physical exercise reduced oxidative stress, by increasing the plasma antioxidant capability, and blocked the pathway of Aβ production/accumulation. Physical exercise can also regulate the epigenetic mechanisms involved in the Nrf2-Keap1 axis and Aβ production by reducing miR-153-3p and HDAC6 and enhancing miR-195-5p expression.

Similar articles

Cited by

References

    1. Ramasamy I. Recent advances in physiological lipoprotein metabolism. Clinical Chemistry and Laboratory Medicine. 2014;52(12):1695–1727. doi: 10.1515/cclm-2013-0358. - DOI - PubMed
    1. Mahley R. W., Weisgraber K. H., Huang Y. Apolipoprotein E: structure determines function, from atherosclerosis to Alzheimer’s disease to AIDS. Journal of Lipid Research. 2009;50(Supplement):S183–S188. doi: 10.1194/jlr.R800069-JLR200. - DOI - PMC - PubMed
    1. Baars H. F., Doevendans P. A. F. M., van der Smagt J. J. Clinical Cardiogenetics. London: Springer-Verlag; 2011. - DOI
    1. Giau V. V., Bagyinszky E., An S. S. A., Kim S. Y. Role of apolipoprotein E in neurodegenerative diseases. Neuropsychiatric Disease and Treatment. 2015;11:1723–1737. doi: 10.2147/NDT.S84266. - DOI - PMC - PubMed
    1. Liu C.-C., Liu C.-C., Kanekiyo T., Xu H., Bu G. Apolipoprotein E and Alzheimer disease: risk, mechanisms and therapy. Nature Reviews. Neurology. 2013;9(2):106–118. doi: 10.1038/nrneurol.2012.263. - DOI - PMC - PubMed