. 2020 Dec;10(2):e12044.
doi: 10.1002/jev2.12044. Epub 2021 Jan 15.

Comprehensive evaluation of methods for small extracellular vesicles separation from human plasma, urine and cell culture medium

Affiliations

Comprehensive evaluation of methods for small extracellular vesicles separation from human plasma, urine and cell culture medium

Liang Dong et al. J Extracell Vesicles. 2020 Dec.

Abstract

One of the challenges that restricts the evolving extracellular vesicle (EV) research field is the lack of a consensus method for EV separation. This may also explain the diversity of the experimental results, as co-separated soluble proteins and lipoproteins may impede the interpretation of experimental findings. In this study, we comprehensively evaluated the EV yields and sample purities of three most popular EV separation methods, ultracentrifugation, precipitation and size exclusion chromatography combined with ultrafiltration, along with a microfluidic tangential flow filtration device, Exodisc, in three commonly used biological samples, cell culture medium, human urine and plasma. Single EV phenotyping and density-gradient ultracentrifugation were used to understand the proportion of true EVs in particle separations. Our findings suggest Exodisc has the best EV yield though it may co-separate contaminants when the non-EV particle levels are high in input materials. We found no 100% pure EV preparations due to the overlap of their size and density with many non-EV particles in biofluids. Precipitation has the lowest sample purity, regardless of sample type. The purities of the other techniques may vary in different sample types and are largely dependent on their working principles and the intrinsic composition of the input sample. Researchers should choose the proper separation method according to the sample type, downstream analysis and their working scenarios.

Keywords: EV yield; methods comparison; sample purity; single particle phenotyping; small extracellular vesicle separation.


Conflict of interest statement

UNIST has filed patents on Exodisc and YKC is named as an inventor, which are licensed to LabSpinner, Inc.

Figures

FIGURE 1
FIGURE 1
Concentrations of particles separated by different methods from CCM, urine and plasma, measured by NTA (a)‐(c) and nFCM (d)‐(f). The particle concentrations have been corrected for sample input volumes. (a) and (d) Particle concentrations of CCM EV preparations; (b) and (e) Particle concentrations of urine EV preparations; (c) and (f) Particle concentrations of plasma EV preparations. The error bars represented the standard deviation of five repetitive experiments. *P < 0.05, **P < 0.01, one‐way ANOVA analysis with Tukey multiple comparison test as well as a variance‐covariance model
FIGURE 2
FIGURE 2
Particle size distributions of EV preparations separated by different methods from CCM, urine and plasma, measured by NTA. The concentration of particles in each bin of size was recorded. The bin width was 1.0 nm. In order to make the size distribution histogram visually comparable, the Y axis was adjusted to make the concentration of particles with modal size (the peak of the curve) as 95% of maximum scale in each figure. (a) Particle size distributions of CCM EV preparations; (b) Particle size distributions of urine EV preparations; (c) Particle size distributions of plasma EV preparations
FIGURE 3
FIGURE 3
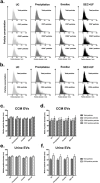
Particle size distributions of EV preparations separated by different methods from CCM, urine and plasma, measured by nFCM. The bin width was 0.5 nm. In order to make the size distribution histogram visually comparable, the Y axis was adjusted to make the concentration of particles with modal size (the peak of the curve) as 95% of maximum scale in each figure. (a) Particle size distributions of CCM EV preparations; (b) Particle size distributions of urine EV preparations; (c) Particle size distributions of plasma EV preparations
FIGURE 4
FIGURE 4
EV yield and purity evaluated by spiking experiment. (a) Schematic diagram of the experiment design. (b) The recovery rates of different separation methods in different contaminating protein concentration groups. The error bars represented the standard deviation of three repetitive experiments. (c) The co‐separated protein amounts in post‐separation samples by different separation methods in different contaminating protein concentration groups. The error bars represented the standard deviation of three repetitive experiments. (d) Particle size distribution histogram (top), SSC intensity plot (middle) and FITC intensity plot (bottom) of post‐separation sample by Exodisc when the protein concentration of pre‐separation sample is 5 mg/ ml. (e) Particle size distribution histogram (top), SSC intensity plot (middle) and FITC intensity plot (bottom) of post‐separation sample by Exodisc when the protein concentration of pre‐separation sample is 25 mg/ml. (f) Particle size distribution histogram (top), SSC intensity plot (middle) and FITC intensity plot (bottom) of post‐separation sample by Exodisc when the protein concentration of pre‐separation sample is 50 mg/ml. (g) Size distributions of recovered MVP‐GFP by different methods. In order to make the size distribution histogram visually comparable, the Y axis was adjusted to make the concentration of particles with modal size (the peak of the curve) as 95% of maximum scale in each figure
FIGURE 5
FIGURE 5
TEM images confirmed presence of negative‐stained EVs, seen as cup‐shaped vesicles. Representative image of (a) CCM EV preparations, (b) urine EV preparations, (c) plasma EV preparations separated by different methods. Scale bar represented 500 nm in figures with low magnifications on the left side and 100 nm in figures with high magnifications on the right side in each sample. Black arrows pointed out particles with a morphology that meets the criteria of EV
FIGURE 6
FIGURE 6
Purity of EV samples assessed by particle/protein ratio and Western blotting. (a)‐(c) The protein concentrations of EV preparations separated by different methods from CCM, urine and plasma. The protein concentrations have been corrected for initial sample input volume. (d)‐(f) The particle/protein ratios of EV preparations separated by different methods from CCM, urine and plasma. The particle numbers were measured by nFCM. The error bars represented the standard deviation of three repetitive experiments. *P < 0.05, **P < 0.01, one‐way ANOVA analysis with Tukey multiple comparison test as well as a variance‐covariance model. (g) Western blots of flotillin‐1, CD63, CD81, and calnexin for EV preparations separated from CCM by different methods. 9 μg of protein from each EV preparation was loaded. (h) Western blots of flotillin‐1, CD63, CD81, THP and calnexin for EV preparations separated from urine by different methods. 3.3 μg of protein from each EV preparation was loaded. (i) Western blots of flotillin‐1, CD81, APOA1 and calnexin for EV preparations separated from plasma by different methods. 25 μg of protein from each EV preparation was loaded. MCF7 membrane and cytosolic protein fractions served as positive and negative controls for flotillin‐1, CD63, CD81 and calnexin. Whole urine sample was used as positive control and MCF7 cellular fractions as negative control for THP. Recombinant human Apolipoprotein A1 served as positive control for APOA1.GAPDH staining was to show proper loading and running of the cytosolic MCF7 fraction
FIGURE 7
FIGURE 7
Purity of EV samples assessed by single particle phenotyping using nFCM. (a) Schematic diagram of how expression of CD9, CD63 and CD81 on EVs were measured by immunofluorescent labelling using nFCM. (b) Representative bivariate dot‐plots of PE fluorescence versus SSC for isotype control staining and CD9 antibody staining. The IgG isotype control was stained for each sample to identify background and non‐specific labelling, thus, setting the threshold. nFCM will record the number of total particles that were counted, as well as the number of particles above the threshold (positive particles). (d)‐(f) Measured positive percentages of tetraspanin‐positive particles in EV preparations from CCM, urine and plasma separated by different methods. The error bars represented the standard deviation of three repetitive experiments. *P < 0.05, **P < 0.01, one‐way ANOVA analysis with Tukey multiple comparison test as well as a variance‐covariance model
FIGURE 8
FIGURE 8
Particle size distributions of the whole EV preparations and tetraspanin‐positive particles from CCM (a) and urine (b) separated by different methods, measured by nFCM. Since at least 1000 tested particles are required for reliable size distribution, only CD9+/CD63+/CD81+ particles in CCM and CD9+ particles in urine were included for analysis. (c) and (d) Median and modal particle sizes of the whole EV preparations and CD9+/CD63+/CD81+ particles from CCM separated by different methods. (e) and (f) Median and modal particle sizes of the whole EV preparations and CD9+ particles from urine separated by different methods. The error bars represented the standard deviation of three repetitive experiments
FIGURE 9
FIGURE 9
Composition analysis of EV preparations DGUC. (a) Western blots of flotillin‐1 and CD81 for different fractions (n = 8) separated from 8 ml of plasma by UC, followed by DGUC fractionation. The same volume of each fraction was loaded regardless of their protein amount. (b) Schematic diagram of the study design and representative TEM images of each density fraction group. Non‐EV particles, like lipids and lipoproteins, were found in low‐density fractions, cup‐shaped EVs were seen in the middle fraction and protein aggregates and other particles were observed in high‐density fractions. Scale bar represented 100 nm. (c)‐(e) Proportions of fraction groups with different densities in EV preparations from CCM, urine and plasma separated by different methods. (f)‐(h) The particle concentration of each fraction group in EV preparations from CCM, urine and plasma separated by different methods. The particle numbers were measured by nFCM. The particle concentrations have been corrected for sample input volumes. The error bars represented the standard deviation of three repetitive experiments
FIGURE 10
FIGURE 10
The decision tree on how to select the proper EV separation method based on the input sample. Each diamond box stands for a decision‐making point. For CCM, the first question to consider is the priority between purity and EV yield because the two methods with good sample purity have suboptimal EV yield, while the two have high EV yield can't provide good purity. The sample volume is not a decision‐making point for CCM because for urine and plasma, we usually can't control the volume of the sample, especially in the clinical setting, but for CCM, the volume depends on the need and cell type, which is controllable. For urine and plasma, the volume cutoffs are rough estimations for practice. For example, each Exodisc has six chambers and in each, about 10 ml of urine samples can be processed (depending on the concentration of the urine). The biggest concentrator described in this study can pre‐concentrate up to 70 ml of urine for SEC+UF each time and each SEC column used in this study can load up to 0.5 ml of sample. That doesn't necessarily mean it is impossible to use a certain method with an out‐of‐range input volume. It will just cost more time and materials. The precipitation is not considered as an option for urine, nor are precipitation and Exodisc for plasma, because the sample purity may be too low for any downstream work to have reliable findings

References

    1. Baranyai, T. , Herczeg, K. , Onódi, Z. , Voszka, I. , Módos, K. , Marton, N. , … Pálinkás, Z. (2015). Isolation of exosomes from blood plasma: qualitative and quantitative comparison of ultracentrifugation and size exclusion chromatography methods. PloS One, 10(12), e0145686. - PMC - PubMed
    1. Becker, A. , Thakur, B. K. , Weiss, J. M. , Kim, H. S. , Peinado, H. , & Lyden, D. (2016). Extracellular vesicles in cancer: cell‐to‐cell mediators of metastasis. Cancer Cell, 30(6), 836–848. - PMC - PubMed
    1. Benedikter, B. J. , Bouwman, F. G. , Vajen, T. , Heinzmann, A. C. , Grauls, G. , Mariman, E. C. , … Rohde, G. G. (2017). Ultrafiltration combined with size exclusion chromatography efficiently isolates extracellular vesicles from cell culture media for compositional and functional studies. Scientific Reports, 7(1), 1–3. - PMC - PubMed
    1. Buschmann, D. , Kirchner, B. , Hermann, S. , Märte, M. , Wurmser, C. , Brandes, F. , … Schelling, G. (2018). Evaluation of serum extracellular vesicle isolation methods for profiling miRNAs by next‐generation sequencing. Journal of Extracellular Vesicles, 7(1), 1481321. - PMC - PubMed
    1. Chevillet, J. R. , Kang, Q. , Ruf, I. K. , Briggs, H. A. , Vojtech, L. N. , Hughes, S. M. , … Pogosova‐Agadjanyan, E. L. (2014). Quantitative and stoichiometric analysis of the microRNA content of exosomes. Proceedings of the National Academy of Sciences, 111(41), 14888–14893. - PMC - PubMed

Publication types