. 2020 Dec 26;24(1):101991.
doi: 10.1016/j.isci.2020.101991. eCollection 2021 Jan 22.

Phenotypically supervised single-cell sequencing parses within-cell-type heterogeneity

Affiliations

Phenotypically supervised single-cell sequencing parses within-cell-type heterogeneity

Kevin Chen et al. iScience. .

Abstract

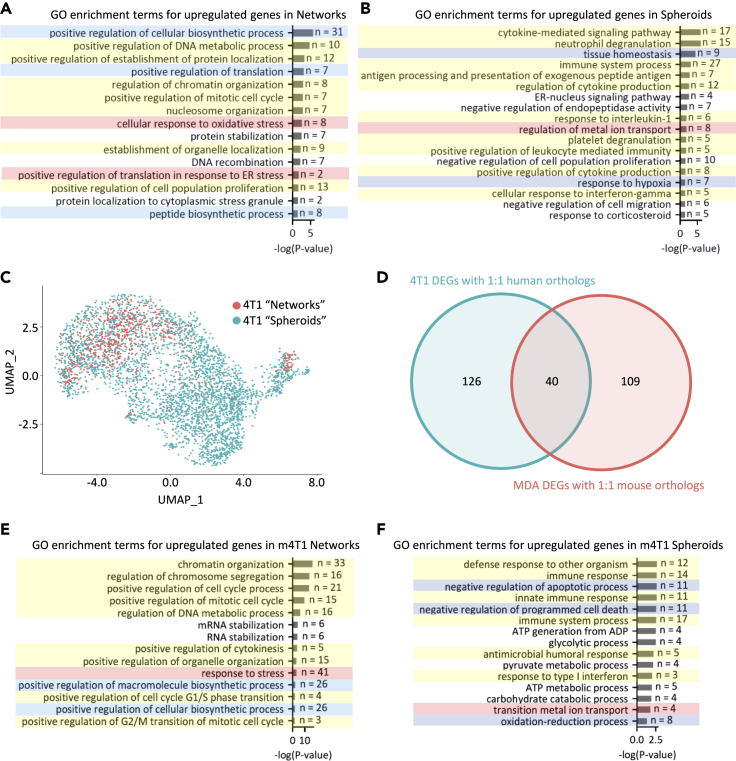
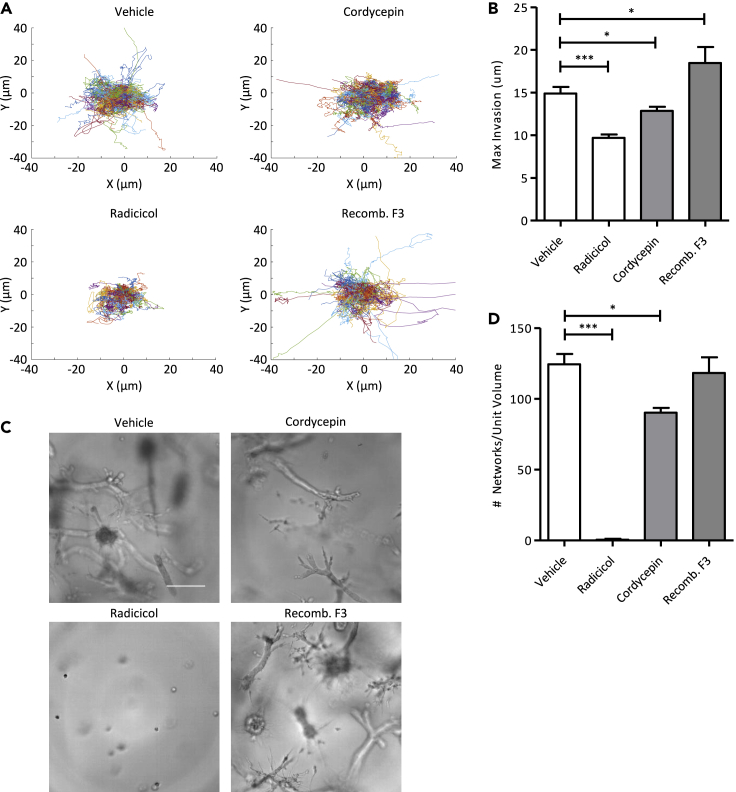
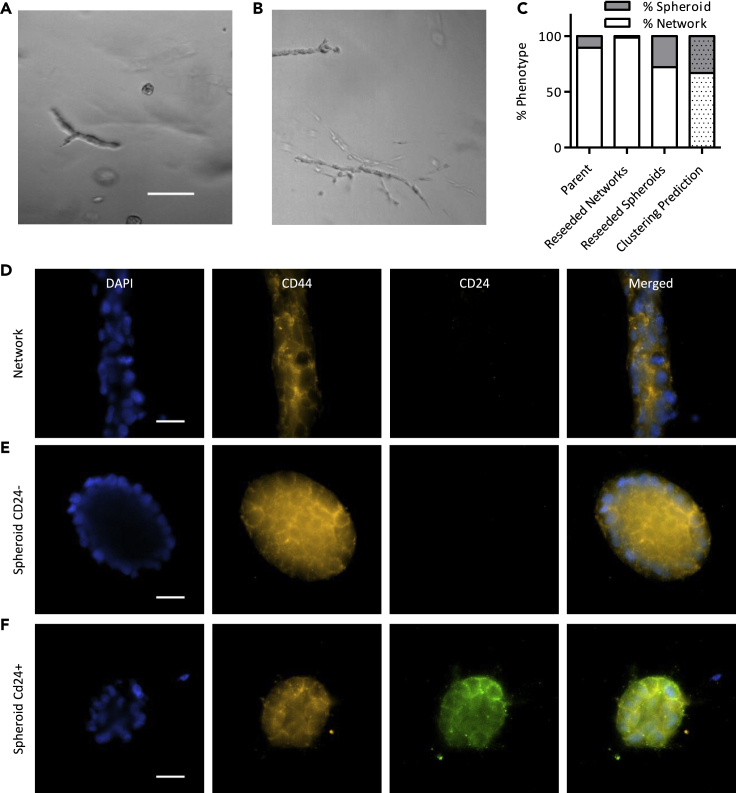
To better understand cellular communication driving diverse behaviors, we need to uncover the molecular mechanisms of within-cell-type functional heterogeneity. While single-cell RNA sequencing (scRNAseq) has advanced our understanding of cell heterogeneity, linking individual cell phenotypes to transcriptomic data remains challenging. Here, we used a phenotypic cell sorting technique to ask whether phenotypically supervised scRNAseq analysis (pheno-scRNAseq) can provide more insight into heterogeneous cell behaviors than unsupervised scRNAseq. Using a simple 3D in vitro breast cancer (BRCA) model, we conducted pheno-scRNAseq on invasive and non-invasive cells and compared the results to phenotype-agnostic scRNAseq analysis. Pheno-scRNAseq identified unique and more selective differentially expressed genes than unsupervised scRNAseq analysis. Functional studies validated the utility of pheno-scRNAseq in understanding within-cell-type functional heterogeneity and revealed that migration phenotypes were coordinated with specific metabolic, proliferation, stress, and immune phenotypes. This approach lends new insight into the molecular systems underlying BRCA cell phenotypic heterogeneity.

Keywords: Cell Biology; Complex System Biology; Transcriptomics.


Conflict of interest statement

The authors declare no competing interests.

Figures

None
Graphical abstract
Figure 1
Figure 1
BRCA cells exhibit heterogeneous migration phenotypes (A) Representative brightfield image of MDA-MB-231 cells cultured in a 3D COL1 matrix after 7 days of culture. Scale bar, 200 μm. (B and C) (B) Confocal z-slice of the network and (C) spheroid phenotypes. Scale bar, 100 μm. (D) Quantification of the circularity of heterogeneous collective phenotypes (n = 25). (E) Similar phenotypes are observed in 4T1 cells cultured in 3D type I collagen. (F and G) Time-lapse microscopy depicting the different patterns of growth and morphogenesis of two structurally distinct multicellular phenotypes. (F) Single cells that eventually develop into networks display growth and migration that lead to eventual fusion into a multicellular network. (G) Single cells that eventually develop into spherical structures display localized growth and development with continual maintenance of the spherical shape. Scale bar, 50 μm. (H) Quantification of the invasion of cells into the local extracellular matrix (ECM) depending on their collective phenotype (n = 13). (I) Maximum invasion of each phenotype from the initial seeding point after 60 hr of culture (n = 13). (J and K) Representative immunofluorescence z-slice images of networks (J) and spheroids (K) stained for COL4A1 and LAM5. Scale bar is 20 μm. Data are represented as mean ± standard error of the mean (SEM). Statistical significance was determined by the Student's t-test and is indicated as ∗, ∗∗, and ∗∗∗ for p ≤ 0.05, p ≤ 0.01, and p ≤ 0.001, respectively.
Figure 2
Figure 2
Phenotypic cell sorting improves transcriptome-phenotype coupling (A) Schematic overview of our workflow for phenotypic cell sorting. MDA-Dendra cells are cultured in type I collagen, photoconverted, released from the matrix, and sorted based on red fluorescence for immediate scRNAseq or other downstream experiments. (B) Images of multicellular MDA-Dendra structures before photoconversion (left) and after photoconversion (right). Scale bar, 100 μm. (C) Fluorescent profile of a control gel, where no cells were photoconverted. (D) Fluorescent profile of cells released from a gel after photoconversion. A fraction of cells exhibits greater red fluorescence compared to the control. (E) A UMAP plot generated from the pooled transcriptomic signatures of the cells isolated by phenotypic cell sorting. (F) Clusters identified based on unsupervised clustering methods. (G) Clusters labeled by phenotype. (H and I) Comparison of cells labeled by photoconversion (H) with non-photoconverted cells (I) that were scored by the metagene derived from the differentially expressed genes of the labeled cells. Data were corrected for batch effects and sequencing depth prior to UMAP projection.
Figure 3
Figure 3
Biological processes that differentiate collective cell phenotypes are conserved (A) Highlighted significant GO enrichment terms based on the list of upregulated genes in the network cell population. (B) Highlighted significant GO enrichment terms based on the list of upregulated genes in the spheroid cell population. (C) UMAP of 4T1 mouse cells, labeled after scoring with the metagene derived from the DEGs between the MDA network and spheroid cells. (D) Overlap between the 4T1 DEGs between labeled networks and spheroids with 1:1 human orthologs and the MDA DEGs between the MDA networks and spheroids with 1:1 mouse orthologs. (E) Highlighted significant GO enrichment terms based on the list of upregulated genes in the labeled 4T1 network cell population. Similarly colored highlights between (A) and (E) denote similarly themed processes that were enriched. (F) Highlighted significant GO enrichment terms based on the list of upregulated genes in the labeled 4T1 spheroid cell population. Similarly colored highlights between (B) and (F) denote similarly themed processes that were enriched.
Figure 4
Figure 4
Invasive network cells are more proliferative (A) A heatmap of the list of genes detected by phenotypically guided DE analysis that are in the GO:0008285 term. Spheroids display upregulation of genes associated with “negative regulation of cell population proliferation”. (B and C) Immunofluorescent staining of Ki-67 in the network cell population. Scale bar, 50 μm. (C) Some network structures display Ki-67 staining at the tips of the structures. (D) Immunofluorescent staining of Ki-67 in the spheroid cell population. Many spheroids displayed no staining. Scale bar, 50 μm. (E) Quantification of the percentage of cells in each collective phenotype that stained positively for Ki-67 (n = 36). (F) Quantification of the percent of networks that had a tip cell which stained positively for Ki-67 (n = 36). (G and H) Brightfield and fluorescence images after treatment with paclitaxel of spheroids (G) and networks (H). Scale bar is 20 μm. (I) Quantification of cell death after treatment with paclitaxel (n = 13). Spheroids show a statistically significant decrease in sensitivity compared to networks. Data are represented as mean ± standard error of the mean (SEM). For (E) and (F), statistical significance was determined by the Student's t-test and is indicated as ∗, ∗∗, and ∗∗∗ for p ≤ 0.05, p ≤ 0.01, and p ≤ 0.001, respectively. For (I), statistical significance was determined by analysis of variance (ANOVA) followed by post-hoc analyses (Tukey) and is indicated as ∗, ∗∗, and ∗∗∗ for p ≤ 0.05, p ≤ 0.01, and p ≤ 0.001, respectively.
Figure 5
Figure 5
Spheroid cells display proper antigen localization (A) A heatmap of the list of genes detected by phenotypically guided DE analysis that are in the GO:0002376 term. Spheroids display upregulation of genes associated with “immune system process”. (B) Immunofluorescent staining of HLA-A in the spheroid cell population. Spheroid cells display membrane localization of HLA-A. Scale bar, 50 μm. (C) Immunofluorescent staining of HLA-A in the network cell population. Many network cells display perinuclear staining of HLA-A. Scale bar, 50 μm. (D) Quantification of the perinuclear staining of HLA-A within each collective phenotype (n = 8). Data are represented as mean ± standard error of the mean (SEM). Statistical significance was determined by the Student's t-test and is indicated as ∗, ∗∗, and ∗∗∗ for p ≤ 0.05, p ≤ 0.01, and p ≤ 0.001, respectively.
Figure 6
Figure 6
Inhibition of upregulated genes in the network phenotype reduces invasion (A) Spider plots of cell trajectories during drug treatment. (B) Quantification of the maximum invasion of cells within each drug condition (n = 59). Inhibition of the upregulated genes in the network phenotype reduced invasion. Adding recombinant F3, an upregulated network gene, increased invasion. (C) Representative brightfield images of the cells after 7 days of drug treatment. Scale bar is 200 μm. (D) Quantification of the number of network structures after 7 days of drug treatment (n = 18). Inhibition of the upregulated network genes reduced the formation of network structures. Data are represented as mean ± standard error of the mean (SEM). Statistical significance was determined by analysis of variance (ANOVA) followed by post-hoc analyses (Tukey) and is indicated as ∗, ∗∗, and ∗∗∗ for p ≤ 0.05, p ≤ 0.01, and p ≤ 0.001, respectively.
Figure 7
Figure 7
Phenotypic sorting enables analysis of phenotype stability (A) Representative brightfield image of reseeded spheroid cells after 7 days of culture in 3D type I collagen. Scale bar, 50 μm. (B) Representative brightfield image of reseeded network cells after 7 days of culture in 3D type I collagen. (C) Quantification of the phenotypes that arise after reseeding from sorted populations (n = 18). Invasive network cells largely reform network structures, while non-invasive spheroids may either form network or spheroid structures. (D) CD44 immunostaining of network cells. (E) CD44 staining of spheroid cells that are CD24 negative. (F) CD44 staining of spheroid cells that are CD24 positive.

References

    1. Aceto N., Bardia A., Miyamoto D.T., Donaldson M.C., Wittner B.S., Spencer J.A., Yu M., Pely A., Engstrom A., Zhu H. Circulating tumor cell clusters are oligoclonal precursors of breast cancer metastasis. Cell. 2014;158:1110–1122. - PMC - PubMed
    1. Beri P., Popravko A., Yeoman B., Kumar A., Chen K., Hodzic E., Chiang A., Banisadr A., Placone J.K., Carter H. Cell adhesiveness serves as a biophysical marker for metastatic potential. Cancer Res. 2020;80:901–911. - PMC - PubMed
    1. Cadwell C.R., Palasantza A., Jiang X., Berens P., Deng Q., Yilmaz M., Reimer J., Shen S., Bethge M., Tolias K. Electrophysiological, transcriptomic and morphologic profiling of single neurons using Patch-seq. Nat. Biotechnol. 2016;34:199–203. - PMC - PubMed
    1. Chappell L., Russell A.J.C., Voet T. Single-cell (Multi)omics technologies. Annu. Rev. Genomics Hum. Genet. 2018;19:15–41. - PubMed
    1. Cheung K.J., Ewald A.J. A collective route to metastasis: seeding by tumor cell clusters. Science. 2016;352:167–169. - PMC - PubMed