

Probabilistic harmonization and annotation of single-cell transcriptomics data with deep generative models
- PMID: 33491336
- PMCID: PMC7829634
- DOI: 10.15252/msb.20209620
Probabilistic harmonization and annotation of single-cell transcriptomics data with deep generative models
Abstract
As the number of single-cell transcriptomics datasets grows, the natural next step is to integrate the accumulating data to achieve a common ontology of cell types and states. However, it is not straightforward to compare gene expression levels across datasets and to automatically assign cell type labels in a new dataset based on existing annotations. In this manuscript, we demonstrate that our previously developed method, scVI, provides an effective and fully probabilistic approach for joint representation and analysis of scRNA-seq data, while accounting for uncertainty caused by biological and measurement noise. We also introduce single-cell ANnotation using Variational Inference (scANVI), a semi-supervised variant of scVI designed to leverage existing cell state annotations. We demonstrate that scVI and scANVI compare favorably to state-of-the-art methods for data integration and cell state annotation in terms of accuracy, scalability, and adaptability to challenging settings. In contrast to existing methods, scVI and scANVI integrate multiple datasets with a single generative model that can be directly used for downstream tasks, such as differential expression. Both methods are easily accessible through scvi-tools.
Keywords: annotation; differential expression; harmonization; scRNA-seq; variational inference.
© 2021 The Authors. Published under the terms of the CC BY 4.0 license.
Conflict of interest statement
The authors declare no competing interests.
Figures
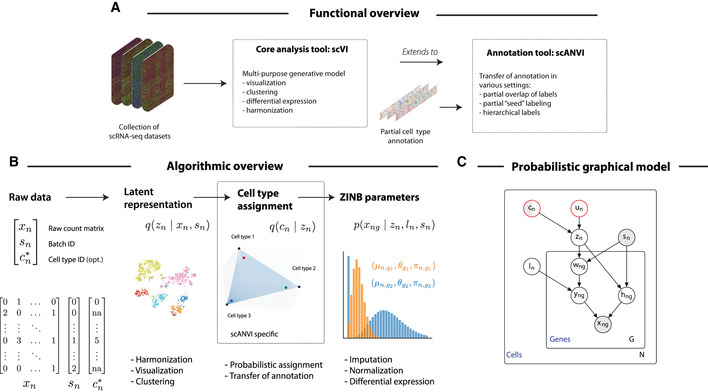
Functional overview of the methods proposed in this manuscript.
Schematic diagram of the variational inference procedure in both of the scVI and scANVI models. We show the order in which random variables in the generative model are sampled and how these variables can be used to derive biological insights.
The graphical models of scVI and scANVI. Vertices with black edges represent variables in both scVI and scANVI, and vertices with red edges are unique to scANVI. Shaded vertices represent observed random variables. Semi‐shaded vertices represent variables that can be either observed or random. Empty vertices represent latent random variables. Edges signify conditional dependency. Rectangles (“plates”) represent independent replication. The complete model specification and definition of internal variables is provided in the Materials and Methods
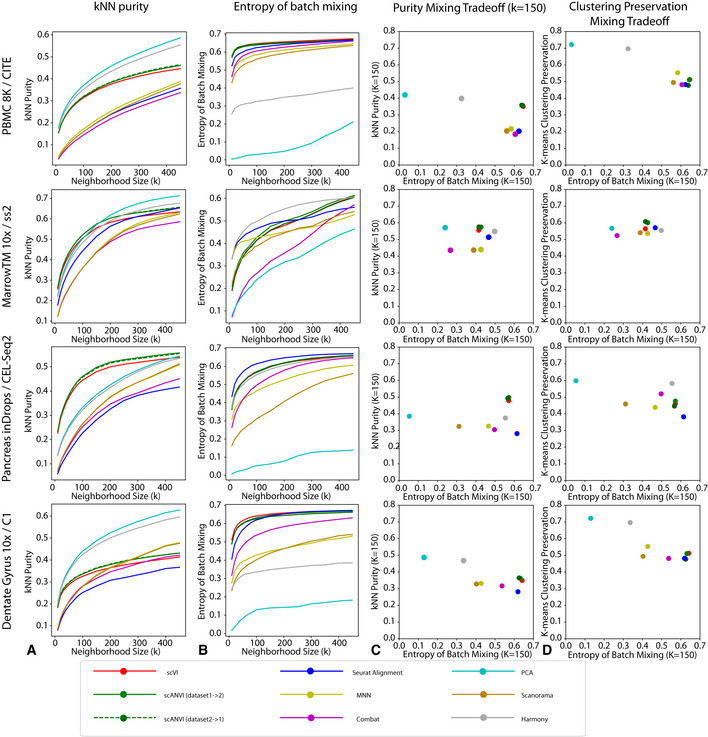
k‐nearest neighbors purity that ranges from 0 to 1, with higher values meaning better preservation of neighbor structure in the individual datasets after harmonization.
Entropy of batch mixing where higher values means that the cells from different datasets are well mixed.
The trade‐off between the kNN purity and entropy of batch mixing for a fixed K = 150. Methods on the top right corner have better performances.
The trade‐off between entropy of batch mixing and the preservation of biological information using an alternative unsupervised statistic k‐means clustering preservation.
- A–D
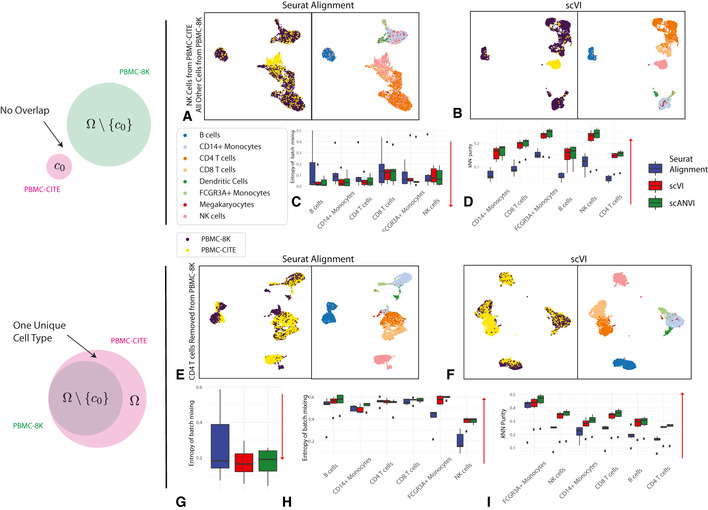
The case when no cell type is shared. PBMC‐8K contains all cells other than cell type c 0 while PBMC‐CITE contains only cell type c 0. Six experiments were run, each keeping one cell type from the PBMC‐CITE dataset. (A, B) UMAP visualization for the case where c 0 corresponds to natural killer cells. (C, D) entropy of batch mixing and k‐nearest neighbors purity, aggregating the six experiments (setting c 0 to a different cell type in each experiment). Data information: Red arrows indicate the desired direction for each performance measure. Low batch entropy is desirable in (C) while high k‐nearest neighbors purity is desirable in (D).
- E–I
The case when cell type c 0 is removed PBMC‐8K but not from PBMC‐CITE. Six experiments were run, each removing one cell type from the PBMC‐CITE dataset. (E, F) UMAP visualization for the case where c 0 corresponds to CD4+ T cells. (G) entropy of batch mixing for the removed cell type. Lower value is more desirable as indicated by the red arrow. (H) entropy of batch mixing for the remaining cell types. Higher value is more desirable as indicated by the red arrow. (I) k‐nearest neighbors purity. Higher value is more desirable as indicated by the red arrow.
- A, B
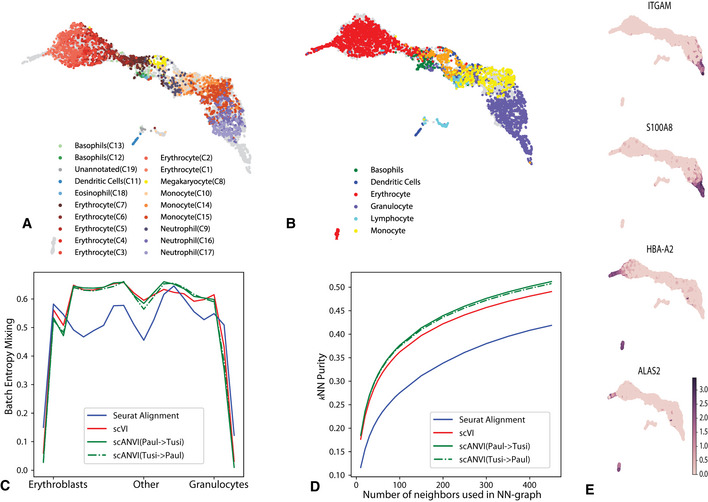
UMAP visualization of the scVI latent space, with cells colored by the original labels from either the HEMATO‐Paul (A) or HEMATO‐Tusi (B) studies. The cells from the other dataset are colored in gray.
- C
Entropy of batch mixing along 20 bins of the HEMATO‐Tusi cells, ordered by the potential of each cell. Potential is a pseudotime measure that describes the differentiation state of a cell using the population balance analysis algorithm (center: common myeloid progenitors; moving left: erythrocyte branch; moving right: granulocyte branch).
- D
k‐nearest neighbors purity for scVI, Seurat, and scANVI.
- E
Expression of marker genes that help determine the identity of batch‐unique cells.
- A, B
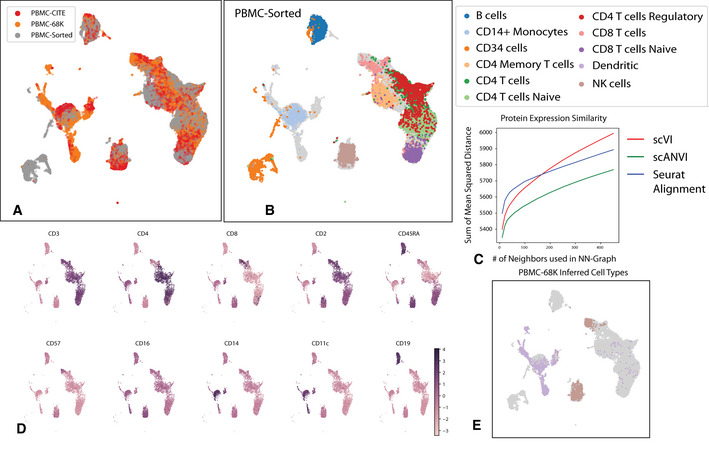
UMAP plot of the scANVI latent space inferred for three harmonized datasets: PBMC‐CITE, PBMC‐sorted, and PBMC‐68K. Cells are colored by the dataset of origin (A) and the PBMC‐sorted labels (B). Cells from the PBMC‐CITE and PBMC‐68K are colored in gray in (B).
- C
The consistency of the harmonized PBMC‐CITE mRNA data with the respective protein measurements, evaluated by mean squared error and for different neighborhood size. Lower values indicate higher consistency.
- D
UMAP plot of the scANVI latent space, where cells are colored by normalized protein measurement. Only PBMC‐CITE cells are displayed.
- E
UMAP plot of the scANVI latent space, with cells from the PBMC‐68k dataset colored according to their original label. For clarity of presentation, only cells originally labeled as dendritic cells or natural killer cells are colored. Evidently, a large number of these cells are mapped to a cluster of T cells (right side of the plot).
- A
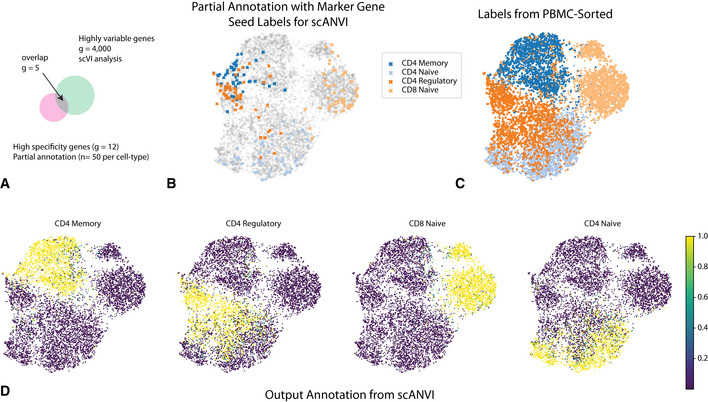
Discrepancies between marker genes that can be used to confidently label cells and highly variable genes in scRNA‐seq analysis.
- B–D
UMAP plot of the scVI latent space. (B) Seed cells are colored by their annotation (using known marker genes). (C) PBMC‐sorted cell type labels from the original study based on marker‐based sorting. (D) The posterior probability of each cell being one of the four T cell subtypes obtained with scANVI.
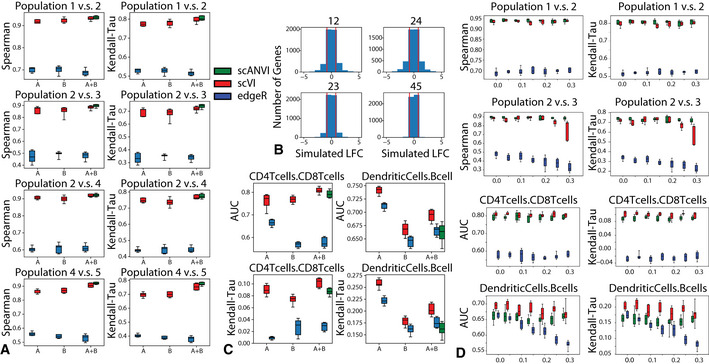
Evaluation of consistency with Spearman rank correlation and Kendall‐Tau is shown for comparisons of multiple pairs of cell types in the simulated data. For each comparison, we subsampled 30 cells from each group, and repeated the subsampling 10 times to evaluate the uncertainty in our result.
Distribution of true log fold change between all pairs of cell types for the simulated data. The pairs of cells are chosen to represent different levels of distance on the tree as in Appendix Fig S18A. The pairs of population from most distant to least distant are “12”, “24”, “23”, “45”.
Evaluation of consistency with the AUROC and Kendal Tau metric is shown for comparisons of CD4 vs CD8 T cells and B cells vs dendritic cells on the PBMC‐8K only (A), the PBMC‐68k only (B) and the merged PBMC‐8K / PBMC‐68K (A + B) for scVI and edgeR. For each comparison, we subsampled 30 cells from each group, and repeated the subsampling 10 times to evaluate the uncertainty in our result.
Mislabeling experiment in differential expression in both the SymSim simulated datasets and in the PBMC8K and PBMC68K dataset. The top row shows differential expression results for the correctly labeled population pair (Population 1 vs. Population 2 in simulated dataset and CD4 T cells vs. CD8 T cells in PBMC dataset. The bottom row shows differential expression results for the mislabelled population pair (Population 2 vs. Population 3 in simulated dataset and dendritic cells vs. B cells in PBMC dataset). For all, x‐axis represents the proportion of flipped labels.
References
-
- Amodio M, Krishnaswamy S (2018) Magan: Aligning biological manifolds. Proc Int Conf Mach Learn 80: 215–223
-
- Angerer P, Simon L, Tritschler S, Wolf FA, Fischer D, Theis FJ (2017) Single cells make big data: New challenges and opportunities in transcriptomics. Curr Opin Syst Biol 4: 85–91
Publication types
MeSH terms
Grants and funding
LinkOut - more resources
Full Text Sources
Other Literature Sources
Research Materials
