

Flow control in a laminate capillary-driven microfluidic device
- PMID: 33492316
- PMCID: PMC7990706
- DOI: 10.1039/d0an02279a
Flow control in a laminate capillary-driven microfluidic device
Abstract
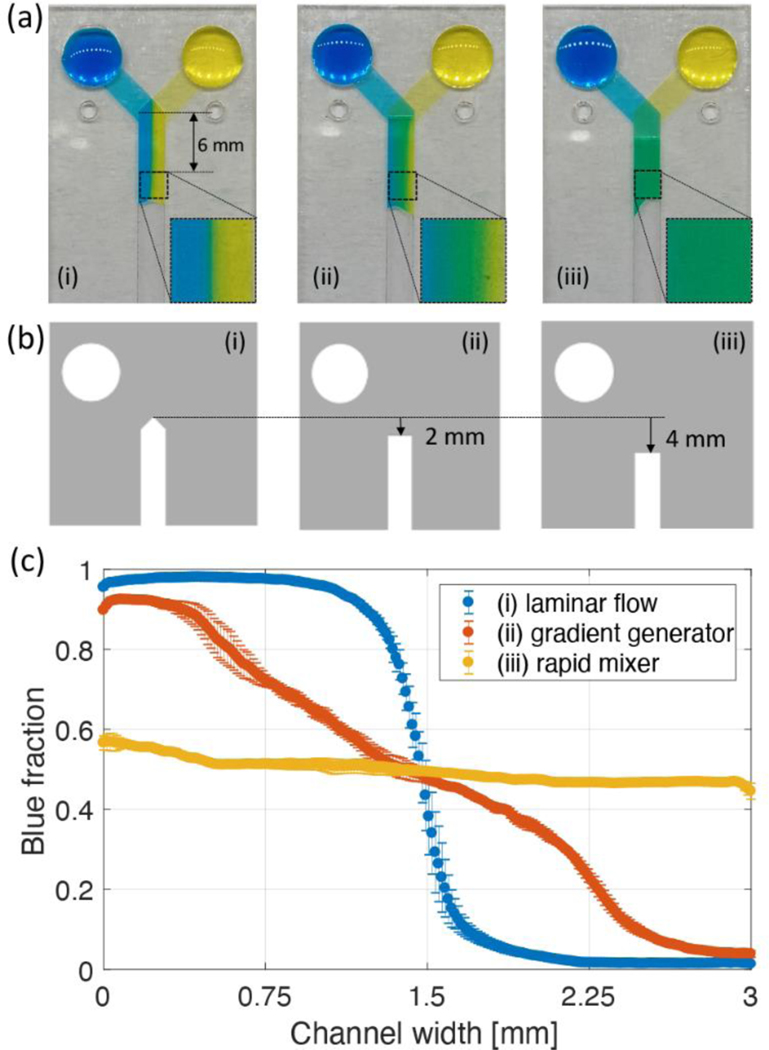
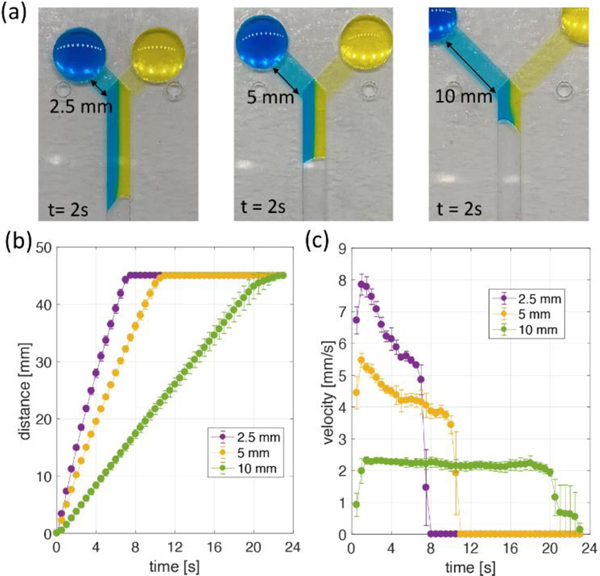
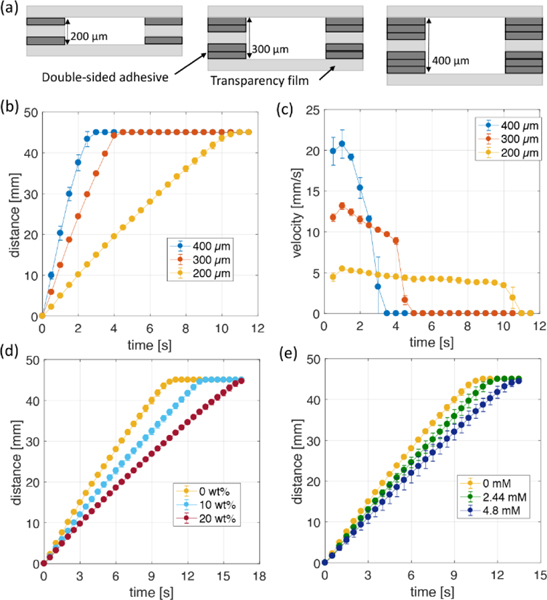
Capillary-driven microfluidic devices are of significant interest for on-site analysis because they do not require external pumps and can be made from inexpensive materials. Among capillary-driven devices, those made from paper and polyester film are among the most common and have been used in a wide array of applications. However, since capillary forces are the only driving force, flow is difficult to control, and passive flow control methods such as changing the geometry must be used to accomplish various analytical applications. This study presents several new flow control methods that can be utilized in a laminate capillary-driven microfluidic device to increase available functionality. First, we introduce push and burst valve systems that can stop and start flow. These valves can stop flow for >30 min and be opened by either pressing the channel or inflowing other fluids to the valve region. Next, we propose flow control methods for Y-shaped channels that enable more functions. In one example, we demonstrate the ability to accurately control concentration to create laminar, gradient, and fully mixed flows. In a second example, flow velocity in the main channel is controlled by adjusting the length of the inlet channel. In addition, the flow velocity is constant as the inlet length increases. Finally, the flow velocity in the Y-shaped device as a function of channel height and fluid properties such as viscosity and surface tension was examined. As in previous studies on capillary-driven channels, the flow rate was affected by each parameter. The fluidic control tools presented here will enable new designs and functions for low cost point of need assays across a variety of fields.
Conflict of interest statement
Conflicts of interest
There are no conflicts to declare
Figures
Similar articles
-
Capillary Flow-Driven and Magnetically Actuated Multi-Use Wax Valves for Controlled Sealing and Releasing of Fluids on Centrifugal Microfluidic Platforms.Micromachines (Basel). 2022 Feb 16;13(2):303. doi: 10.3390/mi13020303. Micromachines (Basel). 2022. PMID: 35208427 Free PMC article.
-
Control of initiation, rate, and routing of spontaneous capillary-driven flow of liquid droplets through microfluidic channels on SlipChip.Langmuir. 2012 Jan 24;28(3):1931-41. doi: 10.1021/la204399m. Epub 2012 Jan 10. Langmuir. 2012. PMID: 22233156 Free PMC article.
-
High throughput single-cell and multiple-cell micro-encapsulation.J Vis Exp. 2012 Jun 15;(64):e4096. doi: 10.3791/4096. J Vis Exp. 2012. PMID: 22733254 Free PMC article.
-
Microvalves for Applications in Centrifugal Microfluidics.Sensors (Basel). 2022 Nov 18;22(22):8955. doi: 10.3390/s22228955. Sensors (Basel). 2022. PMID: 36433550 Free PMC article. Review.
-
Capillary-driven microfluidics: impacts of 3D manufacturing on bioanalytical devices.Analyst. 2023 Jun 12;148(12):2657-2675. doi: 10.1039/d3an00115f. Analyst. 2023. PMID: 37166188 Review.
Cited by
-
Recent Advances in Skin-Interfaced Wearable Sweat Sensors: Opportunities for Equitable Personalized Medicine and Global Health Diagnostics.ACS Sens. 2023 Oct 27;8(10):3606-3622. doi: 10.1021/acssensors.3c01512. Epub 2023 Sep 25. ACS Sens. 2023. PMID: 37747817 Free PMC article. Review.
-
Electrochemical Capillary Driven Immunoassay for Detection of SARS-CoV-2.ACS Meas Sci Au. 2022 Dec 21;2(6):584-594. doi: 10.1021/acsmeasuresciau.2c00037. Epub 2022 Aug 30. ACS Meas Sci Au. 2022. PMID: 36570470 Free PMC article.
-
Microfluidic pumps for cell sorting.Biomicrofluidics. 2023 Sep 18;17(5):051502. doi: 10.1063/5.0161223. eCollection 2023 Sep. Biomicrofluidics. 2023. PMID: 37736018 Free PMC article. Review.
-
Advancements in the research of finger-actuated POCT chips.Mikrochim Acta. 2023 Dec 29;191(1):65. doi: 10.1007/s00604-023-06140-z. Mikrochim Acta. 2023. PMID: 38158397 Review.
-
Simple manipulation of enzyme-linked immunosorbent assay (ELISA) using an automated microfluidic interface.Anal Methods. 2022 May 13;14(18):1774-1781. doi: 10.1039/d2ay00326k. Anal Methods. 2022. PMID: 35481474 Free PMC article.
References
-
- Cheng N-S, Industrial & Engineering Chemistry Research, 2008, 47, 3285–3288.
-
- Mysels KJ, Langmuir, 1986, 2, 423–428.
-
- Alava M, Dubé M and Rost M, Advances in Physics, 2004, 53, 83–175.
-
- Xiao J, Stone HA and Attinger D, Langmuir, 2012, 28, 4208–4212. - PubMed
-
- Elizalde E, Urteaga R and Berli CLA, Lab on a Chip, 2015, 15, 2173–2180. - PubMed
Grants and funding
LinkOut - more resources
Full Text Sources
Other Literature Sources
Research Materials