. 2021 Mar;70(3):843-856.
doi: 10.1007/s00262-021-02849-z. Epub 2021 Jan 25.

PD-1/PD-L1 checkpoint inhibitors in combination with olaparib display antitumor activity in ovarian cancer patient-derived three-dimensional spheroid cultures

Affiliations

PD-1/PD-L1 checkpoint inhibitors in combination with olaparib display antitumor activity in ovarian cancer patient-derived three-dimensional spheroid cultures

Kathryn M Appleton et al. Cancer Immunol Immunother. 2021 Mar.

Abstract

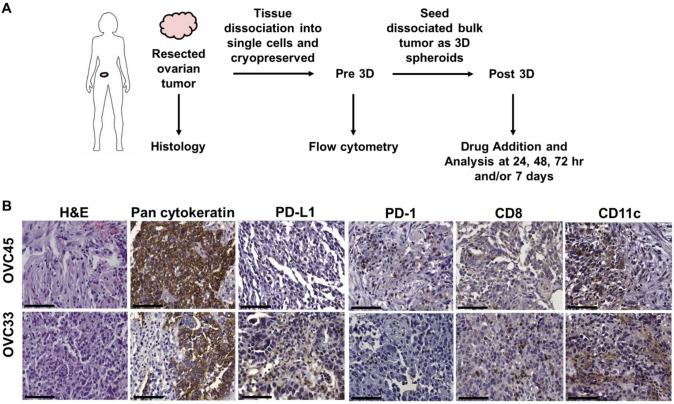
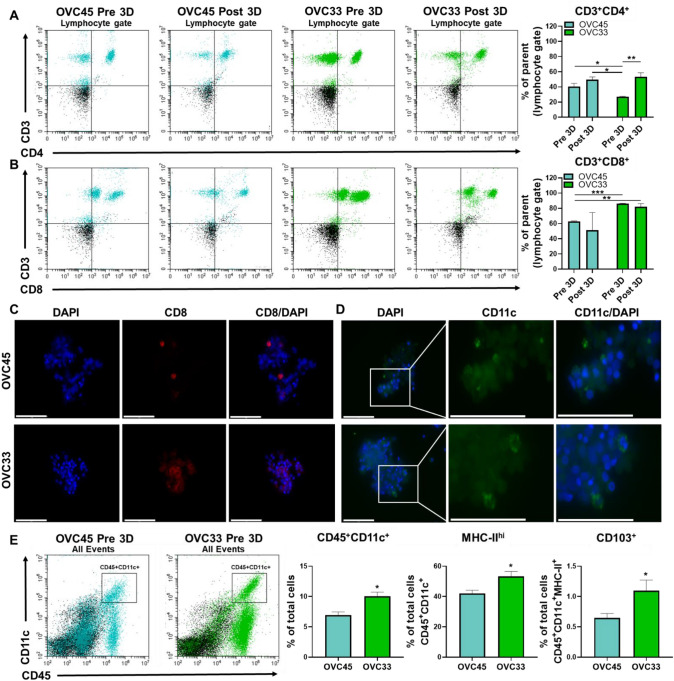
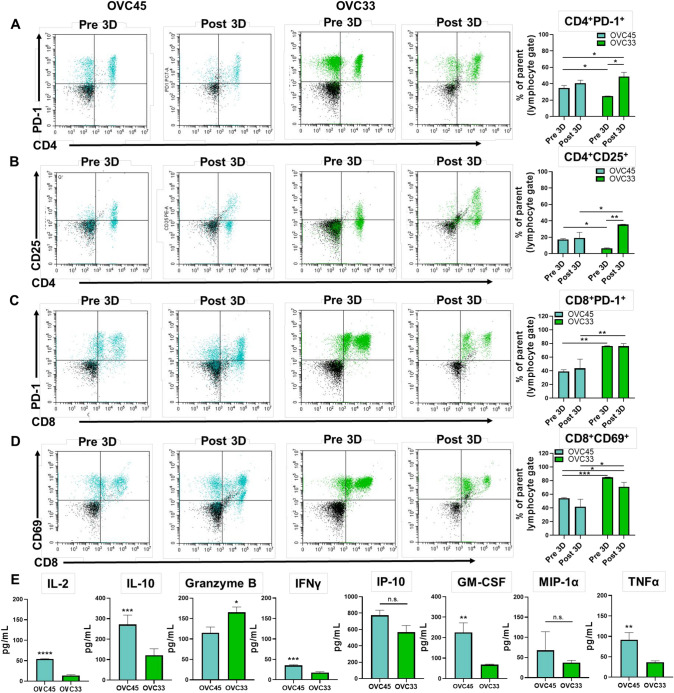
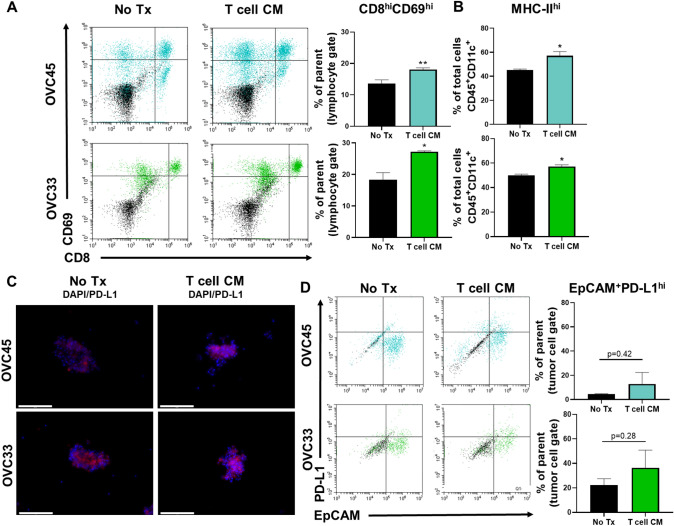
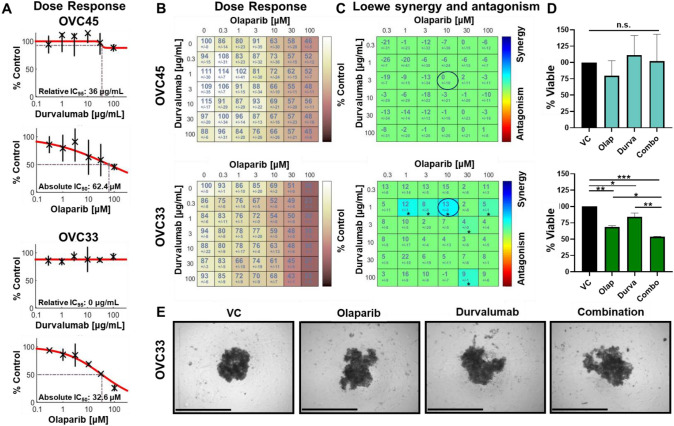
Immune checkpoint inhibitors (ICIs) that target programmed cell death protein 1 (PD-1) and programmed death-ligand 1 (PD-L1) have shown modest activity as monotherapies for the treatment of ovarian cancer (OC). The rationale for using these therapies in combination with poly (ADP-ribose) polymerase inhibitors (PARP-Is) has been described, and their in vivo application will benefit from ex vivo platforms that aid in the prediction of patient response or resistance to therapy. This study examined the effectiveness of detecting patient-specific immune-related activity in OC using three-dimensional (3D) spheroids. Immune-related cell composition and PD-1/PD-L1 expression status were evaluated using cells dissociated from fresh OC tissue from two patients prior to and following 3D culture. The patient sample with the greatest increase in the proportion of PD-L1 + cells also possessed more activated cytotoxic T cells and mature DCs compared to the other patient sample. Upon cytokine stimulation, patient samples demonstrated increases in cytotoxic T cell activation and DC major histocompatibility complex (MHC) class-II expression. Pembrolizumab increased cytokine secretion, enhanced olaparib cytotoxicity, and reduced spheroid viability in a T cell-dependent manner. Furthermore, durvalumab and olaparib combination treatment increased cell death in a synergistic manner. This work demonstrates that immune cell activity and functional modulation can be accurately detected using our ex vivo 3D spheroid platform, and it presents evidence for their utility to demonstrate sensitivity to ICIs alone or in combination with PARP-Is in a preclinical setting.

Keywords: 3D cultures; Immune checkpoint inhibitors; Ovarian cancer; PARP inhibitors; Spheroid.


Conflict of interest statement

Dr. Appleton, Ms. Elrod, Ms. Lassahn, Mr. Shuford, Ms. Holmes, and Dr. DesRochers are current employees of KIYATEC, Inc.

Figures

Fig. 1
Fig. 1
Tissue processing schematic and characterization. (a) Schematic of tissue processing for characterization. Flow cytometry was conducted to evaluate cell composition following tissue dissociation and prior to 3D culture. Immunofluorescence and flow cytometry were conducted at different timepoints to evaluate 3D spheroid culture and drug treatment effects on cell populations. (b) Representative images of formalin-fixed paraffin embedded tissues. Pan-cytokeratin was used to determine the presence of epithelial cells within the tumor tissues. Additional immune-related markers selected to assess infiltration were PD-L1, PD-1, CD8, and CD11c. Representative images are from two independent experiments. Scale bar = 75 μm
Fig. 2
Fig. 2
Characterization of PD-L1 expression Pre 3D and Post 3D. (a) Representative data of tumor cells assessed using EpCAM as a marker. Quantification of PD-L1 negative tumor cells and PD-L1+tumor cells identified Pre 3D and Post 3D for OVC45 and OVC33 is shown in the right panel. (b) Representative data of immune cells assessed using CD45 as a marker. CD45+ cells were detected within the large gate defined for tumor cells. Quantification of PD-L1 negative immune cells and PD-L1+ immune cells identified Pre 3D and Post 3D for both tumor tissues is shown in the right panel. (c) Representative data of immune cells assessed using CD45 as a marker within the lymphocyte gate. Quantification of PD-L1 negative immune cells and PD-L1+ immune cells identified Pre 3D and Post 3D for both patient samples is shown in the right panel. All percentages are expressed as a portion of the “tumor gate” or “lymphocyte gate,” respectively. Two independent experiments and three independent experiments were conducted for Pre 3D and Post 3D, respectively. Post 3D for all data shown = 48 h in 3D culture. Isotype controls (black events) were subtracted from marker values (OVC45 = blue events; OVC33 = green events). Unpaired t tests were used for sample comparison using GraphPad. Error bars reflect SD. *p < 0.05, **p < 0.01
Fig. 3
Fig. 3
T cell and DC populations within the 3D spheroid culture system. (a) Representative data and quantification of CD4+T cells (CD3+/CD4+). (b) Representative data and quantification of CD8+T cells (CD3+/CD8+). (c) Representative images verify the presence of CD8+cells as determined by immunofluorescence following 48 h in 3D spheroid culture. Scale bars = 75 μm. Two independent experiments and three independent experiments were conducted for Pre 3D and Post 3D, respectively. (d) The presence of DCs following 48 h in 3D spheroid culture was determined via immunofluorescence. Scale bars = 75 μm. Image inset shows a zoomed version of the same magnification. (e) Representative data for DCs defined by dual CD45+/CD11c+. The percent of dual CD45/CD11c events were determined for OVC45 and OVC33. Isotype controls (black events) were subtracted from marker values (OVC45 = blue events, OVC33 = green events). Expression of MHC-II and CD103 expression was determined for DC populations across the patient samples. Two independent experiments were conducted for OVC45, and three independent experiments were conducted for OVC33. Isotype controls were subtracted from marker values. Error bars reflect SD. Not significant = n.s., *p < 0.05, **p < 0.01, ***p < 0.005
Fig. 4
Fig. 4
Characterization of T cell populations Pre 3D and Post 3D. (a) Representative data of CD4+T cells evaluated for activation and exhaustion via PD-1 expression. (b) Tregs were identified by dual CD4+/CD25+. (c) CD8+ cytotoxic T cells were examined by analyzing expression levels of PD-1. (d) The activation status of CD8+ cytotoxic T cells was evaluated via CD69 expression. Two independent experiments were conducted for OVC45 and Pre 3D OVC33, and three independent experiments were conducted for OVC33 Post 3D. Post 3D for all data shown = 72 h in culture. Isotype controls (black events) were subtracted from marker values (OVC45 = blue events, OVC33 = green events). Unpaired t tests were used for sample comparison using GraphPad. (e) Cytokines were evaluated from supernatants collected following 72 h in 3D culture from three independent experiments for OVC45 and OVC33. Unpaired t tests were used for sample comparison using GraphPad. Error bars reflect SD. Not significant = n.s., *p < 0.05, **p < 0.01, ***p < 0.005, ****p < 0.001
Fig. 5
Fig. 5
Cytokine stimulation enhances immune-related function in 3D spheroid cultures. (a) Representative data and quantification of the activation status of cytotoxic T cells was defined by dual CD8 high and CD69 high positivity following no treatment or T cell CM treatment for 48 h. Quantification of activated cytotoxic T cells from three independent experiments for OVC45 and two independent experiments for OVC33. (b) Quantification of MHC-II high expression from two independent experiments. OVC45 and OVC33 is shown in blue or green, respectively. (c) Representative images of PD-L1 expression for OVC45 and OVC33 following 48 h of no treatment or T cell CM treatment. Images were taken at the same exposure. Scale bars = 125 μm. (d) Representative data showing PD-L1 expression on tumor cells defined by dual PD-L1 and EpCAM positivity. Quantification of PD-L1+ tumor cells from two independent experiments. Isotype controls (black events) were subtracted from marker values (OVC45 = blue events, OVC33 = green events). Unpaired t tests were used for sample comparison using GraphPad. Error bars reflect SD. *p < 0.05, **p < 0.01
Fig. 6
Fig. 6
Pembrolizumab alters T cell function, enhances olaparib efficacy, and induces T cell-dependent spheroid death. (a) Cytokine secretion was determined from supernatants collected for both patient samples following VC or pembrolizumab treatment for 48 h. Supernatant was collected from three independent experiments. Depicted is the fold change in cytokine concentrations as determined by normalizing pembrolizumab treatment to VC. (b) 3D spheroids were treated with media (No Tx), VC, olaparib, pembrolizumab, or both olaparib and pembrolizumab (Combo) for 48 h. (c) Representative images of 3D spheroids following 48 h of treatment. Scale bars = 650 μm. (d) Pre 3D bulk T cells were separated and incubated with pembrolizumab. Pre 3D bulk cells were then either cultured with or without treated T cells, and after 48 h, spheroid viability was determined. Spheroid viability for all experiments was determined using CellTiter-Glo® Glo. Unpaired one-way ANOVA with multiple comparison was conducted on the mean of three independent experiments. Error bar = SD. Not significant = n.s., *p < 0.05, **p < 0.01
Fig. 7
Fig. 7
Durvalumab and olaparib synergistically reduce OVC33 spheroid viability. (a) OVC45 and (b) OVC33 were treated with a range of olaparib or durvalumab, and viability was determined. Percent viability was determined by normalizing to VC. Dose–response curves and relative IC95 or absolute IC50 was determined across two independent experiments using Combenefit software. (c) Depicted are the mean and error of percent spheroid viability following olaparib and durvalumab cross dose–response treatment for OVC45 and OVC33 normalized to VC. (d) Loewe synergy and antagonism was determined from the change in spheroid viability following olaparib and durvalumab cross dose–response across two independent experiments. Synergistic combinations (blue) or antagonistic combinations (red) are only color-coded if there is statistical significance. Synergy and antagonism heat maps and significance were calculated and generated by Combenefit software. * p < 0.05. (e) A single combination is highlighted by the circled data set on the synergy heatmap for OVC45 and OVC33. (f) Representative spheroid images of OVC33 are shown post-treatment. Scale bar = 650 μm

References

    1. Siegel RL, Miller KD, Jemal A. Cancer statistics, 2020. CA Cancer J Clin. 2020;70(1):7–30. doi: 10.3322/caac.21590. - DOI - PubMed
    1. Pantelidou C, Sonzogni O, De Oliveria TM, Mehta AK, Kothari A, Wang D, et al. PARP inhibitor efficacy depends on CD8(+) T-cell recruitment via intratumoral STING pathway activation in BRCA-deficient models of triple-negative breast cancer. Cancer Discov. 2019;9(6):722–737. doi: 10.1158/2159-8290.CD-18-1218. - DOI - PMC - PubMed
    1. Zhang L, Conejo-Garcia JR, Katsaros D, Gimotty PA, Massobrio M, Regnani G, et al. Intratumoral T cells, recurrence, and survival in epithelial ovarian cancer. N Engl J Med. 2003;348(3):203–213. doi: 10.1056/NEJMoa020177. - DOI - PubMed
    1. Zhang G, Liu C, Bai H, Cao G, Cui R, Zhang Z. Combinatorial therapy of immune checkpoint and cancer pathways provides a novel perspective on ovarian cancer treatment. Oncol Lett. 2019;17(3):2583–2591. - PMC - PubMed
    1. Ghisoni E, Imbimbo M, Zimmermann S, Valabrega G. Ovarian cancer immunotherapy: turning up the heat. Int J Mol Sci. 2019;20(12):2927. doi: 10.3390/ijms20122927. - DOI - PMC - PubMed

MeSH terms