

Using Interleaved Stimulation to Measure the Size and Selectivity of the Sustained Phase-Locked Neural Response to Cochlear Implant Stimulation
- PMID: 33492562
- PMCID: PMC7943679
- DOI: 10.1007/s10162-020-00783-y
Using Interleaved Stimulation to Measure the Size and Selectivity of the Sustained Phase-Locked Neural Response to Cochlear Implant Stimulation
Abstract
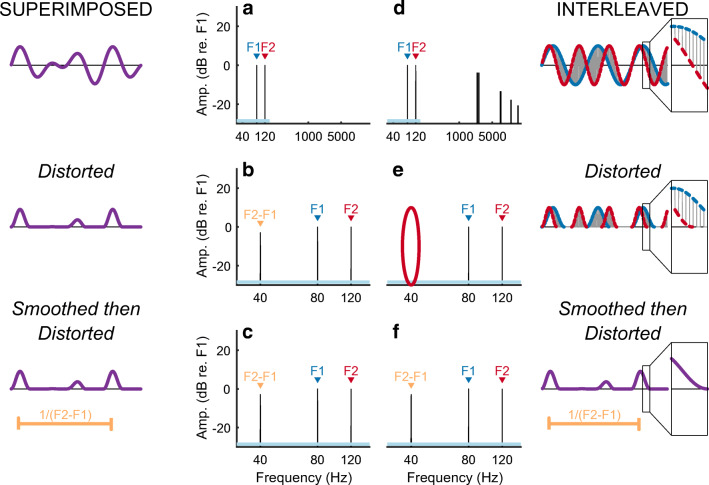
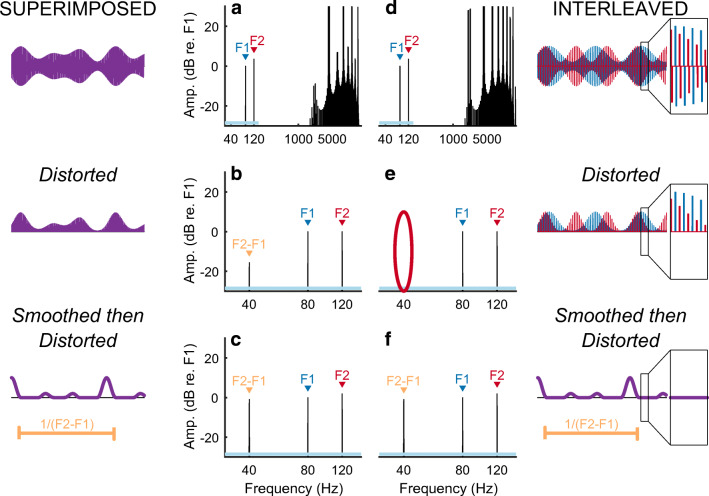
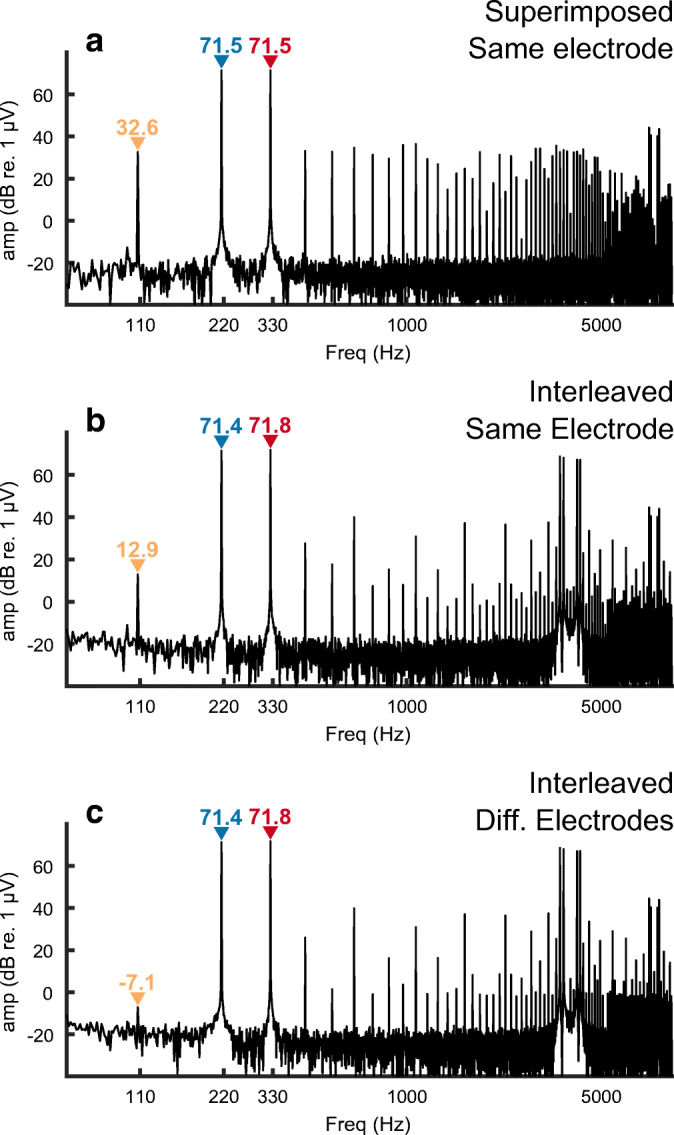
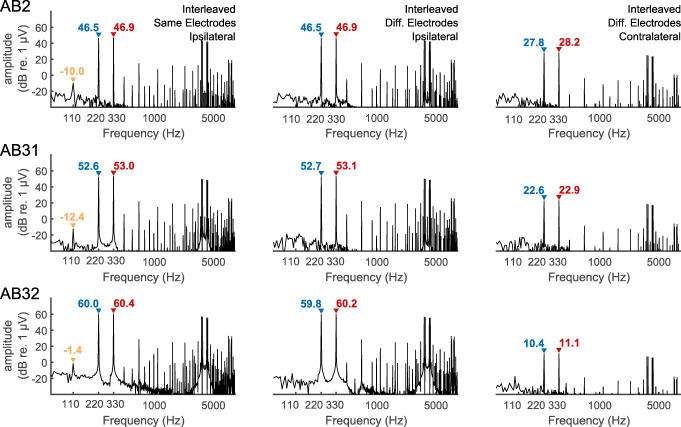
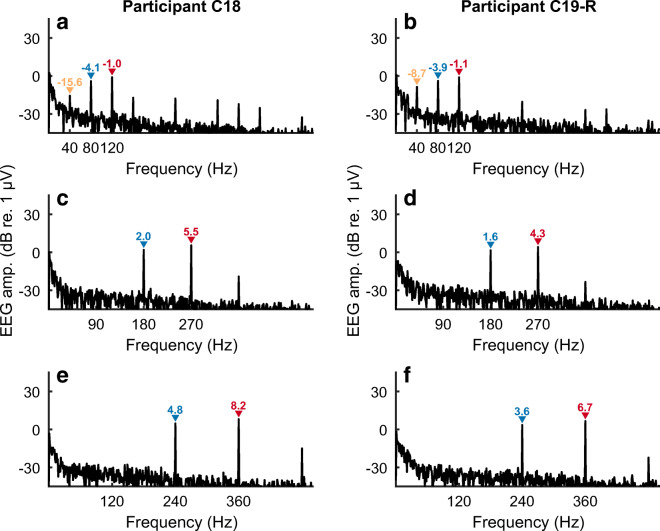
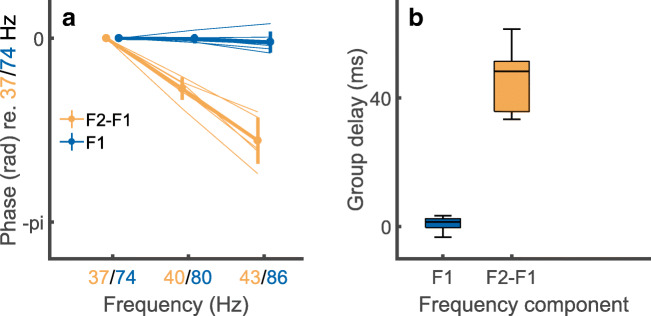
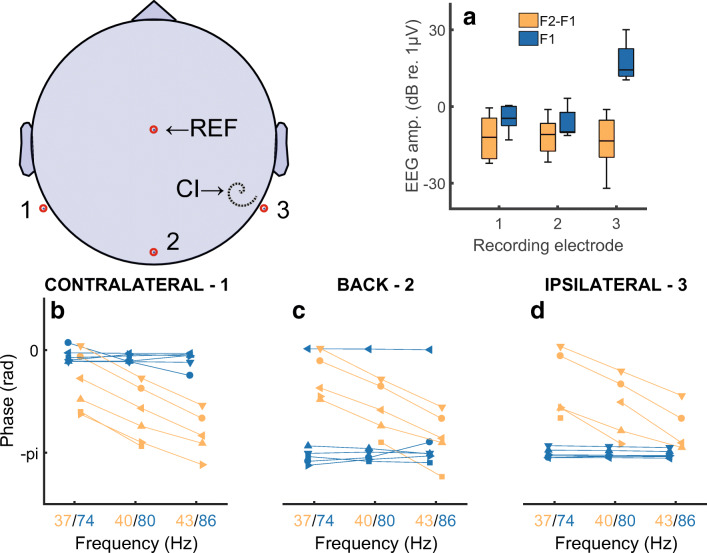
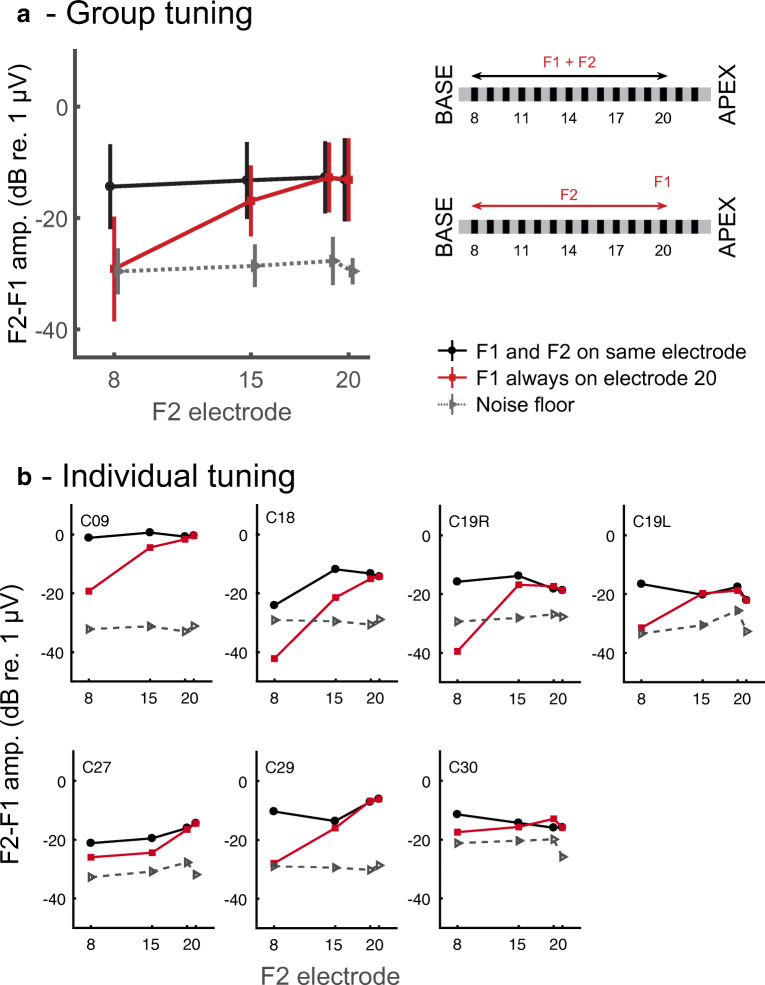
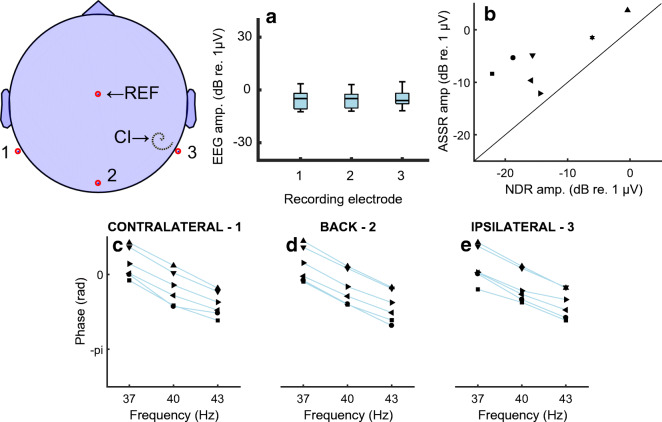
We measured the sustained neural response to electrical stimulation by a cochlear implant (CI). To do so, we interleaved two stimuli with frequencies F1 and F2 Hz and recorded a neural distortion response (NDR) at F2-F1 Hz. We show that, because any one time point contains only the F1 or F2 stimulus, the instantaneous nonlinearities typical of electrical artefact should not produce distortion at this frequency. However, if the stimulus is smoothed, such as by charge integration at the nerve membrane, subsequent (neural) nonlinearities can produce a component at F2-F1 Hz. We stimulated a single CI electrode with interleaved sinusoids or interleaved amplitude-modulated pulse trains such that F2 = 1.5F1, and found no evidence for an NDR when F2-F1 was between 90 and 120 Hz. However, interleaved amplitude-modulated pulse trains with F2-F1~40 Hz revealed a substantial NDR with a group delay of about 45 ms, consistent with a thalamic and/or cortical response. The NDR could be measured even from recording electrodes adjacent to the implant and at the highest pulse rates (> 4000 pps) used clinically. We then measured the selectivity of this sustained response by presenting F1 and F2 to different electrodes and at different between-electrode distances. This revealed a broad tuning that, we argue, reflects the overlap between the excitation elicited by the two electrodes. Our results also provide a glimpse of the neural nonlinearity in the auditory system, unaffected by the biomechanical cochlear nonlinearities that accompany acoustic stimulation. Several potential clinical applications of our findings are discussed.
Keywords: cochlear implants; cortical response; electrophysiology; neural nonlinearity; psychophysics.
Conflict of interest statement
The authors declare that they have no competing interests.
Figures
Similar articles
-
Using Interleaved Stimulation and EEG to Measure Temporal Smoothing and Growth of the Sustained Neural Response to Cochlear-Implant Stimulation.J Assoc Res Otolaryngol. 2023 Apr;24(2):253-264. doi: 10.1007/s10162-023-00886-2. Epub 2023 Feb 8. J Assoc Res Otolaryngol. 2023. PMID: 36754938 Free PMC article.
-
Auditory cortex phase locking to amplitude-modulated cochlear implant pulse trains.J Neurophysiol. 2008 Jul;100(1):76-91. doi: 10.1152/jn.01109.2007. Epub 2008 Mar 26. J Neurophysiol. 2008. PMID: 18367697 Free PMC article.
-
Effects of altering organ of Corti on cochlear distortion products f2 - f1 and 2f1 - f2.J Neurophysiol. 1982 Feb;47(2):303-28. doi: 10.1152/jn.1982.47.2.303. J Neurophysiol. 1982. PMID: 7062102
-
Chronic electrical stimulation of the auditory nerve at high stimulus rates: a physiological and histopathological study.Hear Res. 1997 Mar;105(1-2):1-29. doi: 10.1016/s0378-5955(96)00193-1. Hear Res. 1997. PMID: 9083801
-
Auditory steady-state responses in cochlear implant users: Effect of modulation frequency and stimulation artifacts.Hear Res. 2016 May;335:149-160. doi: 10.1016/j.heares.2016.03.006. Epub 2016 Mar 17. Hear Res. 2016. PMID: 26994660
Cited by
-
Electrophysiological and Psychophysical Measures of Temporal Pitch Sensitivity in Normal-hearing Listeners.J Assoc Res Otolaryngol. 2023 Feb;24(1):47-65. doi: 10.1007/s10162-022-00879-7. Epub 2022 Dec 5. J Assoc Res Otolaryngol. 2023. PMID: 36471208 Free PMC article.
-
Towards personalized and optimized fitting of cochlear implants.Front Neurosci. 2023 Jul 13;17:1183126. doi: 10.3389/fnins.2023.1183126. eCollection 2023. Front Neurosci. 2023. PMID: 37521701 Free PMC article.
-
Using Interleaved Stimulation and EEG to Measure Temporal Smoothing and Growth of the Sustained Neural Response to Cochlear-Implant Stimulation.J Assoc Res Otolaryngol. 2023 Apr;24(2):253-264. doi: 10.1007/s10162-023-00886-2. Epub 2023 Feb 8. J Assoc Res Otolaryngol. 2023. PMID: 36754938 Free PMC article.
-
Neural Decoding of the Speech Envelope: Effects of Intelligibility and Spectral Degradation.Trends Hear. 2024 Jan-Dec;28:23312165241266316. doi: 10.1177/23312165241266316. Trends Hear. 2024. PMID: 39183533 Free PMC article.
-
Cochlear Implant Research and Development in the Twenty-first Century: A Critical Update.J Assoc Res Otolaryngol. 2021 Oct;22(5):481-508. doi: 10.1007/s10162-021-00811-5. Epub 2021 Aug 25. J Assoc Res Otolaryngol. 2021. PMID: 34432222 Free PMC article. Review.
References
Publication types
MeSH terms
Grants and funding
LinkOut - more resources
Full Text Sources
Other Literature Sources
Medical
Miscellaneous
