. 2021 Jan 25;16(1):e0244702.
doi: 10.1371/journal.pone.0244702. eCollection 2021.

Pupillary reflex and behavioral masking responses to light as functional measures of retinal degeneration in mice

Affiliations

Pupillary reflex and behavioral masking responses to light as functional measures of retinal degeneration in mice

Ethan O Contreras et al. PLoS One. .

Abstract

Background: Pre-clinical testing of retinal pathology and treatment efficacy depends on reliable and valid measures of retinal function. The electroretinogram (ERG) and tests of visual acuity are the ideal standard, but can be unmeasurable while useful vision remains. Non-image-forming responses to light such as the pupillary light reflex (PLR) are attractive surrogates. However, it is not clear how accurately such responses reflect changes in visual capability in specific disease models. The purpose of this study was to test whether measures of non-visual responses to light correlate with previously determined visual function in two photoreceptor degenerations.

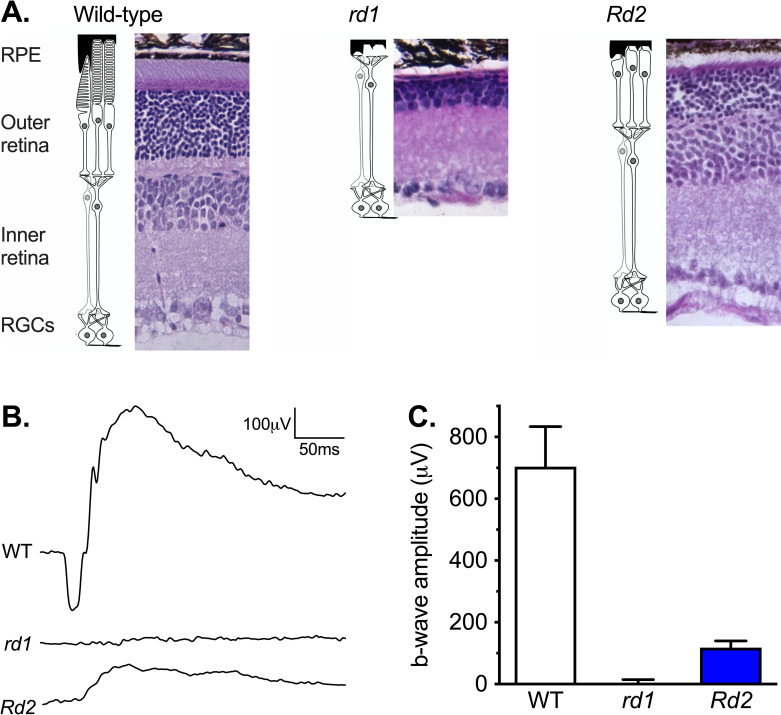
Methods: The sensitivity of masking behavior (light induced changes in running wheel activity) and the PLR were measured in 3-month-old wild-type mice (WT) with intact inner retinal circuitry, Pde6b-rd1/rd1 mice (rd1) with early and rapid loss of rods and cones, and Prph2-Rd2/Rd2 mice (Rd2) with a slower progressive loss of rods and cones.

Results: In rd1 mice, negative masking had increased sensitivity, positive masking was absent, and the sensitivity of the PLR was severely reduced. In Rd2 mice, positive masking identified useful vision at higher light levels, but there was a limited decrease in the irradiance sensitivity of negative masking and the PLR, and the amplitude of change for both underestimated the reduction in irradiance sensitivity of image-forming vision.

Conclusions: Together these data show that in a given disease, two responses to light can be affected in opposite ways, and that for a given response to light, the change in the response does not accurately represent the degree of pathology. However, the extent of the deficit in the PLR means that even a limited rescue of rod/cone function might be measured by increased PLR amplitude. In addition, positive masking has the potential to measure effective treatment in both models by restoring responses or shifting thresholds to lower irradiances.


Conflict of interest statement

The authors have declared that no competing interests exist.

Figures

Fig 1
Fig 1. Retinal anatomy and function of wild-type, rd1 and Rd2 mice.
(A) H&E stained sections of retina from wild-type, rd1, and Rd2 mice. Gross layers of the retina are labeled: RPE = retina pigment epithelium; the outer retina with the rod and cone photoreceptor cells; the inner retina with bipolar and amacrine cells; and RGCs = the Retinal Ganglion Cell layer. (B) Electroretinogram traces in response to light from 4-millisecond 25cd.s.m2 flashes of light in wild-type (n = 6), rd1 (n = 8), and Rd2 mice (n = 8). (C) The derived Mean ± SEM electroretinogram b-wave amplitude. Reduction in ERG b-wave was significant for both rd1 (Mann-Whitney test P < 0.001; n = 6, 8) and Rd2 mice (P < 0.001; n = 6, 8).
Fig 2
Fig 2. Masking of activity by light.
(A) A representation of the lighting schedule for pre-test baseline day (1) and test day (2) are shown above wheel running activity from baseline (1) and test days (2). (B) The relationship between irradiance and change in wheel running activity is shown over a 4-log unit range of irradiance for wild-type (n = 12), rd1 (n = 12), and Rd2 mice (n = 12). Mean ± SEM activity at each irradiance is calculated as a percentage of baseline at 0%, which is determined from activity at the same time on the pre-test day. Variable slope sigmoid dose response curves are fitted to data.
Fig 3
Fig 3. Individual traces of change in pupil size to 1-second 10.0 μWcm-2s-1 stimuli.
Panels show individual traces of pupil size over time for (A) wild-type (n = 9), (B) rd1 (n = 9), and (C) Rd2 mice (n = 10): only successfully recorded traces are included. Change in pupil size is shown in mm, with grid lines showing 0.5mm intervals. The 1-second red stimulus at 10-seconds is shown by a red arrow and red background line. The 1-second blue stimuli at 70 seconds is shown by a blue arrow and blue background line.
Fig 4
Fig 4. Mean pupil traces at different irradiances.
(A) Combined mean traces of pupil size over time for wild-type (n = 9), rd1 (n = 9), and Rd2 mice (n = 10). Change in pupil size is shown in mm, with grid lines showing 0.5mm intervals. The 1-second red stimulus at 10-seconds is shown by a red arrow and red background line. The 1-second blue stimuli at 70 seconds is shown by a blue arrow and blue background line. (B) Dark adapted pupil diameter is shown in mm, with stimuli shown in power. Dark-adapted baseline pupil size was significantly larger in rd1 (Mean ± SEM in mm: wild-type 1.92 ± 0.21; rd1 2.13 ± 0.08; P < 0.0001; t = 5.7; n = 9) and to a lesser degree in Rd2 mice (2.05 ± 0.23; P = 0.014; t = 2.5; n = 9, 10). (C) Responses to a 1-second red stimulus at four irradiances are shown with dose response curves fitted. 622nm stimuli are shown in log10 photon flux: 10 μWcm-2s-1 = 3.12x10¹³ photons/cm2/s = 13.49 on a log10 scale. (D) Responses to a 1-second blue stimulus at four irradiances are shown with dose response curves fitted. 480nm stimuli are shown in log10 photon flux: 10 μWcm-2s-1 = 2.42x10¹³ photons/cm2/s = 13.38 on a log10 scale. (B, C and D) Mean ± SEM.

References

    1. Pang JJ, Chang B, Kumar A, Nusinowitz S, Noorwez SM, Li J, et al. Gene therapy restores vision-dependent behavior as well as retinal structure and function in a mouse model of RPE65 leber congenital amaurosis. Mol Ther. 2006. 10.1016/j.ymthe.2005.09.001 - DOI - PubMed
    1. Veleri S, Lazar CH, Chang B, Sieving PA, Banin E, Swaroop A. Biology and therapy of inherited retinal degenerative disease: Insights from mouse models. DMM Disease Models and Mechanisms. 2015. 10.1242/dmm.017913 - DOI - PMC - PubMed
    1. Leinonen H, Tanila H. Vision in laboratory rodents—Tools to measure it and implications for behavioral research. Behavioural Brain Research. 2018. 10.1016/j.bbr.2017.07.040 - DOI - PubMed
    1. Prusky GT, Alam NM, Beekman S, Douglas RM. Rapid quantification of adult and developing mouse spatial vision using a virtual optomotor system. Investig Ophthalmol Vis Sci. 2004. 10.1167/iovs.04-0541 - DOI - PubMed
    1. Prusky GT, West PWR, Douglas RM. Behavioral assessment of visual acuity in mice and rats. Vision Res. 2000;40: 2201–2209. Available: www.elsevier.com/locate/visres 10.1016/s0042-6989(00)00081-x - DOI - PubMed

Publication types

LinkOut - more resources