Review
. 2021 Oct 15:474:94-99.
doi: 10.1016/j.neuroscience.2021.01.023. Epub 2021 Jan 22.

Deuterium Metabolic Imaging of the Healthy and Diseased Brain

Affiliations
Review

Deuterium Metabolic Imaging of the Healthy and Diseased Brain

Milou Straathof et al. Neuroscience. .

Abstract

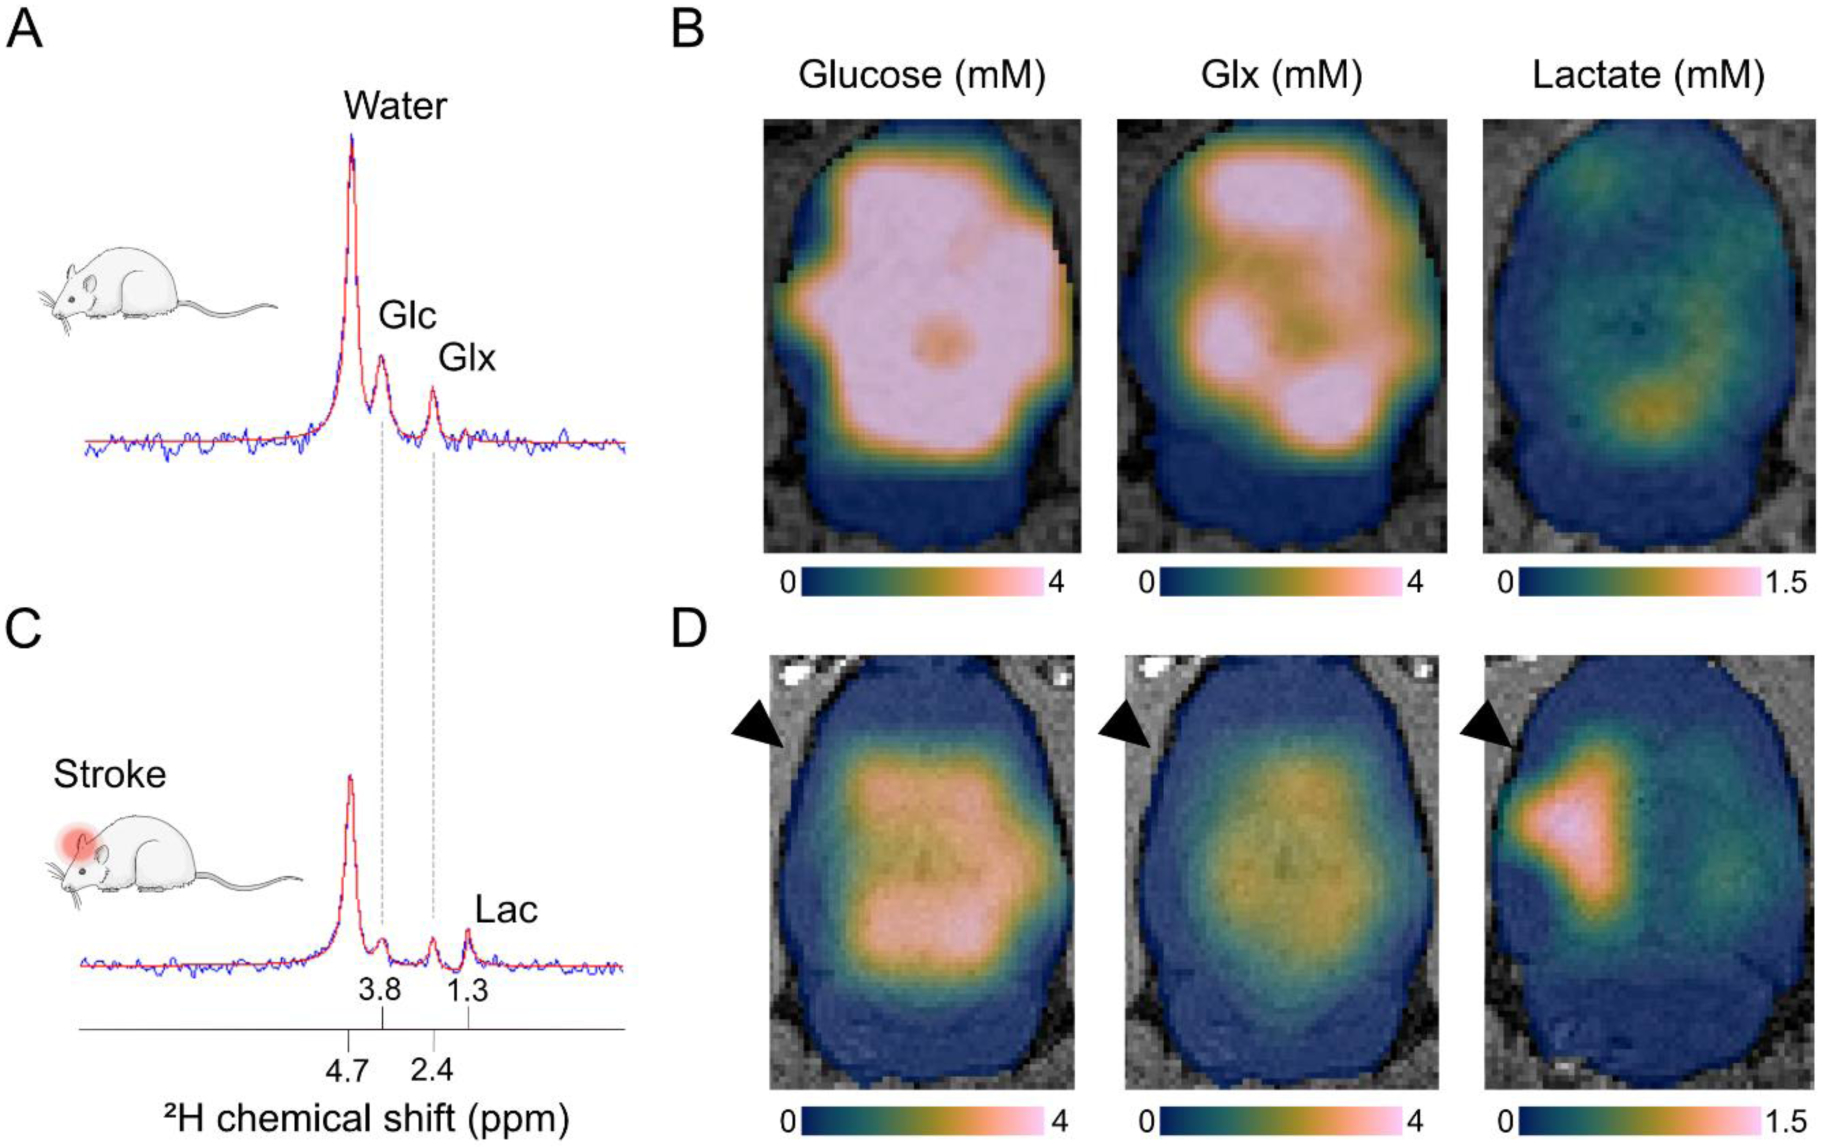
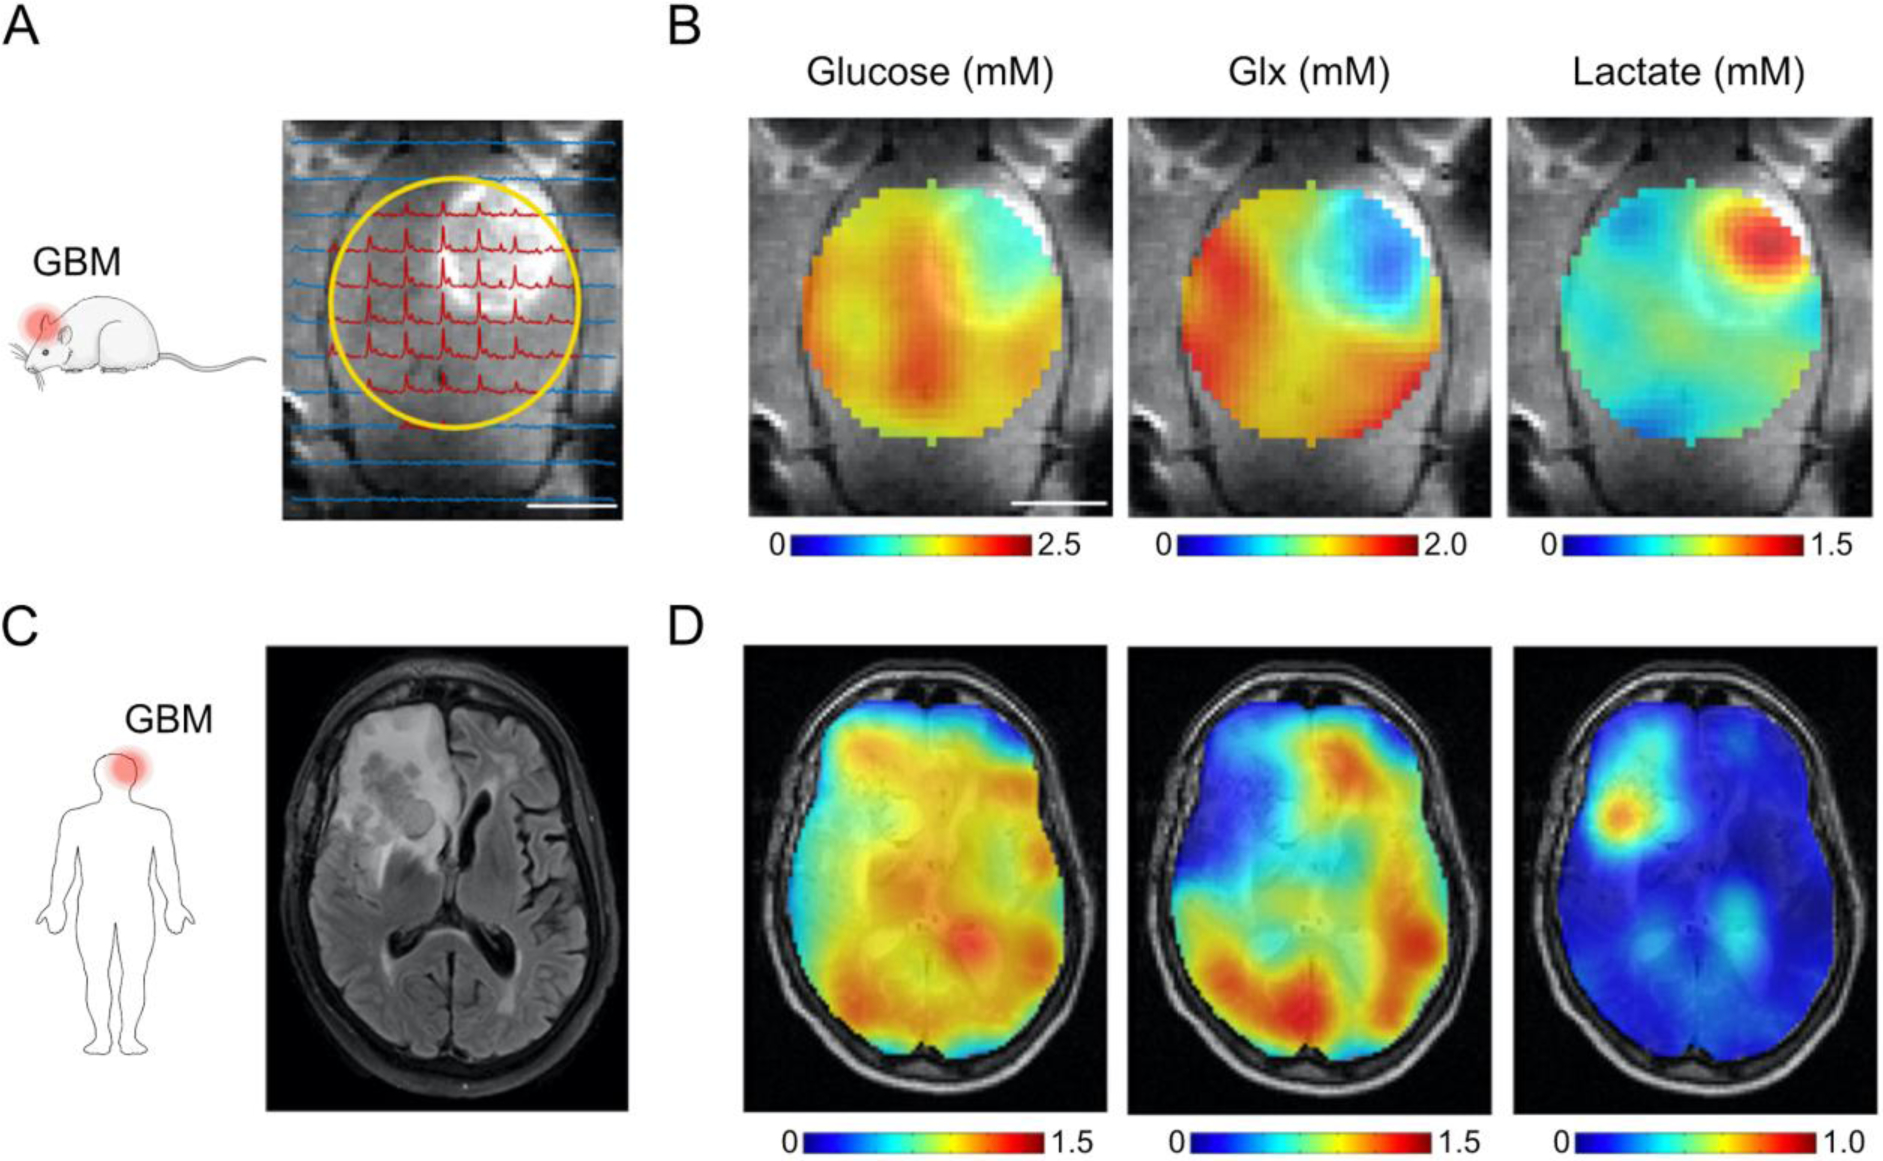
Altered brain metabolism contributes to pathophysiology in cerebrovascular and neurodegenerative diseases such as stroke and Alzheimer's disease. Current clinical tools to study brain metabolism rely on positron emission tomography (PET) requiring specific hardware and radiotracers, or magnetic resonance spectroscopy (MRS) involving technical complexity. In this review we highlight deuterium metabolic imaging (DMI) as a novel translational technique for assessment of brain metabolism, with examples from brain tumor and stroke studies. DMI is an MRS-based method that enables detection of deuterated substrates, such as glucose, and their metabolic products, such as lactate, glutamate and glutamine. It provides additional detail of downstream metabolites compared to analogous approaches like fluorodeoxyglucose (FDG)-PET, and can be implemented and executed on clinical and preclinical MR systems. We foresee that DMI, with future improvements in spatial and temporal resolutions, holds promise to become a valuable MR imaging (MRI) method for non-invasive mapping of glucose uptake and its downstream metabolites in healthy and diseased brain.

Keywords: MR spectroscopy; MRI; brain metabolism; deuterium; stroke; tumor.


Figures

Figure 1.
Figure 1.
DMI captures altered glucose metabolism after ischemic stroke in rats. We acquired steady state DMI data at 9.4 T with 3 × 3 × 3 mm3 = 27 μl nominal spatial resolution in approximately 35 min (repetition time = 400 ms; 8 averages). A) A typical single-voxel DMI spectrum from a healthy rat brain acquired at 60–90 minutes after start of intravenous infusion with 2H-labeled glucose (1.95 g/kg in 120 minutes). B) Maps of glucose uptake and metabolic products, i.e. glutamate and glutamine (Glx) and lactate, across the healthy rat brain reveal even distribution of glucose delivery and uptake and oxidative phosphorylation (reflected by the Glx pool), while anaerobic glycolysis (i.e. lactate formation) is minimal. C) A DMI spectrum from a single-voxel placed in a rat’s ischemic brain hemisphere shortly after unilateral middle cerebral artery occlusion shows active lactate formation, indicative of anaerobic glucose metabolism. The infusion of 2H-labeled glucose was started directly after occlusion of the middle cerebral artery. D) Acutely after stroke induction, we observed lactate formation in and around the ischemic lesion coupled with reduction in oxidative phosphorylation indicated by a lowered Glx signal. In B and D, color-coded (Crameri, 2020) glucose and metabolite maps, expressed in millimolar concentrations, are overlaid on T2-weighted anatomical MR images of the brain. The black arrowheads mark the ischemic hemisphere. Abbreviations: Glc = glucose, Glx = glutamate & glutamine, Lac = lactate.
Figure 2.
Figure 2.
DMI depicts the Warburg effect in experimental and clinical glioblastoma multiforme (GBM). A) Contrast-enhanced T1-weighted MRI shows hyperintense signal from tumor tissue in a rat glioma model. Surface radiofrequency coil position for DMI (yellow circle) and localized 2H MR spectra are overlaid onto the MR image. B) Maps of glucose uptake and downstream metabolites, i.e. glutamate and glutamine (Glx) and lactate, reveal active Warburg effect in and around the brain tumor after intravenous infusion of 1.95 g [6,6′]-2H2-glucose per kg body weight. C) Standard-of-care T2-weighted fluid-attenuated inversion recovery MR image from a patient diagnosed with GBM in the right frontal lobe. D) Glucose and metabolite maps overlaid onto T2-weighted MRI show lower levels of 2H-labeled Glx and higher concentration of 2H-labeled lactate in and around the tumor lesion compared to normal-appearing brain tissue, similar to the metabolite maps from the rat glioma model in (B). Subjects orally ingested 0.60–0.75 g [6,6′]-2H2-glucose per kg body weight, with a maximum of 60 g. Color-coded glucose, Glx and lactate maps are expressed in millimolar concentrations. Abbreviations: Glc = glucose, Glx = glutamate & glutamine, Lac = lactate. Figure adapted from De Feyter et al. (2018) with authors’ permission.

References

    1. Crameri F, 2020. Scientific colour maps. Zenodo. 10.5281/zenodo.4153113 - DOI
    1. Cunnane SC, Trushina E, Morland C, Prigione A, Casadesus G, Andrews ZB, Beal MF, Bergersen LH, Brinton RD, de la Monte S, Eckert A, Harvey J, Jeggo R, Jhamandas JH, Kann O, la Cour CM, Martin WF, Mithieux G, Moreira PI, Murphy MP, Nave KA, Nuriel T, Oliet SHR, Saudou F, Mattson MP, Swerdlow RH, Millan MJ, 2020. Brain energy rescue: an emerging therapeutic concept for neurodegenerative disorders of ageing. Nat. Rev. Drug Discov 19, 609–633. https://doi: 10.1038/s41573-020-0072-x - DOI - PMC - PubMed
    1. De Feyter HM, Behar KL, Corbin ZA, Fulbright RK, Brown PB, McIntyre S, Nixon TW, Rothman DL, De Graaf RA, 2018. Deuterium metabolic imaging (DMI) for MRI-based 3D mapping of metabolism in vivo. Sci. Adv 4, 1–12. 10.1126/sciadv.aat7314 - DOI - PMC - PubMed
    1. de Graaf RA, Hendriks AD, Klomp DWJ, Kumaragamage C, Welting D, Arteaga de Castro CS, Brown PB, McIntyre S, Nixon TW, Prompers JJ, De Feyter HM, 2020. On the magnetic field dependence of deuterium metabolic imaging. NMR Biomed. 33, 1–9. 10.1002/nbm.4235 - DOI - PMC - PubMed
    1. Detre JA, Subramanian VH, Mitchell MD, Smith DS, Kobayashi A, Zaman A, Leigh JS, 1990. Measurement of regional cerebral blood flow in cat brain using intracarotid 2H2O and 2H NMR imaging. Magn. Reson. Med 14, 389–395. 10.1002/mrm.1910140223 - DOI - PubMed

Publication types