

Peak trabecular bone microstructure predicts rate of estrogen-deficiency-induced bone loss in rats
- PMID: 33493654
- PMCID: PMC7920939
- DOI: 10.1016/j.bone.2021.115862
Peak trabecular bone microstructure predicts rate of estrogen-deficiency-induced bone loss in rats
Abstract
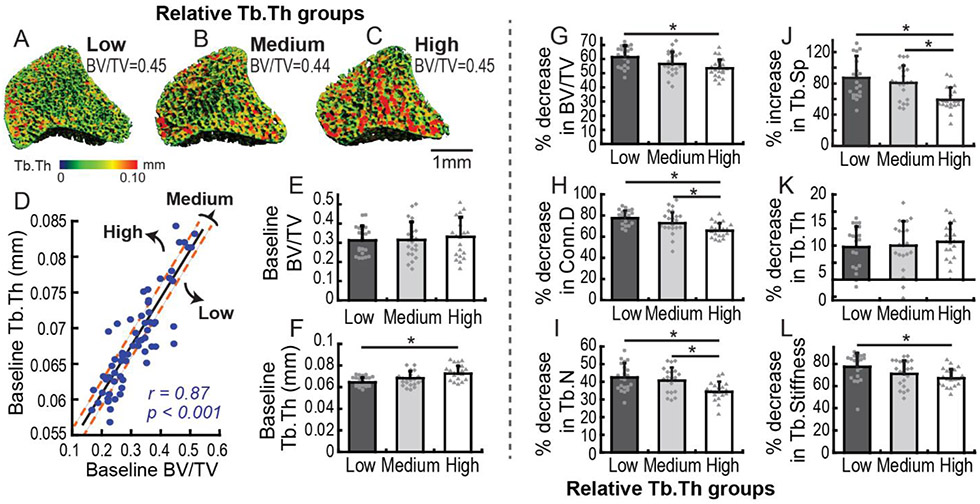
Postmenopausal osteoporosis affects a large number of women worldwide. Reduced estrogen levels during menopause lead to accelerated bone remodeling, resulting in low bone mass and increased fracture risk. Both peak bone mass and the rate of bone loss are important predictors of postmenopausal osteoporosis risk. However, whether peak bone mass and/or bone microstructure directly influence the rate of bone loss following menopause remains unclear. Our study aimed to establish the relationship between peak bone mass/microstructure and the rate of bone loss in response to estrogen deficiency following ovariectomy (OVX) surgery in rats of homogeneous background by tracking the skeletal changes using in vivo micro-computed tomography (μCT) and three-dimensional (3D) image registrations. Linear regression analyses demonstrated that the peak bone microstructure, but not peak bone mass, was highly predictive of the rate of OVX-induced bone loss. In particular, the baseline trabecular thickness was found to have the highest correlation with the degree of OVX-induced bone loss and trabecular stiffness reduction. Given the same bone mass, the rats with thicker baseline trabeculae had a lower rate of trabecular microstructure and stiffness deterioration after OVX. Moreover, further evaluation to track the changes within each individual trabecula via our novel individual trabecular dynamics (ITD) analysis suggested that a trabecular network with thicker trabeculae is less likely to disconnect or perforate in response to estrogen deficiency, resulting a lower degree of bone loss. Taken together, these findings indicate that the rate of estrogen-deficiency-induced bone loss could be predicted by peak bone microstructure, most notably the trabecular thickness. Given the same bone mass, a trabecular bone phenotype with thin trabeculae may be a risk factor toward accelerated postmenopausal bone loss.
Keywords: Bone loss predictor; Bone mechanical properties; Bone microstructure; In vivo micro-computed tomography; Osteoporosis; Ovariectomy.
Copyright © 2021 Elsevier Inc. All rights reserved.
Conflict of interest statement
Conflict of Interest:
The authors declare that they have no conflict of interest.
Figures


References
-
- Kanis JA, Melton LJ III, Christiansen C, Johnston CC, Khaltaev N. The diagnosis of osteoporosis. Journal of bone and mineral research. 1994;9(8): 1137–41. - PubMed
-
- Health UDo, Services H. Bone health and osteoporosis: a report of the Surgeon General. Rockville, MD: US Department of Health and Human Services, Office of the Surgeon General. 2004;87. - PubMed
-
- Lane NE. Epidemiology, etiology, and diagnosis of osteoporosis. American journal of obstetrics and gynecology. Feb 2006;194(2 Suppl):S3–11. - PubMed
-
- Wright NC, Saag KG, Dawson-Hughes B, Khosla S, Siris ES. The impact of the new National Bone Health Alliance (NBHA) diagnostic criteria on the prevalence of osteoporosis in the USA. Osteoporosis international : a journal established as result of cooperation between the European Foundation for Osteoporosis and the National Osteoporosis Foundation of the USA. April 2017;28(4): 1225–32. - PubMed
-
- Bouillon R, Burckhardt P, Christiansen C, Fleisch H, Fujita T, Gennari C, et al. Consensus development conference: prophylaxis and treatment of osteoporosis. Am J Med. 1991;90:107–10. - PubMed
Publication types
MeSH terms
Substances
Grants and funding
LinkOut - more resources
Full Text Sources
Other Literature Sources
