. 2021 Mar;591(7849):293-299.
doi: 10.1038/s41586-021-03237-4. Epub 2021 Jan 25.

Loss of furin cleavage site attenuates SARS-CoV-2 pathogenesis

Affiliations

Loss of furin cleavage site attenuates SARS-CoV-2 pathogenesis

Bryan A Johnson et al. Nature. 2021 Mar.

Abstract

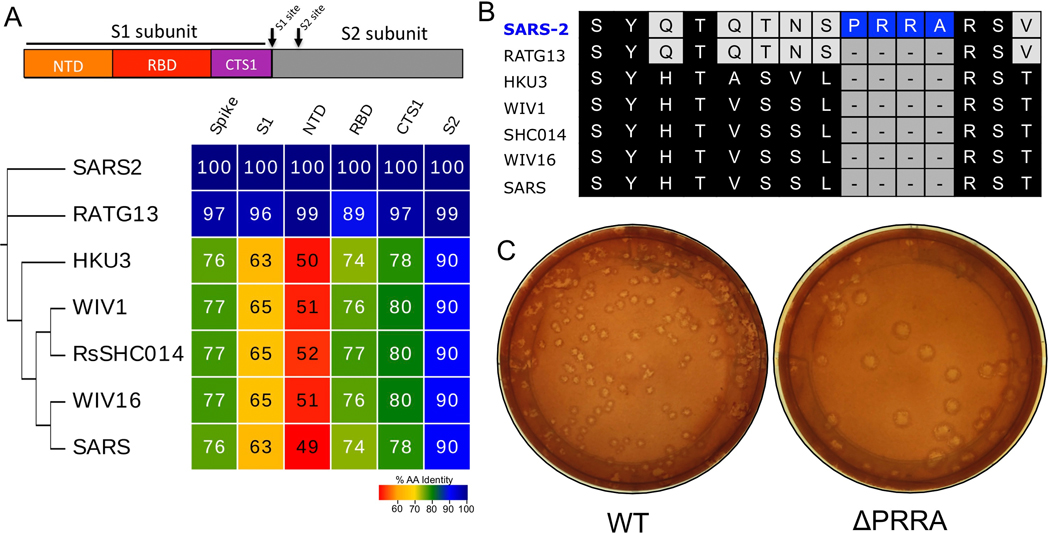
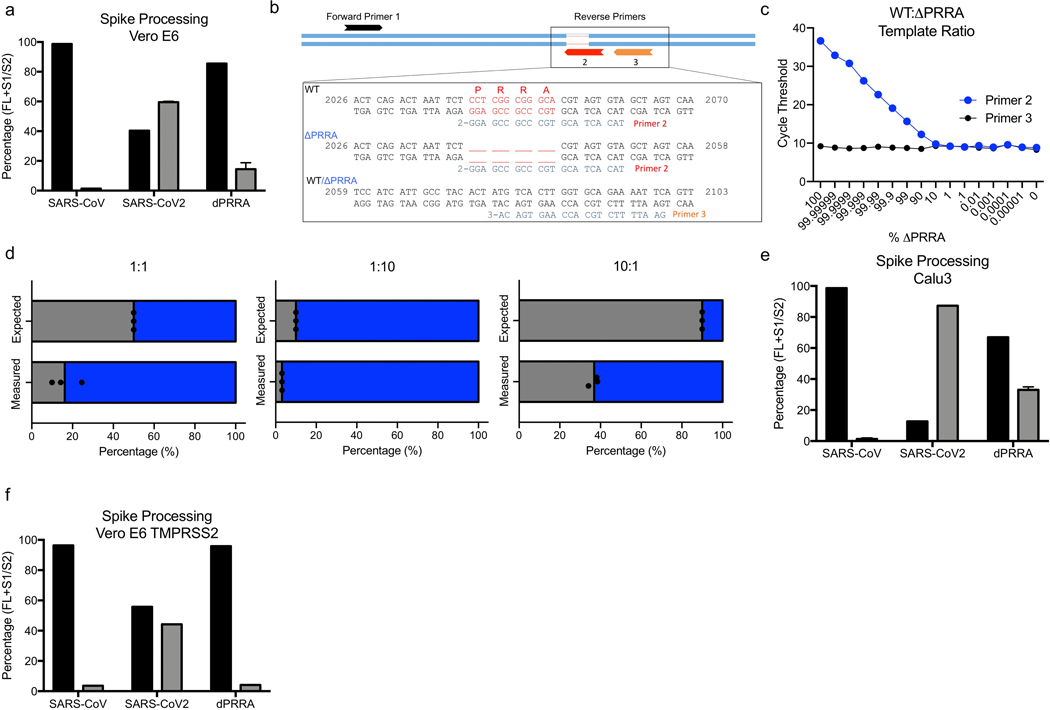
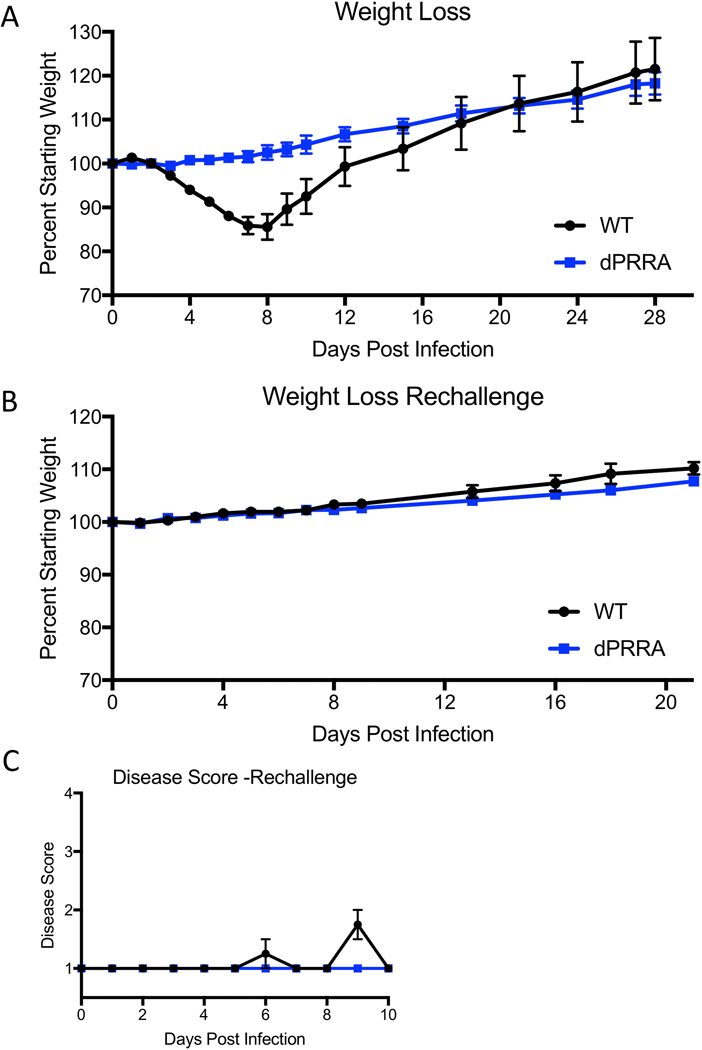
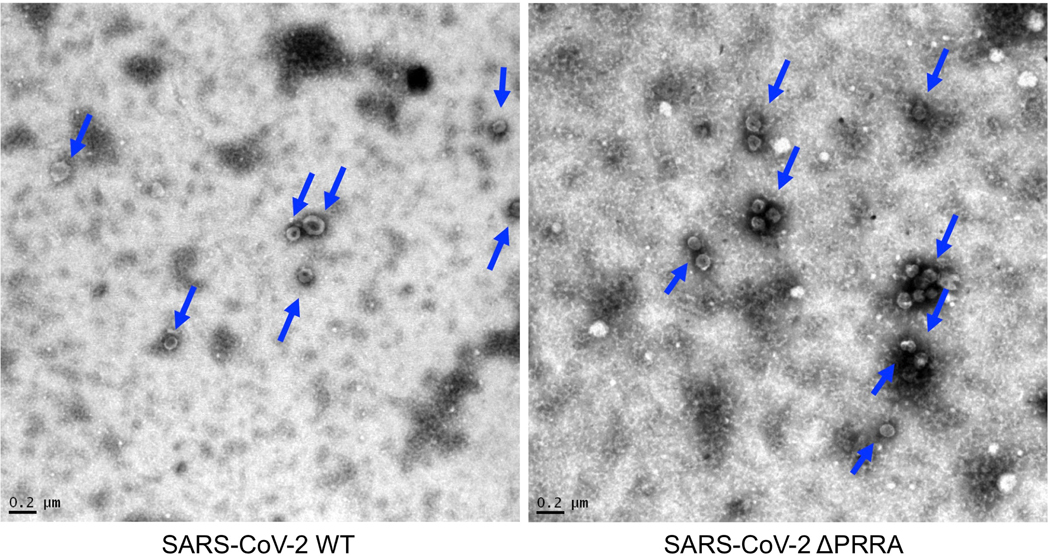
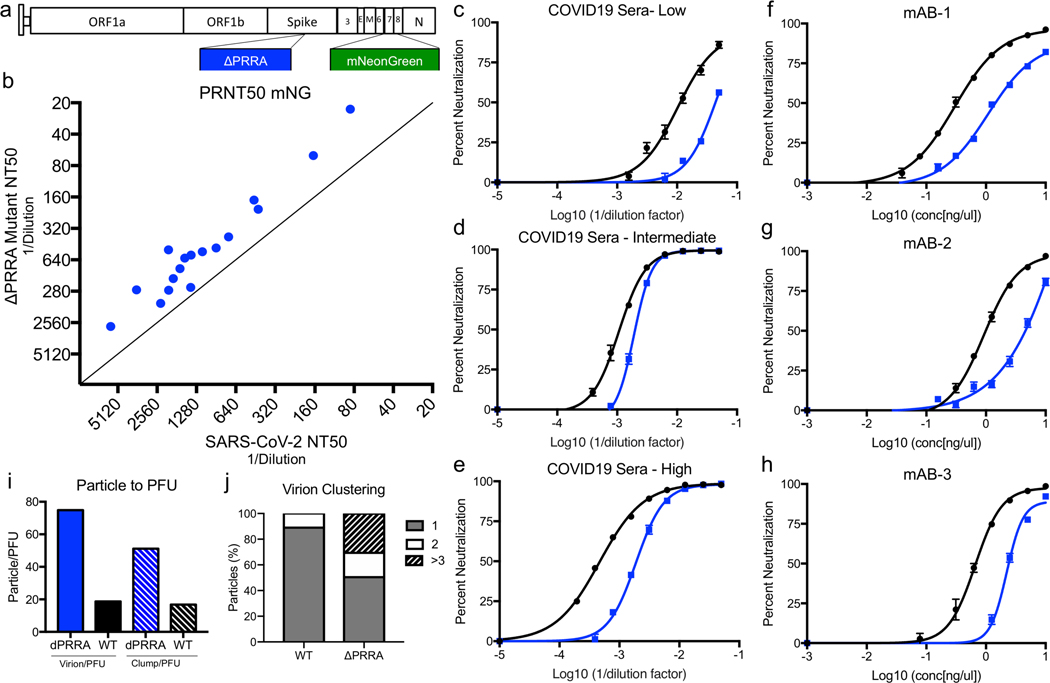
Severe acute respiratory syndrome coronavirus 2 (SARS-CoV-2)-a new coronavirus that has led to a worldwide pandemic1-has a furin cleavage site (PRRAR) in its spike protein that is absent in other group-2B coronaviruses2. To explore whether the furin cleavage site contributes to infection and pathogenesis in this virus, we generated a mutant SARS-CoV-2 that lacks the furin cleavage site (ΔPRRA). Here we report that replicates of ΔPRRA SARS-CoV-2 had faster kinetics, improved fitness in Vero E6 cells and reduced spike protein processing, as compared to parental SARS-CoV-2. However, the ΔPRRA mutant had reduced replication in a human respiratory cell line and was attenuated in both hamster and K18-hACE2 transgenic mouse models of SARS-CoV-2 pathogenesis. Despite reduced disease, the ΔPRRA mutant conferred protection against rechallenge with the parental SARS-CoV-2. Importantly, the neutralization values of sera from patients with coronavirus disease 2019 (COVID-19) and monoclonal antibodies against the receptor-binding domain of SARS-CoV-2 were lower against the ΔPRRA mutant than against parental SARS-CoV-2, probably owing to an increased ratio of particles to plaque-forming units in infections with the former. Together, our results demonstrate a critical role for the furin cleavage site in infection with SARS-CoV-2 and highlight the importance of this site for evaluating the neutralization activities of antibodies.


Conflict of interest statement

Competing interests

XX, P-YS, and VDM have filed a patent on the reverse genetic system and reporter SARS-CoV-2. Other authors declare no competing interests. M.S.D. is a consultant for Inbios, Vir Biotechnology, NGM Biopharmaceuticals, and on the Scientific Advisory Board of Moderna and Immunome. The Diamond laboratory has received unrelated funding support in sponsored research agreements from Moderna, Vir Biotechnology, and Emergent BioSolutions.

Figures

Extended Data Figure 1.
Extended Data Figure 1.. Furin cleavage site in SARS-CoV-2 spike.
A) Diagram of the coronavirus spike protein domains and cleavage sites. The sequences of the indicated group 2B coronaviruses were aligned according to the bounds of total spike, S1, N-terminal domain (NTD), Receptor binding domain (RBD), and C-terminal of S1 (CTS1) and S2. Sequence identities were extracted from the alignments, and a heatmap of sequence identity was constructed using EvolView (www.evolgenius.info/evolview) with SARS-CoV-2 WA1 as the reference sequence. B) Alignment of the furin cleavage site of SARS-CoV-2 and the corresponding amino acids identities found closely related group 2B CoVs. The PRRA insertion is unique to SARS-CoV-2 C) Representative plaque morphology of WT and ΔPRRA SARS-CoV-2.
Extended Data Figure 2.
Extended Data Figure 2.. ΔPRRA mutant processing and competition with WT.
A) Quantitation by densitometry of the full-length spike (Black) and S1/S2 cleavage form (Gray) from distinct western blot experiments in Vero E6 cells (n=2). B) Schematic of quantitative RT-PCR approach to detect deletion of the furin cleavage site. C) Primer curve validation with mixed WT to ΔPRRA plasmid ratio showing sensitivity. D) Deep sequencing results from ΔPRRA and WT competition assays based on percentage of total reads in that region (N=3). E) Quantitation by densitometry of the full-length spike (Black) and S1/S2 cleavage form (Gray) from distinct western blot experiments from Calu3 (n=2). F) Quantitation by densitometry of the full-length spike (Black) and S1/S2 cleavage form (Gray) from distinct western blot experiments from Vero E6 cell expressing TMPRSS2 (n=2). Data are presented as mean values.
Extended Data Figure 3.
Extended Data Figure 3.. In vivo attenuation of ΔPRRA mutant.
a) Weight loss following primary WT and ΔPRRA mutant SARS-CoV-2 challenge (N=4 per group). b & c)Weight loss (b) and disease score (c) following rechallenge of WT and ΔPRRA mutant infected mice with WT SARS-CoV-2 (N=4 per group). Data are presented as mean values +/−SEM.
Extended Data Figure 4.
Extended Data Figure 4.. In vivo attenuation of ΔPRRA mutant in K18-hACE2 mice.
a-d) Lung function evaluated using flexivent for a) tissue damping, b) respiratory resistance c) tissue elastance, and d) Newtonian resistance. (a-d) N= 10 for WT and 8 for ΔPRRA. E) Whole lung histopathology sections seven days post infection from I) mock, J) WT and K) dPRRA infected mice with least (left) and most (right) severe sections as representative samples from 3 mock, 2 WT, and 3 ΔPRRA infected mice F) Chemokine/cytokine analysis of mouse lung seven days post infection with mock (open), WT (black), or ΔPRRA SARS-CoV-2. N=8 for all groups. P-values based on a two-tailed Mann-Whitney (a-d) or a two-tailed student T-test (f) relative to control. Data are presented as mean values +/−SEM. Scale bar represents 5mm.
Extended Data Figure 5.
Extended Data Figure 5.. ΔPRRA Virion Morphology and Clumping.
Transmission electron microscopy of WT (left) and ΔPRRA (right) SARS-CoV-2 with arrows signifying individual virion particles. Images representative of two preparations and 40 individual images observed for WT and ΔPRRA mutant. Scale bar represents 0.2 μm.
Figure 1.
Figure 1.. Distinct replication, spike cleavage, and competition for ΔPRRA.
a) SARS-CoV-2 schematic to delete the furin cleavage site. b) SARS-CoV-2 trimer (grey) with PRRA deletion mutant monomer overlaid (red). The loop (inset) shows WT SARS-CoV-2 (cyan) with the PRRA sequence (blue) and PRRA deletion mutant (pink). Models were generated using SARS-CoV structure (PDB 6ACD). c) Viral titer from Vero E6 cells infected with WT SARS-CoV-2 (black) or ΔPRRA (blue) at MOI 0.01 (N=3). d) Purified SARS-CoV, SARS-CoV-2 WT, and ΔPRRA virions from Vero E6 cells probed with anti-spike (Top panel) or anti-nucleocapsid antibody (lower panel). Full length (FL), S1/S2 cleavage form, and S2’ annotated. Results representative of two independent experiments. e) Competition assay between SARS-CoV-2 WT (black) and ΔPRRA (blue) showing RNA percentage based on quantitative RT-PCR at 50:50, 90:10, and 10:90 WT/ΔPRRA ratio (N=3 per group). f) Viral titer from Calu3 2B4 cells infected with WT SARS-CoV-2 (black) or ΔPRRA (blue) at MOI 0.01 (N=3). g) Purified SARS-CoV, SARS-CoV-2 WT, and ΔPRRA virions from Calu3 2B4 cells probed with anti-spike (top panel) or anti-nucleocapsid antibody (lower panel). Results representative of two independent experiments. h) Viral titer from Vero E6 cells expressing TMPRSS2 infected with WT SARS-CoV-2 (black) or ΔPRRA (blue) at MOI 0.01 (N=5). i) Competition assay between SARS-CoV-2 WT (black) and ΔPRRA (blue) on Vero E6 cells expressing TMPRSS2 showing RNA percentage based on quantitative RT-PCR at 50:50 WT/ΔPRRA ratio (N=3 per group). j) Purified SARS-CoV, SARS-CoV-2 WT, and ΔPRRA virions from Vero E6 cells expressing TMPRSS2 probed with anti-spike (Top) or anti-nucleocapsid antibody (lower). Results representative of two independent experiments. Data presented as mean values +/− SD in c, e, f, h and i. P-values based on a two-tailed Student T-test.
Figure 2.
Figure 2.. Hamster infections with ΔPRRA mutant.
a, Primary SARS-CoV-2 challenge schematic. Two groups of male hamsters (N=4) were challenged with 105 plaque forming units (PFU) of either SARS-CoV-2 WT or ΔPRRA mutant and evaluated (b) weight loss, (c) disease score, (d) viral titer from nasal wash and (e) viral RNA from oral swabs. f-k, Twenty eight DPI, hamsters infected with SARS-CoV-2 WT or ΔPRRA were rechallenged with 105 PFU of SARS-CoV-2 WT and evaluated for (f) weight loss, (g) viral titer from nasal wash, (h) viral RNA from oral swabs, and (i) PRNT50 dilution from primary and rechallenge hamster sera. Data presented as mean values +/− SEM. P-values based on a two-tailed Student T-test.
Figure 3.
Figure 3.. Infection of K18-hACE2 transgenic mice with ΔPRRA mutant.
a, SARS-CoV-2 challenge schematic created with BioRender. Male and female mice were challenged with 103 PFU of SARS-CoV-2 WT (black) or ΔPRRA mutant (blue) and evaluated for (b) weight loss (N=12 for both groups), viral RNA from the (c) lung (d) nasal turbinate, (e) nasal wash, and (f) brain. N=9 for WT and 11 ΔPRRA D2, N=11 for both at D4. g-h, Lung function evaluated using Flexivent mechanical ventilator to assess (g) inspiratory capacity, and (h) pressure/volume (PV) loop. N= 10 for WT and 9 for ΔPRRA. i-k, Lung histopathology 7 DPI from (i) mock, (j) WT and (k) ΔPRRA infected mice. Images represent lung sections from 3 mock, 3 WT, and 3 of ΔPRRA infected mice. l, Chemokine analysis of mouse lung homogenates at 7 DPI with mock (open), WT (black), or ΔPRRA SARS-CoV-2 (blue). N=8 for all groups. Data are presented as mean values +/− SEM. Scale bar represents 250 μm for (i-k). P-values based on a two-tailed Student T-test with unequal variance (b), Kruskal-Wallis Test for multiple comparisons (c-k) or a two-tailed Mann-Whitney test between WT and ΔPRRA (l).
Figure 4.
Figure 4.. Acessing antibody neutralization of ΔPRRA mutant.
a) Schematic for SARS-CoV-2 ΔPRRA reporter virus expressing mNeonGreen (mNG) gene in place of ORF7. b) Plaque reduction neutralization (PRNT50) values measured mNG expression. PRNT50 values plotted as Log (1/serum dilution) with ΔPRRA on Y axis and WT on the X axis. c-e) Representative curves from c) low, d) intermediate, and e) high neutralizing COVID-19 patient sera. N=3. f-h) Neutralization curves from mAB-1 (f), mAB-2 (g), and mAB-3 (h), N=3. i) Particle/PFU ratio determined from 40 fields dividing into individual particle (left) and clusters to determine ratio. j) Percentage of particles as individual virions (1), doubles (2) or larger clusters (>3). Data are presented as mean values +/− SEM.

Update of

Similar articles

Cited by

References

    1. Gralinski LE & Menachery VD Return of the Coronavirus: 2019-nCoV. Viruses 12(2020). - PMC - PubMed
    1. Coutard B, et al. The spike glycoprotein of the new coronavirus 2019-nCoV contains a furin-like cleavage site absent in CoV of the same clade. Antiviral Res 176, 104742 (2020). - PMC - PubMed
    1. Dong E, Du H & Gardner L An interactive web-based dashboard to track COVID-19 in real time. Lancet Infect Dis 20, 533–534 (2020). - PMC - PubMed
    1. Huang C, et al. Clinical features of patients infected with 2019 novel coronavirus in Wuhan, China. Lancet 395, 497–506 (2020). - PMC - PubMed
    1. Gao Z, et al. A Systematic Review of Asymptomatic Infections with COVID-19. J Microbiol Immunol Infect (2020). - PMC - PubMed

Methods References

    1. Harcourt J, et al. Severe Acute Respiratory Syndrome Coronavirus 2 from Patient with 2019 Novel Coronavirus Disease, United States. Emerg Infect Dis 26(2020). - PMC - PubMed
    1. Roberts A, et al. A mouse-adapted SARS-coronavirus causes disease and mortality in BALB/c mice. PLoS pathogens 3, e5 (2007). - PMC - PubMed
    1. Sims AC, et al. Release of severe acute respiratory syndrome coronavirus nuclear import block enhances host transcription in human lung cells. J Virol 87, 3885–3902 (2013). - PMC - PubMed
    1. Josset L, et al. Cell host response to infection with novel human coronavirus EMC predicts potential antivirals and important differences with SARS coronavirus. MBio 4, e00165–00113 (2013). - PMC - PubMed
    1. Xie X, et al. An Infectious cDNA Clone of SARS-CoV-2. Cell host & microbe 27, 841–848 e843 (2020). - PMC - PubMed

Publication types

MeSH terms