. 2021 Mar;591(7848):124-130.
doi: 10.1038/s41586-021-03234-7. Epub 2021 Jan 25.

Global absence and targeting of protective immune states in severe COVID-19

Collaborators, Affiliations

Global absence and targeting of protective immune states in severe COVID-19

Alexis J Combes et al. Nature. 2021 Mar.

Erratum in

  • Publisher Correction: Global absence and targeting of protective immune states in severe COVID-19.
    Combes AJ, Courau T, Kuhn NF, Hu KH, Ray A, Chen WS, Chew NW, Cleary SJ, Kushnoor D, Reeder GC, Shen A, Tsui J, Hiam-Galvez KJ, Muñoz-Sandoval P, Zhu WS, Lee DS, Sun Y, You R, Magnen M, Rodriguez L, Im KW, Serwas NK, Leligdowicz A, Zamecnik CR, Loudermilk RP, Wilson MR, Ye CJ, Fragiadakis GK, Looney MR, Chan V, Ward A, Carrillo S; UCSF COMET Consortium; Matthay M, Erle DJ, Woodruff PG, Langelier C, Kangelaris K, Hendrickson CM, Calfee C, Rao AA, Krummel MF. Combes AJ, et al. Nature. 2021 Aug;596(7872):E8. doi: 10.1038/s41586-021-03718-6. Nature. 2021. PMID: 34341540 Free PMC article. No abstract available.

Abstract

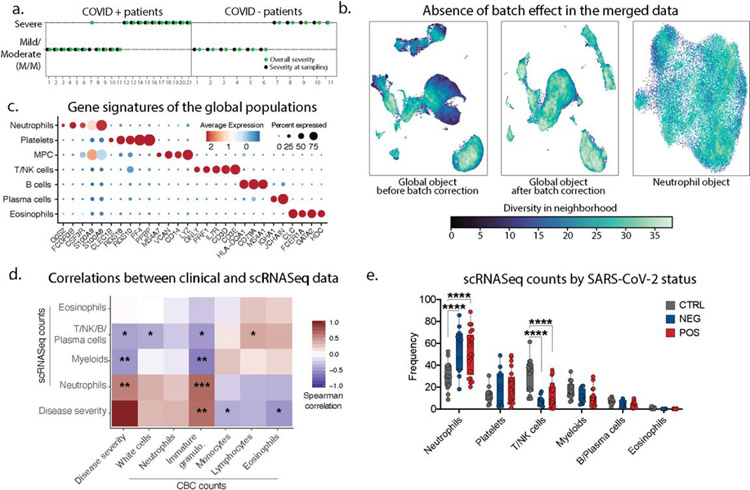
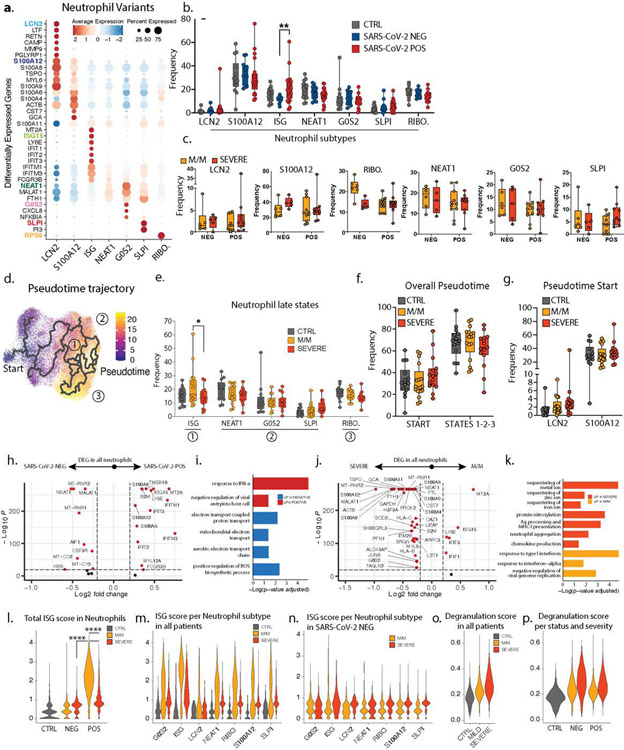
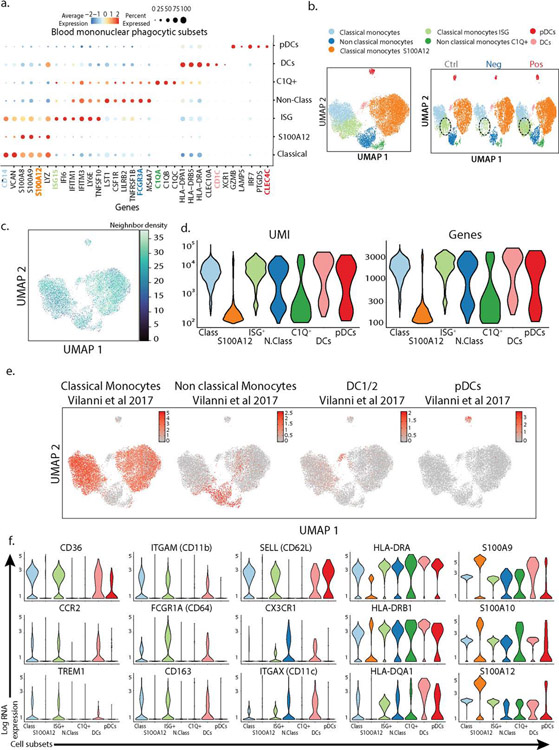
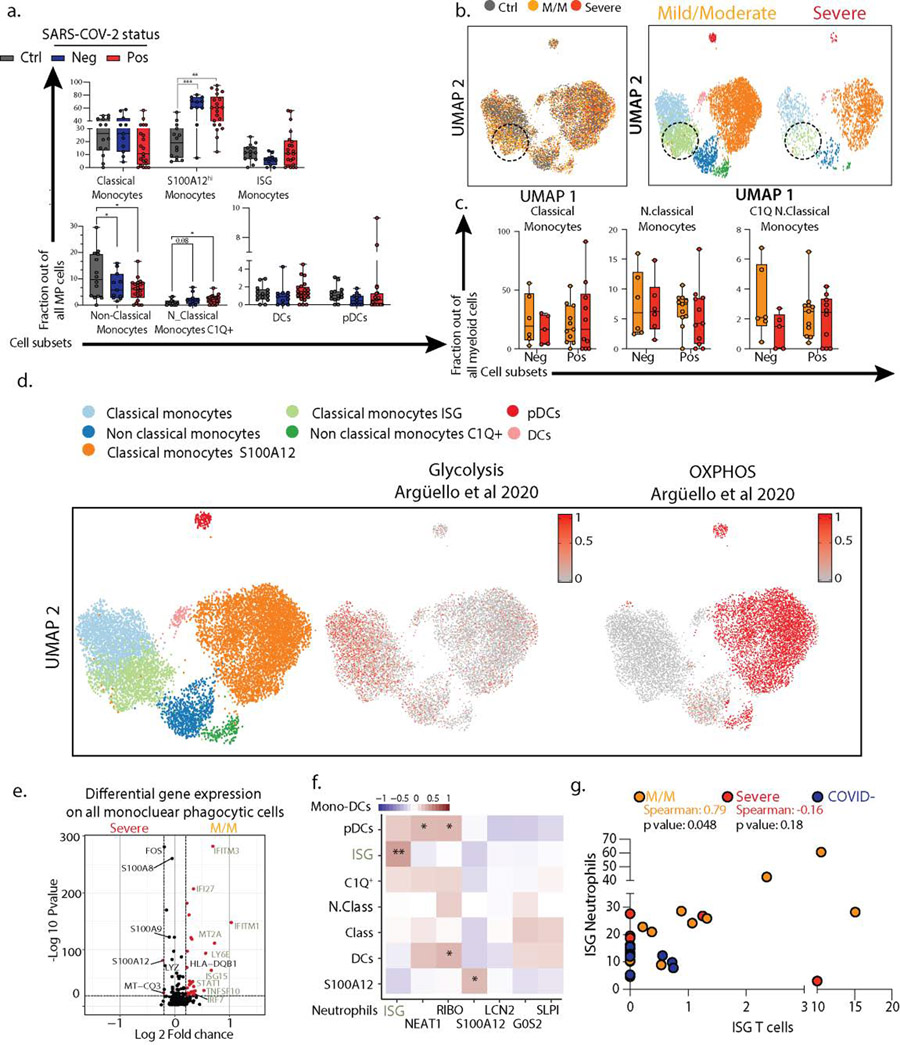
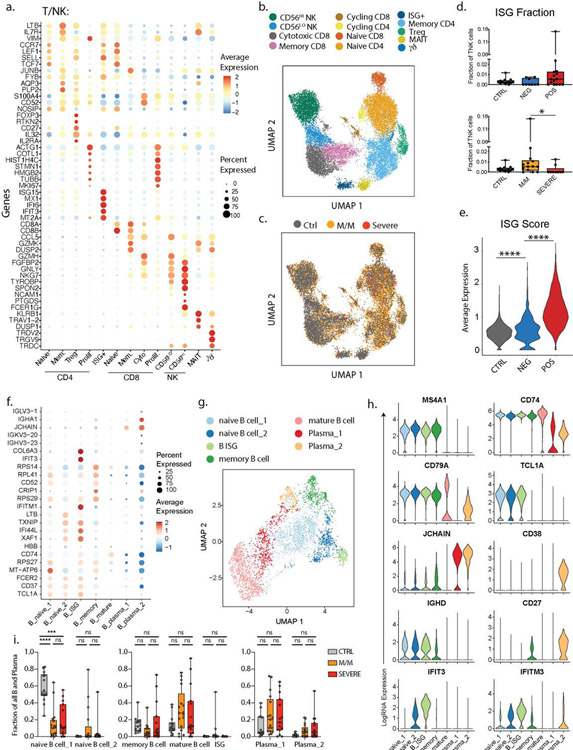
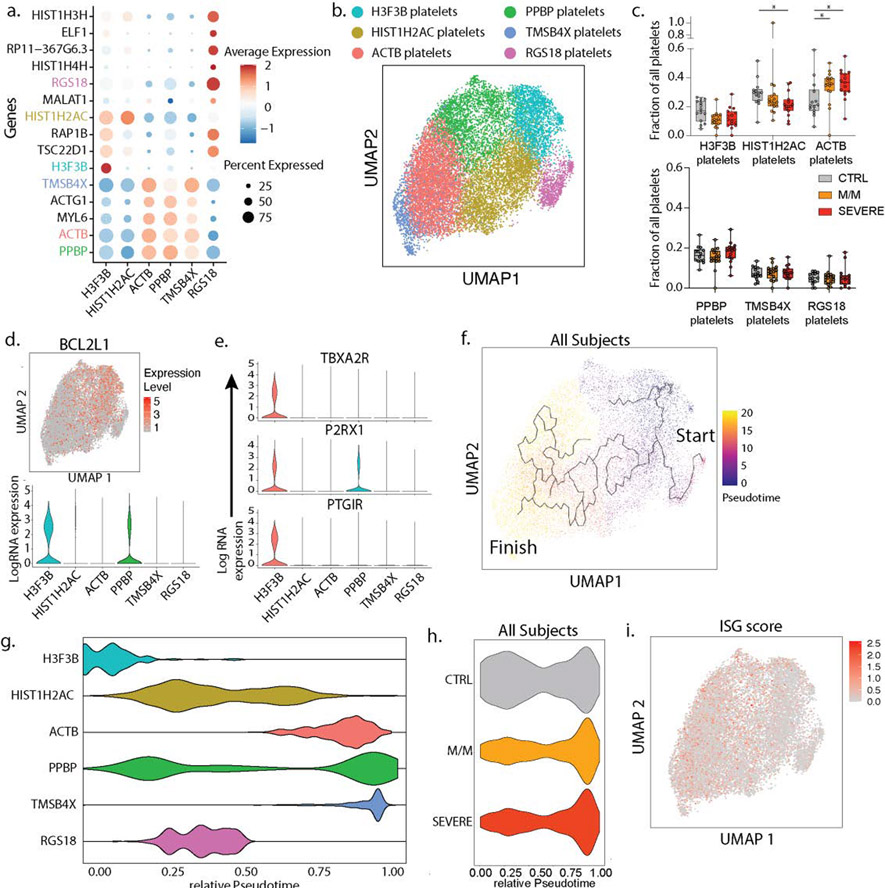
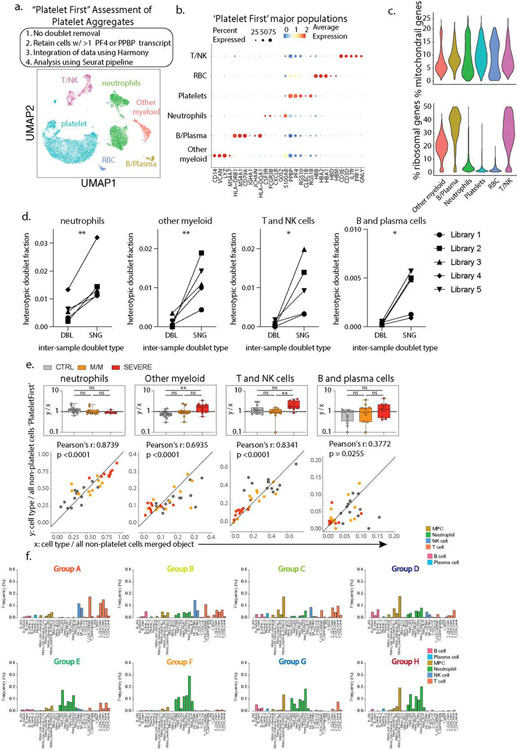
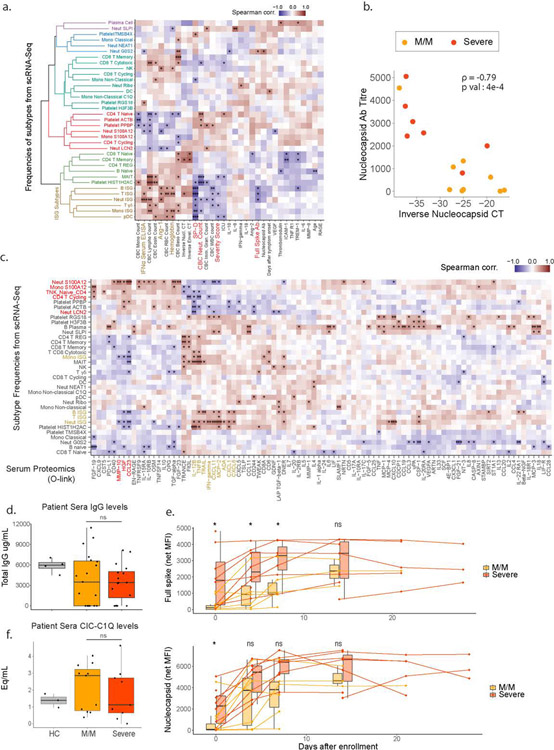
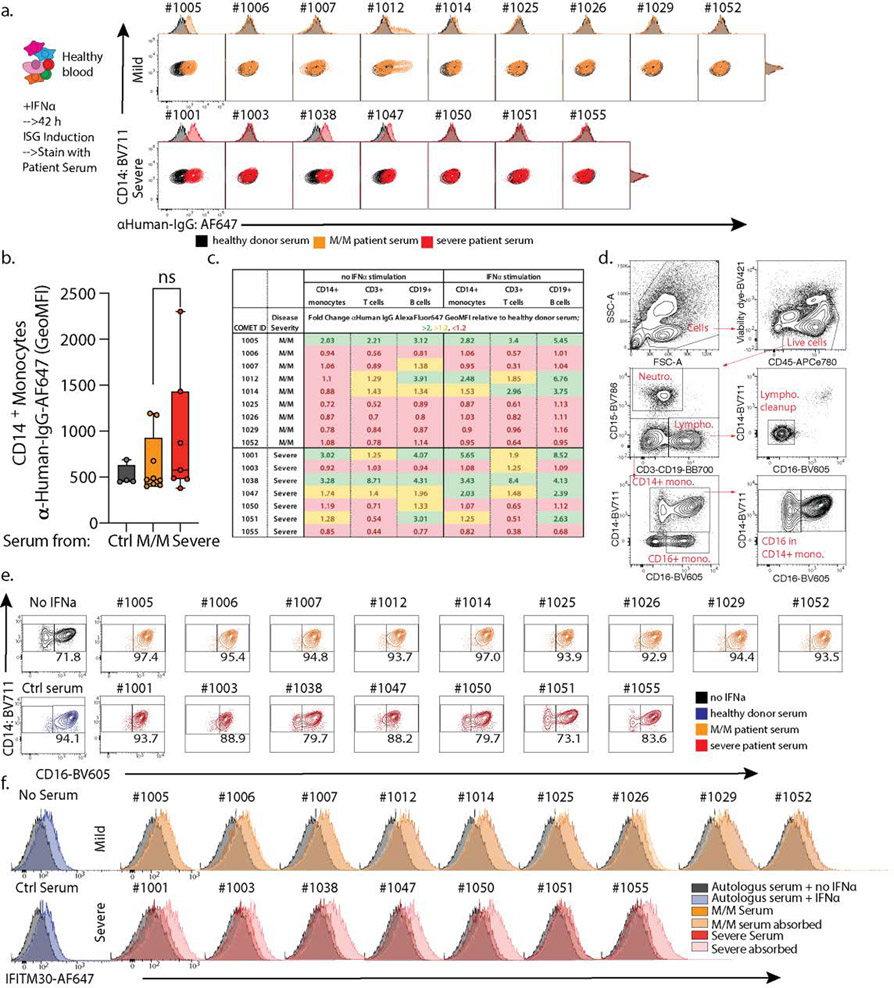
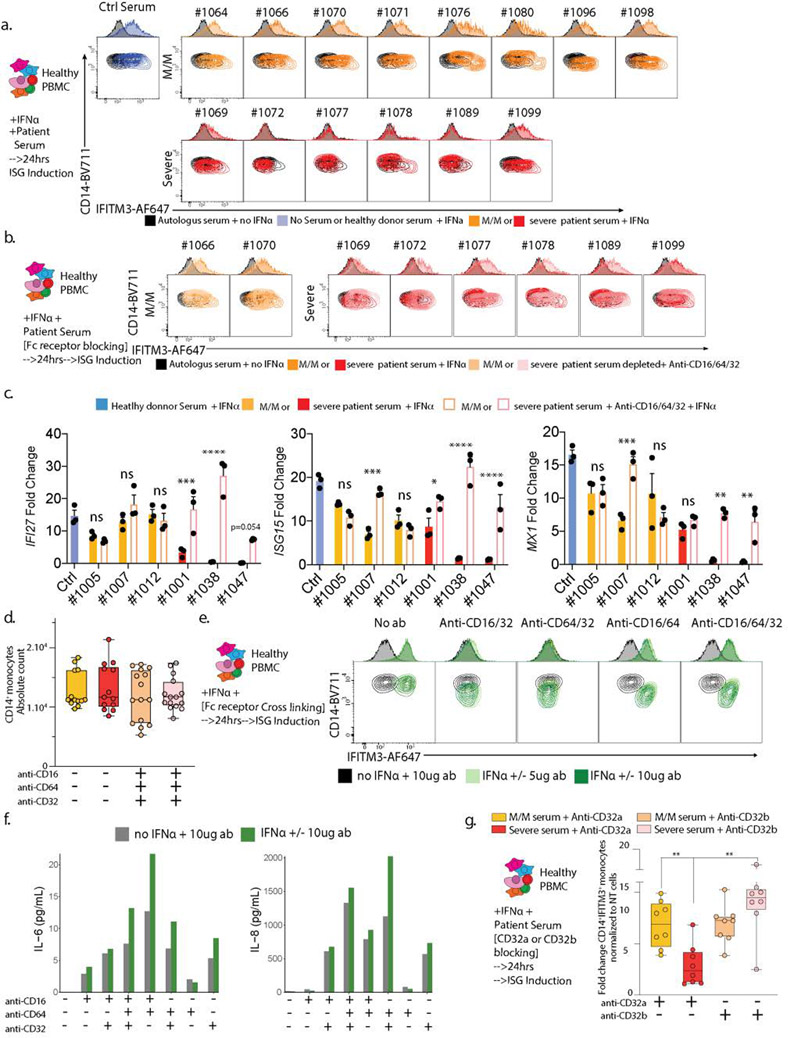
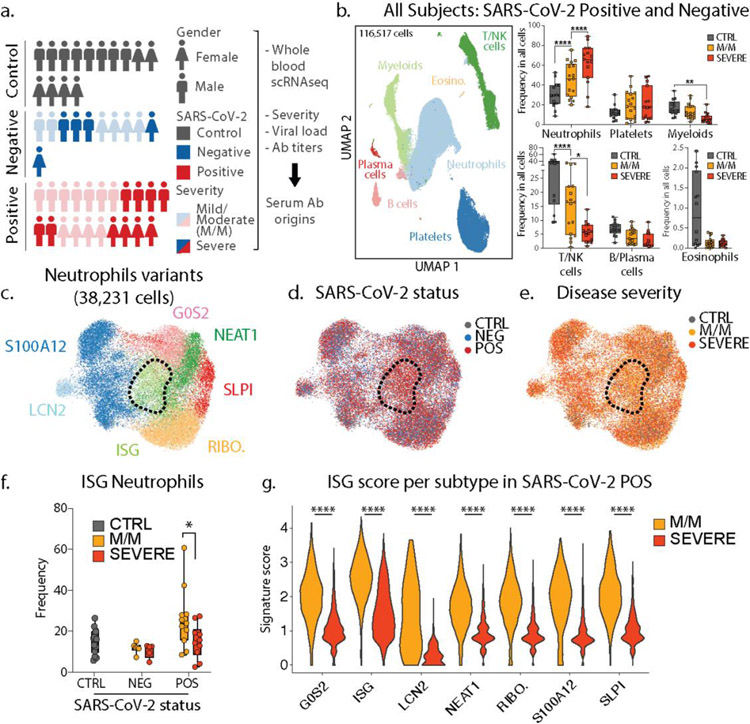
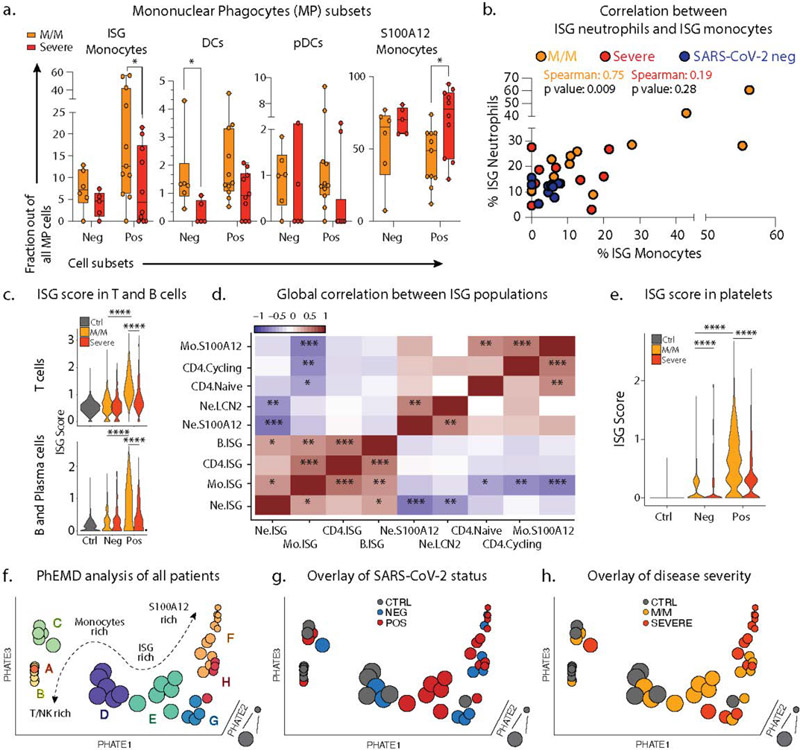
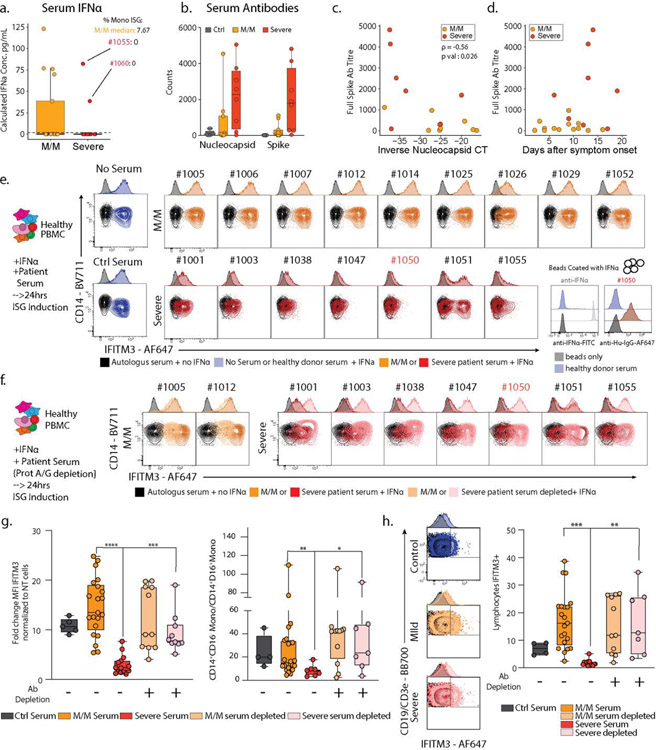
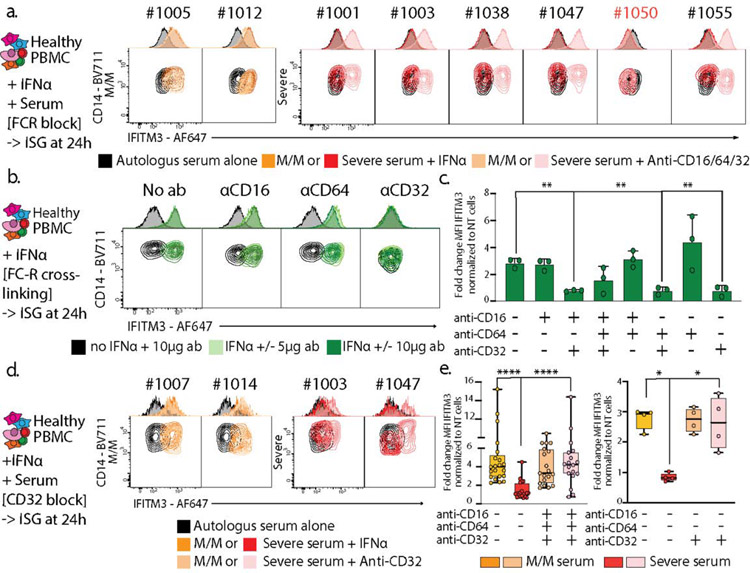
Although infection with severe acute respiratory syndrome coronavirus 2 (SARS-CoV-2) has pleiotropic and systemic effects in some individuals1-3, many others experience milder symptoms. Here, to gain a more comprehensive understanding of the distinction between severe and mild phenotypes in the pathology of coronavirus disease 2019 (COVID-19) and its origins, we performed a whole-blood-preserving single-cell analysis protocol to integrate contributions from all major immune cell types of the blood-including neutrophils, monocytes, platelets, lymphocytes and the contents of the serum. Patients with mild COVID-19 exhibit a coordinated pattern of expression of interferon-stimulated genes (ISGs)3 across every cell population, whereas these ISG-expressing cells are systemically absent in patients with severe disease. Paradoxically, individuals with severe COVID-19 produce very high titres of anti-SARS-CoV-2 antibodies and have a lower viral load compared to individuals with mild disease. Examination of the serum from patients with severe COVID-19 shows that these patients uniquely produce antibodies that functionally block the production of the ISG-expressing cells associated with mild disease, by activating conserved signalling circuits that dampen cellular responses to interferons. Overzealous antibody responses pit the immune system against itself in many patients with COVID-19, and perhaps also in individuals with other viral infections. Our findings reveal potential targets for immunotherapies in patients with severe COVID-19 to re-engage viral defence.


Conflict of interest statement

Conflict of interest Statement

The authors declare no competing financial interests.

Figures

Extended Data 1:
Extended Data 1:. Immune phenotyping of patients admitted with respiratory symptoms using whole blood single-cell RNA sequencing.
a. Patient symptoms plot: symptom at day of sampling (first day of admission to the hospital) is represented in black, while symptom based on the entire course of hospitalization is in green. In the rest of the manuscript, we categorized patient into mild/moderate or severe cases based on all the entire course of hospitalization (green). b. Quantification of the batch effect using neighbor diversity score in the global object UMAP before (left) and after (middle) batch correction, along with the neutrophil (right) UMAP plot, as in Fig1b and Fig1c, using the diversity in neighborhood method. c. Dotplot representation of landmark genes expressed by global populations in Fig1b. d. Spearman’s correlation comparison between disease severity and population frequencies calculated from 10X scRNAseq analyses (10X) or complete blood cell counts (CBC). Patients for which CBC counts were unavailable were excluded. Significance was calculated using Spearman’s method. * p value<0.05; ** p value <0.05; *** p value<0.005 (n=29) e. Frequency of the global populations in Fig1b among all cells across SARS-CoV-2 status (control, n=14; NEG, n=11; POS, n=21).
Extended Data 2:
Extended Data 2:. Patients with severe COVID-19 lack IFN response in neutrophils.
a. Dotplot representation of top differentially-expressed-genes (DEG) between neutrophil subsets. b. Frequencies of neutrophil subsets among all neutrophils across control (n=14), SARS-CoV-2 negative (n=11) and SARS-CoV-2 positive (n=21) individuals. c. Frequency of the LCN2, S100A12, RIBO., NEAT1, G0S2 and SLPI neutrophils among all neutrophils across SARS-CoV-2 status and disease severity (NEG M/M, n=6; NEG severe, n=5; POS M/M, n=11, POS severe n=10). d. Pseudotime trajectory of neutrophil subsets. e. Frequencies of the neutrophil subsets among all neutrophils at later stages of pseudotime trajectories across control (n=14), mild/moderate (n=17) and severe (n=15) individuals. f and g. Frequencies of the neutrophil subsets among all neutrophils across control (n=14), mild/moderate (M/M, n=17) and severe (n=15) individuals at the overall start/late states of the trajectories (f) or at specific early stages of the pseudotime (g). h to k. Volcano plots showing DEG (h and j) and bar plots showing GO term enrichment from these DEG (i and k) between all neutrophils from either SARS-CoV-2 positive vs negative patients (h and i) or mild/moderate vs severe patients (j and k). l to p. Scores of ISG signature (l to n) and neutrophil degranulation (o and p) in either all neutrophils across control, mild/moderate an severe patients (I and o), all neutrophils across SARS-CoV-2 status and disease severity (m and p) or specific neutrophil subtypes across severity in either all patients (m) or only SARS-CoV-2 negative patients (n). Statistical significance was assessed using a two-way ANOVA test with multiple comparisons for panels c, e and g, and using a two-tailed Wilcoxon test for panel l. * p.value < 0.05; ** p.value < 0.01; *** p.value < 0.001; **** p.value < 0.0001. Boxplot center, median; box limits, 25th and 75th percentile; whiskers, min. and max. data point.
Extended Data 3.
Extended Data 3.. Characterization of peripheral blood mononuclear phagocytes subsets in our cohort.
a. Dotplot representation of the top differentially-expressed-genes (DEG) between clusters identified in blood mononuclear phagocytic cell (MPC) subsets. b. UMAP visualization of the 19,289 MPC isolated from the entire dataset (left) and split by SARS-CoV-2 status (right). c. Quantification of the batch effect before and after batch correction using neighbor diversity score in the mononuclear phagocytic cells (MPC) object from UMAP plot in (b), using the diversity in neighborhood method. d. Violin plot of number of unique genes (bottom) and number of unique molecules (top) detected from Single cell sequencing for each cluster identified in the MPC dataset. e. Overlay of previously described blood mononuclear phagocytic cell signature from healthy individual (38) on MPC from UMAP plot in (b). f. Violin plots of canonical genes previously described as expressed by blood MPC for each for each cluster identified in the MPC dataset.
Extended Data 4:
Extended Data 4:. Severe COVID-19 is defined by the lack of a concerted IFN response across multiple cell types.
a. Frequencies of the MPC subsets among all MPC across control (n=14), SARS-CoV-2 negative (n=11) and SARS-CoV-2 positive (n=21) individuals. b. UMAP visualization of the 19,289 MPC colored (left) and split by (right) by disease severity. c. Frequencies of the classical monocytes, cycling monocytes, non-classical monocytes and C1Q+ non classical monocytes among all MPC across SARS-CoV-2 negative (M/M, n=6; severe, n=5) and SARS-CoV-2 positive (M/M, n=11; severe, n=10) individuals split it by disease severity. d. Overlay of previously described (39) glycolytic and oxidative phosphorylation gene signature on mononuclear phagocytic cells (MPC) from UMAP plot in FigS3b. e. Volcano plot showing results of differential gene expression (DGE) analysis performed on all MPC between mild/moderate (right) and severe (left) patients. f. Correlation matrix using Spearman Rank Correlation between the frequency of all neutrophils and monocytes subtypes in all SARS-CoV-2 negative (n=11) and SARS-CoV-2 positive patients (n=21). g. Scatter plot between neutrophil and CD4 T cell ISG positive subsets patient by patient (M/M, n=11; severe, n=10; COVID-, n=11). Statistical significance was assessed using a two-way ANOVA test with multiple comparisons. * p.value < 0.05; ** p.value < 0.01; *** p.value < 0.001; **** p.value < 0.0001. Boxplot center, median; box limits, 25th and 75th percentile; whiskers, min. and max. data point.
Extended Data 5:
Extended Data 5:. Characterization of the peripheral blood T and B lymphocytes subsets in our cohort.
a. Dotplot representation of the top DEG between clusters identified in the T and NK cell subset. b. UMAP visualization of 16,708 T and NK cells in the entire dataset showing various subsets, colored distinctly by their identity. c. Overlay of the above UMAP of all T and NK cells, colored by disease severity underlining the lack of batch effects while merging the datasets from all patients. d. Abundance of the Interferon-stimulated-gene (ISG)+ subset among all T and NK cells in healthy donors (n=13), SARS-CoV-2 negative (n=9) and SARS-CoV-2 positive (n=15) patients (top) and in healthy donors and patients with mild/moderate (M/M, n=14) and severe disease (bottom, n=9). e. ISG signature score between healthy controls, SARS-CoV-2 negative and SARS-CoV-2 positive patients. f. Dotplot representation of the top DEG between clusters identified in the B and plasma cell subset. g. UMAP visualization of 4,380 B and plasma cells isolated from the entire dataset showing various subsets, colored distinctly by their identity. h. Violin plots of canonical genes previously described as expressed by B and plasma cells for each identified cluster. i. Frequencies of the identified clusters among all B and plasma cells in healthy donors (n=14) and patients with M/M (n=17) and severe disease (n=15). Differences in d. and e. were calculated using Kruskal-Wallis test. * p <0.05 and **** p< 0.001. Differences in i. were calculated using a two-way ANOVA test with multiple comparisons. * p.value < 0.05 and **** p.value < 0.0001. ns, non-significant. Boxplot center, median; box limits, 25th and 75th percentile; whiskers, min. and max. data point.
Extended Data 6:
Extended Data 6:. Characterization of the peripheral blood platelets subsets in our cohort.
a. Dotplot representation of the top DEG between clusters identified in the platelet subset. b. UMAP visualization of 16,903 platelets isolated from the entire dataset showing various subsets, colored distinctly by their identity. c. Frequencies of the identified clusters among all platelets in controls (n=14) and all patients with mild/moderate (M/M, n=17) and severe disease (n=15). d. UMAP visualization of all platelets colored by BCL2L1 (top) and violin plot of BCL2L1 expression level across all identified platelet subsets. e. Violin plots of genes identifying young, reticulated platelets (9) in the platelet dataset. f. UMAP visualization of all platelets with overlay of Pseudotime trajectory. g. Violin plots of the relative pseudotime of each platelet cell subset present in Figure 3b h. Violin plot of the relative Pseudotime of all platelets split by healthy donors, mild/moderate and severe patients. i. UMAP visualization of all platelets colored by ISG score. Differences in c. were calculated using a two-way ANOVA test with multiple comparisons. *p.value < 0.05; **p.value < 0.01; ***p.value <0.001; ****p.value < 0.0001; ns: non-significant. Boxplot center, median; box limits, 25th and 75th percentile; whiskers, min. and max. data point.
Extended Data 7:
Extended Data 7:. Leveraging single-cell RNA sequencing to assess platelets aggregates and define immune states in COVID-19 patients.
a. Outline of ‘Platelet First’ assessment to identify platelet aggregates in entire whole blood scRNA-seq data set. UMAP visualization of the 52,757 putative platelet aggregates with specific populations overlaid. b. Dotplot representation of the top DEG between clusters identified in the ‘Platelet First’ object. In this object no doublet removal filtering step was applied to include all heterotypic cell-cell aggregates (Step 1). This was followed by retaining all cells with >1 platelet-specific transcripts PF4 or PPBP (Step 2). Step 2 guaranteed analysis of cell events and aggregates containing platelets. Identically to our original data set in Figure 1b, integration of data was done using Harmony (Step 3), and the ‘Platelet First’ object was then analyzed using the Seurat v3 pipeline (Step 4). c. Violin plots of the percentage of mitochondrial and ribosomal genes within clusters identified in the ‘Platelet First’ object. d. Inter-sample doublet rates in inferred platelet-involved heterotypic doublets show that platelet aggregates occur in vivo. DBL, doublet, n=5 libraries. SNG, singlet, n=5 libraries. e. Bottom: Scatter plot of cell type frequency within merged object of entire cohort shown in Figure 1b (x-axis) versus same cell type frequency within ‘Platelet First’ object (y-axis). The identity line x=y is drawn as a reference. Each dot represents a control (n=14) or SARS-CoV-2 positive patient sample and are color-coded by disease severity (M/M, n=11; severe, n=10). Pearson r correlation coefficient and two-tailed p value are shown for each cell type. Top: Box plots of y/x-ratio for each healthy control or patient sample, separated by disease severity. f. Cell fraction histograms representing bin-wise mean of relative frequency (i.e., cell fraction) of each immune cell subtype for all patients in a given group, colored as described in Fig2f. Differences in d. were calculated using a one-sided Student’s t test * p.value < 0.05 and ** p.value < 0.01. Differences in e. were calculated using a two-way ANOVA test with multiple comparisons. *p.value < 0.05; **p.value < 0.01; ***p.value <0.001; ****p.value < 0.0001; ns: non-significant. Boxplot center, median; box limits, 25th and 75th percentile; whiskers, min. and max. data point.
Extended Data 8:
Extended Data 8:. Holistic assessment of COVID-19 peripheral blood profile combining single-cell RNA sequencing, clinical blood counts and cytokines plasma levels.
a. Matrix of Spearman correlation coefficients between all subtype frequencies (out of major cell types, e.g. Neut ISG out of all Neutrophils) obtained from scRNA-Seq versus patient metadata, viral load, Ab titers, and serum analyte levels on a patient-by-patient basis excluding healthy controls. Patients for which data were unavailable were excluded from correlation analysis for each comparison. Variables on both axes were ordered via hierarchical clustering with the computed dendrogram displayed for subtype frequencies. This dendrogram was divided into 6 groupings with the one containing ISG+ subtypes highlighted in brown. Clinical variables generally correlated with severity highlighted in red and anti-correlated in brown. (n for correlation comparisons ranged from n=14–32 individuals) * p<0.05, ** p<0.005, *** p<0.0005. b. Scatter plots showing viral load versus levels of antibody binding SARS-CoV-2 Nucleocapsid protein for patients in the cohort with severity overlaid. Antibody levels are shown as arbitrary units of MFI from Luminex assay while viral load is represented by an inverse CT number from QRT-PCR with target amplification of the SARS-CoV2 Nucleocapsid sequence. Correlation coefficient and significance calculated using Spearman’s method. Patients for which data was unavailable were excluded (M/M, n=9; severe, n=7 patients). c. Matrix of Spearman correlation coefficients between all subtype frequencies (out of major celltypes e.g. Neut ISG represents % out of all Neutrophils) obtained from scRNA-Seq versus protein analyte abundance in plasma as measured using Olink assay on a patient-by-patient basis excluding healthy controls. Patients for which data were unavailable were excluded from correlation analysis for each comparison. Variables on both axes were ordered via hierarchical clustering. ISG subtypes and protein levels strongly correlated with their frequency highlighted in brown. Subtypes and proteins strongly anti-correlated with ISG+ subtypes highlighted in red. (n=31 for all comparisons). * p<0.05, ** p<0.005, *** p<0.0005. d. Computed total IgG levels in patient sera from ELISA absorbance readings. (n=4/19/16 for HC/MM/Severe) e. Longitudinal measurements of anti-Spike and Nucleocapsid antibody levels in patient sera at the indicated days post-enrollment in study. Connected points represent tracking of a single individual. (n=11/8/7/8/6/7/3/7/1/5/0/3 for MM vs. Severe for D0,4,7,14,21,27 respectively) f. Levels of circulating immune complexes (CIC) in patient sera as measured by ELISA with human C1Q used to capture CIC’s and an anti-hIgG secondary. Levels shown as heat aggregated human gamma globulin equivalents per mL or (Eq/mL). (n=3/11/9 for HC/MM/Severe respectively). Boxplots represent 25/50/75 percentiles. Statistical testing performed using two-sided Wilcoxon rank-sum test. Boxplot center, median; box limits, 25th and 75th percentile; whiskers, min. and max. data point.
Extended Data 9:
Extended Data 9:. Staining and Neutralization assay on IFN-stimulated heathy PBMC using COVID-19 patients’ serum.
a. Contour plots and histograms of CD14+ monocytes from healthy donor blood cultured with IFNa to induce expression of ISGs and stained with serum from heathy donor, mild/moderate (M/M) or severe SARS-CoV-2 positive patients with secondary staining with anti-human IgG. b. Geometric MFI of serum staining on CD14+ monocytes treated with IFNa, quantifying data in Figure S7A. Ctrl, n=4; M/M, n=9; severe, n=7. Boxplot center, median; box limits, 25th and 75th percentile; whiskers, min. and max. data point. c. Summary table of serum staining experiment. Fold change (FC) of anti-Human IgG AlexaFluor647 GeoMFI relative to allogeneic healthy donor serum on non-stimulated and IFNa-stimulated healthy PBMCs is listed for each analyzed cell type. Table data cells are color-coded based on degree of FC; green, FC>2; yellow, 2>FC>1.2; red, FC<1.2., d. Gating strategy for PBMCs to identify different subpopulations. e. Modulation of intermediate to classical CD14 monocytes transition by mild/moderate (orange) and severe (red) patient serum. Each plot represents a single serum sample. Representative experiment from three independent trials and two different healthy PBMC donors. f. Histograms of IFITM3 expression by CD3+ CD19+ lymphocytes from healthy donor cultured with IFNa and serum from heathy donor (blue), mild/moderate (orange) and severe (red) SARS-CoV-2 positive patients. Mild/Moderate (light yellow) or Severe (pink) sera were pre-treated with protein G/A before incubation with PBMC. Each plot represents a single serum sample. Representative experiment from two independent trials and two different healthy PBMC donors. For a, b, c, e, f, data from one of two representative experiments is shown. ns, non-significant.
Extended Data 10:
Extended Data 10:. Antibodies present in severe COVID-19 patients antagonize IFNAR Signaling through FCγRIIb.
a. Test of ISG neutralization by M/M or severe serum as presented in Figure 3e, here using sera from a validation cohort of patients. b. Test of ISG neutralization by M/M or severe serum in presence of anti-CD16/CD32/CD64 antibodies to block Fc receptors as presented in Figure 4a, here using sera from a validation cohort of patients. c. qPCR analysis of IFI27, ISG15 and MX1 gene expression in healthy donor PBMCs treated with IFNa with the addition of M/M or severe patient sera with or without Fc receptor blocking (Figure 4a). Fold changes are relative to untreated healthy donor PBMCs. n=3/group. Data is plotted as mean±SEM. d. Absolute counts of CD14+ monocytes from experiments presented in Figure 4a (n=16/group). e and f. Contour plots and histograms of CD14 and IFITM3 expression by monocytes (e) and quantification by Luminex of IL-6, IL-8 in the supernatant (f) from the experiment presented in Figure 4b and c. g. Boxplots showing fold changes of percentage of IFITM3 positive CD14+ monocytes upon IFNa stimulation normalized to non-treated cells (1 experiment on 2 different pbmc donors: n=8/group). Differences in c and g were calculated using a two-way ANOVA corrected for multiple comparison. * p.value < 0.05; ** p.value < 0.01; *** p.value <0.001; **** p.value < 0.0001; ns non-significant. Boxplot center, median; box limits, 25th and 75th percentile; whiskers, min. and max. data point.
Figure 1:
Figure 1:. Severe COVID-19 disease is characterized by the lack of IFN-responsive neutrophils.
a. Gender, SARS-CoV-2 status and disease severity in patients and control individuals (left) and description of study design (right) b. UMAP visualization of 116,517 cells merged from the entire cohort with specific populations overlaid (left), and frequencies of these populations across control, mild/moderate (M/M) and severe individuals (right). c. UMAP visualization of neutrophil subsets. d. and e. Overlay of SARS-CoV-2 status and disease severity, respectively, on the neutrophil UMAP. f. Frequency of ISG neutrophils among all neutrophils across SARS-CoV-2 status and disease severity (CTRL, n=14; NEG M/M, n=6; NEG severe, n=5; POS M/M, n=11, POS severe n=10). g. Score of ISG signature across neutrophil subtypes and disease severity in SARS-CoV-2 positive patients. Statistical significance was assessed using a two-way ANOVA test with multiple comparisons for panel a and e, and using a two-sided Wilcoxon test for panel f. * p-value < 0.05; ** p-value < 0.01; *** p-value < 0.001; **** p-value < 0.0001. Boxplot center, median; box limits, 25th and 75th percentile; whiskers, min. and max. data point.
Figure 2:
Figure 2:. Severe COVID-19 disease is defined by the lack of a concerted IFN-response across peripheral blood immune cells.
a. Frequencies of MPC subsets among all MPC across mild/moderate (M/M, n=6 NEG, n=11 POS) and severe (n=5 NEG, n=10 POS) individuals b. Scatter plot between neutrophil and monocyte ISG positive subsets patient by patient (M/M, n=11; severe, n=10; COVID-, n=11). c. Violin plot of ISG signature on all T cells (top) and all B/Plasma cells (bottom) across SARS-CoV-2 status and disease severity. Statistical significance was assessed using a two-sided Wilcoxon test. d. Correlation matrix using Spearman rank correlation between the most and the least correlated cell subsets to the Neutrophils ISG positive cells (data include all SARS-CoV-2 negative and positive patients). e. ISG signature score in all platelets across SARS-CoV-2 status and disease severity. f-h. 3D PhEMD embedding of all patients, colored by f de novo patient clusters A-H, g. SARS-CoV-2 status, and h. disease severity. Statistical significance was assessed using two-tailed Spearman’s rank correlation (b) and Kruskal Wallis test with multiple comparisons (a), and two-sided Wilcoxon rank sum test for panels c and e. * p-value < 0.05; ** p-value < 0.01; *** p-value < 0.001; **** p-value < 0.0001. Boxplot center, median; box limits, 25th and 75th percentile; whiskers, min. and max. data point.
Figure 3:
Figure 3:. Neutralization of ISG induction by Antibodies from Severe COVID-19 Patients.
a. Measurement of serum IFNα concentration from SARS-CoV-2 negative and positive M/M (n=17) or severe (n=15) patients by ELISA. Patients 1055 and 1060 are highlighted in red and their Monocytes ISG frequency from Fig 2C is noted as well as the median for mild COVID-19 mild/moderate patients. Boxplot center, median; box limits, 25th and 75th percentile; whiskers, 1.5x interquartile range (IQR). b. Measurement of anti-SARS-CoV-2 antibody levels in serum from patients by Luminex assay (M/M: Mild/Moderate). Boxplot center, median; box limits, 25th and 75th percentile; whiskers, min. and max. data point. c. Scatter plots showing viral load versus levels of antibody binding SARS-CoV-2 Nucleocapsid for patients in the cohort with severity overlaid. Antibody levels are shown as arbitrary units of MFI from Luminex assay while viral load is represented by an inverse CT number from QRT-PCR with target amplification of the SARS-CoV2 Nucleocapsid sequence. Correlation coefficient and significance calculated using Spearman’s method. Patients for which data was unavailable were excluded (M/M, n=9; severe, n=7 patients) d. Scatterplot for SARS-CoV2 Full Spike protein antibody titers relative to days post symptom onset. Patients for which data was unavailable were excluded (M/M, n=14; severe, n=8 patients). e. Contour plots and histograms of CD14 and IFITM3 expression by monocytes from healthy PBMC cultured with IFNα and serum from either heathy donor, mild/moderate or severe SARS-CoV-2 positive patient. f. Contour plots and histograms of CD14 and IFITM3 expression by monocytes after pre-treating Mild/Moderate (light yellow) or Severe (pink) sera with protein A/G prior to incubation with PBMC to deplete IgG. g. Boxplots of IFITM3 induction in CD14 monocytes (left; ctrl, n=5; M/M, n=21; severe, n=14; M/M depleted, n=11; severe depleted, n=10) and classical to intermediate monocytes ratio (right; ctrl, n=4; M/M, n=24; severe, n=7; M/M depleted, n=11; severe depleted, n=7) from 2 different experiment and 2 different healthy donors. h. Left: Contour plots and histograms of IFITM3 expression by pooled CD3+/CD19+ lymphocytes from healthy PBMC cultured with IFNα and serum from heathy donor, mild/moderate or severe SARS-CoV-2 positive patients. Light yellow and pink indicate respectively Mild/moderate and Severe sera pre-treated with protein A/G. Right: Box plot of IFITM3 induction in lymphocytes. Differences in g. and h. were calculated using a two-way ANOVA test with multiple comparisons. *p.value < 0.05; **p.value < 0.01; ***p.value <0.001; ****p.value < 0.0001; ns: non-significant. For b/g/h boxplot center, median; box limits, 25th and 75th percentile; whiskers, min. and max. data point.
Figure 4:
Figure 4:. IgG-mediated neutralization of ISG induction by Severe COVID-19 Patients sera occurs through binding of their Fc to CD32.
a. Contour plots and histograms of CD14 and IFITM3 expression by monocytes from healthy PBMC cultured with IFNα and serum from either heathy donor, mild/moderate or severe SARS-CoV-2 positive patient, in the presence or not of anti-CD16/CD32/CD64 antibodies to block Fc receptors. b and c. CD14/IFITM3 contour plot and histograms (b) and boxplots presenting fold changes of IFITM3 expression (c) on CD14 monocytes after culturing healthy PBMCs +/− IFNα (1 pg/μl) +/− 5 or 10 μg/ml of plate-coated isotype control, anti-CD16, anti-CD32 or anti-CD64 antibodies alone or in combination to cross-link and activate Fc receptors. Panel c presents the results of 2 independent experiments and 2 different cell donors, including two antibody quantities for one of the donors (n=3 experiments). Data is plotted as mean±SD. d. Neutralization assay as presented in panel a, with the sole addition of anti-CD32 blocking antibodies. e. Boxplots showing fold changes of IFITM3 expression for experiments presented in panel a (left graph, 5 independent experiments on 3 different cell donors) and panel d (right graph, 1 experiment on 2 different cell donors). Differences in c and e were calculated using a two-way ANOVA test with multiple comparisons. * p.value < 0.05; ** p.value < 0.01; **** p.value < 0.0001. Boxplot center, median; box limits, 25th and 75th percentile; whiskers, min. and max. data point. * p.value < 0.05; ** p.value < 0.01; *** p.value <0.001; **** p.value < 0.0001.

Update of

  • Global Absence and Targeting of Protective Immune States in Severe COVID-19.
    Combes AJ, Courau T, Kuhn NF, Hu KH, Ray A, Chen WS, Cleary SJ, Chew NW, Kushnoor D, Reeder GC, Shen A, Tsui J, Hiam-Galvez KJ, Muñoz-Sandoval P, Zhu WS, Lee DS, Sun Y, You R, Magnen M, Rodriguez L, Leligdowicz A, Zamecnik CR, Loudermilk RP, Wilson MR, Ye CJ, Fragiadakis GK, Looney MR, Chan V, Ward A, Carrillo S; UCSF COMET Consortium; Matthay M, Erle DJ, Woodruff PG, Langelier C, Kangelaris K, Hendrickson CM, Calfee C, Rao AA, Krummel MF. Combes AJ, et al. Res Sq [Preprint]. 2020 Oct 28:rs.3.rs-97042. doi: 10.21203/rs.3.rs-97042/v1. Res Sq. 2020. Update in: Nature. 2021 Mar;591(7848):124-130. doi: 10.1038/s41586-021-03234-7. PMID: 33140041 Free PMC article. Updated. Preprint.
  • Global Absence and Targeting of Protective Immune States in Severe COVID-19.
    Combes AJ, Courau T, Kuhn NF, Hu KH, Ray A, Chen WS, Cleary SJ, Chew NW, Kushnoor D, Reeder GC, Shen A, Tsui J, Hiam-Galvez KJ, Muñoz-Sandoval P, Zhu WS, Lee DS, Sun Y, You R, Magnen M, Rodriguez L, Leligdowicz A, Zamecnik CR, Loudermilk RP, Wilson MR, Ye CJ, Fragiadakis GK, Looney MR, Chan V, Ward A, Carrillo S, Matthay M, Erle DJ, Woodruff PG, Langelier C, Kangelaris K, Hendrickson CM, Calfee C, Rao AA, Krummel MF. Combes AJ, et al. bioRxiv [Preprint]. 2020 Oct 29:2020.10.28.359935. doi: 10.1101/2020.10.28.359935. bioRxiv. 2020. Update in: Nature. 2021 Mar;591(7848):124-130. doi: 10.1038/s41586-021-03234-7. PMID: 33140050 Free PMC article. Updated. Preprint.

Comment in

References

    1. Mathew D et al., Deep immune profiling of COVID-19 patients reveals distinct immunotypes with therapeutic implications. Science 369, (2020). - PMC - PubMed
    1. Schulte-Schrepping J et al., Severe COVID-19 Is Marked by a Dysregulated Myeloid Cell Compartment. Cell 182, 1419–1440 e1423 (2020). - PMC - PubMed
    1. Hadjadj J et al., Impaired type I interferon activity and inflammatory responses in severe COVID-19 patients. Science 369, 718–724 (2020). - PMC - PubMed
    1. Zilionis R et al., Single-Cell Transcriptomics of Human and Mouse Lung Cancers Reveals Conserved Myeloid Populations across Individuals and Species. Immunity 50, 1317–1334 e1310 (2019). - PMC - PubMed
    1. Huang IC et al., Distinct patterns of IFITM-mediated restriction of filoviruses, SARS coronavirus, and influenza A virus. PLoS Pathog 7, e1001258 (2011). - PMC - PubMed

Publication types

MeSH terms