. 2021 Jan 21;10(2):210.
doi: 10.3390/cells10020210.

Berberine Prevents Disease Progression of Nonalcoholic Steatohepatitis through Modulating Multiple Pathways

Affiliations

Berberine Prevents Disease Progression of Nonalcoholic Steatohepatitis through Modulating Multiple Pathways

Yanyan Wang et al. Cells. .

Abstract

The disease progression of nonalcoholic fatty liver disease (NAFLD) from simple steatosis (NAFL) to nonalcoholic steatohepatitis (NASH) is driven by multiple factors. Berberine (BBR) is an ancient Chinese medicine and has various beneficial effects on metabolic diseases, including NAFLD/NASH. However, the underlying mechanisms remain incompletely understood due to the limitation of the NASH animal models used. Methods: A high-fat and high-fructose diet-induced mouse model of NAFLD, the best available preclinical NASH mouse model, was used. RNAseq, histological, and metabolic pathway analyses were used to identify the potential signaling pathways modulated by BBR. LC-MS was used to measure bile acid levels in the serum and liver. The real-time RT-PCR and Western blot analysis were used to validate the RNAseq data. Results: BBR not only significantly reduced hepatic lipid accumulation by modulating fatty acid synthesis and metabolism but also restored the bile acid homeostasis by targeting multiple pathways. In addition, BBR markedly inhibited inflammation by reducing immune cell infiltration and inhibition of neutrophil activation and inflammatory gene expression. Furthermore, BBR was able to inhibit hepatic fibrosis by modulating the expression of multiple genes involved in hepatic stellate cell activation and cholangiocyte proliferation. Consistent with our previous findings, BBR's beneficial effects are linked with the downregulation of microRNA34a and long noncoding RNA H19, which are two important players in promoting NASH progression and liver fibrosis. Conclusion: BBR is a promising therapeutic agent for NASH by targeting multiple pathways. These results provide a strong foundation for a future clinical investigation.

Keywords: NAFLD; bile acids; fibrosis; inflammation.


Conflict of interest statement

The authors declare no competing financial interests.

Figures
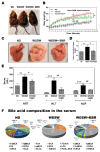
Figure 1
Figure 1
Effect of berberine (BBR) on biometric parameters, serum biochemical parameters, and bile acid profile in the Western diet plus sugar water (WDSW)-induced nonalcoholic fatty liver disease (NAFLD) mouse model. The F2 B6/129 mice were fed a normal chow diet with tap water (ND) or Western Diet with high fructose/glucose (WDSW) for 12 weeks. WDSW animals were treated with vehicle (n = 10) or BBR (50 mg/kg/day, n = 11) via oral gavage once daily for 9 weeks while continuing feeding with WDSW. ND mice (n = 9) did not receive any treatment. (A) Representative image of whole mice in each group. (B) Bodyweight change during the experimental feeding period of 21 weeks. (C) The representative image of the liver. (D) The ratio of liver to body weight. (E) Liver functional enzyme analysis. (F) Bile acid composition profile in the serum expressed by % of total bile acids. Data are expressed as the mean ± standard error of the mean (SEM). Statistical significance: * p < 0.05 vs. ND, ** p < 0.01 vs. ND, *** p < 0.001 vs. ND; # p < 0.05 vs. WDSW, ## p < 0.01 vs. WDSW. Abbreviations: ALP, alkaline phosphatase; AST, aspartate aminotransferase; ALT, alanine aminotransferase.
Figure 2
Figure 2
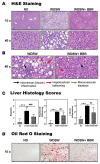
Effect of BBR on nonalcoholic steatohepatitis (NASH) progression in the WDSW-induced NAFLD mouse model. (A) Representative images of hematoxylin and eosin (H&E) staining of the liver slides (scale bar, 100 μm for 10×, 20 μm for 40× magnification). (B) Representative images of intra-acinar (lobular) inflammation, hepatocellular ballooning, and macrovesicular steatosis of H&E-stained liver slides (scale bar, 20 μm for 40× magnification). (C) Liver histology scores, including steatosis, hepatocellular ballooning, and lobular inflammation. Data are expressed as the mean ± SEM. Statistical significance: *** p < 0.001 vs. ND; ## p < 0.01 vs. WDSW, ### p < 0.001 vs. WDSW. (D) Representative images of liver sections stained with Oil red O (scale bar, 100 μm for 10× magnification).
Figure 3
Figure 3
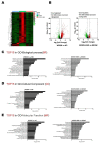
Heatmap, volcano plot, and Gene Ontology (GO) for differentially expressed genes (DEGs) in liver tissues of the two comparisons: WDSW vs. ND and WDSW + BBR vs. WDSW. Total liver RNA from triplicate samples in each experimental group was processed for transcriptome sequencing (RNAseq). Differentially expressed genes (DEGs) between the two groups were identified using fold change (FC) and p-values (FC ≥2 and p-value <0.05). (A) Hierarchical clustering heatmaps for DEGs in both WDSW vs. ND and WDSW + BBR vs. WDSW groups. A Z-score was calculated for the RNAseq data to normalize tag counts. Red and blue colors indicate high and low gene expression, respectively. (B) Volcano plots of the two comparisons: WDSW vs. ND and WDSW + BBR vs. WDSW. Red dots indicate upregulated genes; green dots indicate downregulated genes; black dots indicate not differentially expressed genes. Top 15 enriched terms of the DEGs in GO-BP (biological process) (C), GO-CC (cellular component) (D), and GO-MF (molecular function) (E) of the two comparisons: WDSW vs. ND and WDSW + BBR vs. WDSW.
Figure 4
Figure 4
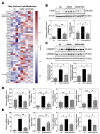
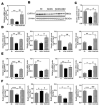
Effect of BBR on NASH-associated dysregulation of fatty acid and lipid metabolism. (A) Representative heatmap of the key genes involved in fatty acid and lipid metabolism. A Z-score was calculated for the RNAseq data to normalize tag counts. Red and blue colors indicate high and low gene expression, respectively. (B) Representative image of the Western blot of fatty acid synthase (Fasn), used as an internal control. (C) Representative immunoblot images of nuclear sterol regulatory element-binding protein 1 (Srebp1) and Srebp2 are shown and normalized with histone H3 as an internal control. (D,E) Relative messenger RNA (mRNA) levels of the key genes involved in fatty acid and lipid metabolism were determined by real-time RT-PCR and normalized with HPRT1(Hypoxanthine Phosphoribosyltransferase 1) as an internal control. (D) Genes involved in fatty acid synthesis: acetyl CoA carboxylase (Acc1), elongation of very-long-chain fatty acids member 7 (Elovl7), fatty acid desaturase 2 (Fads2), stearoyl-coenzyme A desaturase 1 (Scd1). (E) Genes involved in lipid metabolism: carboxylesterase 2A (Ces2α), lipoprotein lipase (Lpl), neutral cholesterol ester hydrolase (Nceh), and patatin-like phospholipase domain containing 3 (Pnpla3). Data are expressed as the mean ± SEM. Statistical significance: * p < 0.05 vs. ND, ** p < 0.01 vs. ND, *** p < 0.001 vs. ND; # p < 0.05 vs. WDSW, ## p < 0.01 vs. WDSW.
Figure 5
Figure 5
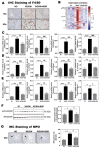
Effect of BBR on NASH-associated inflammation and stress responses. (A) Representative images of immunohistochemistry (IHC) staining of F4/80 (scale bar, 100 μm for 20× and 20 μm for 40× magnification). (B) Representative image of a heatmap of the key genes involved in inflammation and stress response. A Z-score was calculated for the RNAseq data to normalize tag counts. Red and blue colors indicate high and low gene expression, respectively. (CE) Relative mRNA levels of genes involved in inflammation and stress associated with NASH were determined by real-time RT-PCR and normalized with HPRT1 as an internal control. (C) Macrophage markers: Cd11b, Cd63, and Cd68. (D) Chemokines and interleukin family of cytokines: chemokine (C–C motif) ligand 2 (Ccl2), chemokine (C–C motif) receptor 2 (Ccr2), interleukin (IL)-6, and IL-1β. (E) Innate immune response inflammatory markers: tumor necrosis factor alpha (Tnfα), Cd14, Toll-like receptor 4 (TLR4), and transmembrane protein 173 (TMEM173). Abbreviation: NC, negative control. (F) Representative immunoblot images of phosphorylated (p)-nuclear factor (NF)-κB/p65 and NF-κB/p65 and relative protein levels. (G) Representative images of IHC staining of myeloperoxidase (MPO) (scale bar, 100 μm for 20×) and the number of MPO positive cells. Data are expressed as the mean ± SEM. Statistical significance: * p < 0.05 vs. ND, ** p < 0.01 vs. ND, *** p < 0.001 vs. ND; # p < 0.05 vs. WDSW, ## p < 0.01 vs. WDSW; ### p < 0.001 vs. WDSW.
Figure 6
Figure 6
Effect of BBR on NASH-associated dysregulation of bile acid metabolism. (A) Relative mRNA level of Cyp7α1(Cholesterol 7 alpha-hydroxylase). (B) Representative immunoblot images of Cyp7α1 and β-actin are shown (C) Relative protein level of Cyp7α1. (D) Relative mRNA levels of key enzymes in hepatic bile acid synthesis: Cyp27a1, Cyp2e1, Cyp7b1, and Cyp8b1. (E) Relative mRNA levels of hepatic bile acid transporters: Ntcp (sodium/bile acid cotransporter), Bsep (bile salt export protein), Abcc3(ATP binding cassette subfamily C member 3) and Abcg5(ATP binding cassette subfamily G member 5). (F) Relative mRNA levels of Fxrα (farnesoid X receptor α), Shp(short heterodimer partner), Pparγ(Peroxisome proliferator-activated receptor gamma), and Sirt1(Sirtuin 1). Both β-actin and HPRT1 were used as internal controls. Data are expressed as the mean ± SEM. Statistical significance: * p < 0.05 vs. ND, ** p < 0.01 vs. ND, *** p < 0.001 vs. ND; # p < 0.05 vs. WDSW, ## p < 0.01 vs. WDSW; ### p < 0.001 vs. WDSW.
Figure 7
Figure 7
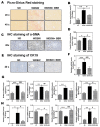
Effect of BBR on NASH-associated hepatic fibrosis (A) Representative images of Picro-Sirius Red staining (scale bar, 100 μm for 20× and 20 μm for 40× magnification). (B) Quantification of Sirus red staining. (C) IHC staining of α-SMA (alpha-smooth actin). (D) Hepatic hydroxyproline levels. (E) Representative images of IHC staining of CK19(cytokeratin 19). (F) Relative mRNA levels of CK19. (G) Relative mRNA levels of key genes involved in hepatic fibrosis Tgfβ (transforming growth factor-β), Loxl2 (Lysyl oxidase homolog 2), Mmp2 (matrix metalloproteinase-2), and Mmp7 (matrix metalloproteinase-7). (H) Relative expression levels of H19 (long non-coding RNA H19), HuR (human antigen R), and SphK2 (sphingosine kinase 2) were normalized with HPRT1 as an internal control, while the expression levels of microRNA (miR)-34a were normalized with U6 snRNA as an internal control. Data are expressed as the mean ± SEM. Statistical significance: * p < 0.05 vs. ND, ** p < 0.01 vs. ND, *** p < 0.001 vs. ND; # p < 0.05 vs. WDSW, ## p < 0.01 vs. WDSW; ### p < 0.001 vs. WDSW.
Figure 8
Figure 8
Schematic depiction of major targets of BBR in preventing NASH disease progression. During the NASH disease progression, lipid is accumulated due to the disruption of hepatic metabolic homeostasis induction of stress response in hepatocytes. Hepatocyte injury-induced immune cell infiltration and activation (monocytes, macrophages, neutrophils) further promotes the activation of hepatic stellate cells (HSC) and the proliferation of cholangiocytes. BBR can reduce metabolic stress in hepatocytes and inhibition of inflammation by reducing macrophage and neutrophil infiltration and activation. It also inhibits HSC and cholangiocyte activation. Overall, BBR effectively prevents NASH progression from NAFL by modulating multiple pathways.

Similar articles

Cited by

References

    1. Byrne C.D., Targher G. NAFLD: A multisystem disease. J. Hepatol. 2015;62:S47–S64. doi: 10.1016/j.jhep.2014.12.012. - DOI - PubMed
    1. Friedman S.L., Neuschwander-Tetri B.A., Rinella M., Sanyal A.J. Mechanisms of NAFLD development and therapeutic strategies. Nat. Med. 2018;24:908–922. doi: 10.1038/s41591-018-0104-9. - DOI - PMC - PubMed
    1. Tilg H., Adolph T.E., Moschen A.R. Multiple Parallel Hits Hypothesis in NAFLD – Revisited After a Decade. Hepatology. 2020 doi: 10.1002/hep.31518. - DOI - PMC - PubMed
    1. Zhu X.-Z., Li X.-Y., Liu J. Recent pharmacological studies on natural products in China. Eur. J. Pharmacol. 2004;500:221–230. doi: 10.1016/j.ejphar.2004.07.027. - DOI - PubMed
    1. Zhang Y.-P., Deng Y.-J., Tang K.-R., Chen R.-S., Liang S., Liang Y.-J., Han L., Jin L., Liang Z.-E., Chen Y.-N., et al. Berberine Ameliorates High-Fat Diet-Induced Non-Alcoholic Fatty Liver Disease in Rats via Activation of SIRT3/AMPK/ACC Pathway. Curr. Med. Sci. 2019;39:37–43. doi: 10.1007/s11596-019-1997-3. - DOI - PubMed

Publication types

MeSH terms

LinkOut - more resources