. 2021 Jan 21;22(3):1056.
doi: 10.3390/ijms22031056.

Characterization and Expression Analysis of Insulin Growth Factor Binding Proteins (IGFBPs) in Pacific White Shrimp Litopenaeus vannamei

Affiliations

Characterization and Expression Analysis of Insulin Growth Factor Binding Proteins (IGFBPs) in Pacific White Shrimp Litopenaeus vannamei

Ying Pang et al. Int J Mol Sci. .

Abstract

The insulin signaling (IIS) pathway plays an important role in the metabolism, growth, development, reproduction, and longevity of an organism. As a key member of the IIS pathway, insulin-like growth factor binding proteins (IGFBPs) are widely distributed a family in invertebrates and vertebrates that are critical in various aspects of physiology. As an important mariculture species, the growth of Pacific white shrimp, Litopenaeus vannamei, is one of the most concerning characteristics in this area of study. In this study, we identified three IGFBP genes in the genome of L. vannamei and analyzed their gene structures, phylogenetics, and expression profiles. LvIGFBP1 was found to contain three domains (the insulin growth factor binding (IB) domain, the Kazal-type serine proteinase inhibitor (Kazal) domain, and the immunoglobulin C-2 (IGc2) domain), while LvIGFBP2 and LvIGFBP3 only contained a single IB domain. LvIGFBP1 exhibited high expression in most tissues and different developmental stages, while LvIGFBP2 and LvIGFBP3 were only slightly expressed in hemocytes. The RNA interference of LvIGFBP1 resulted in a significantly smaller increment of body weight than that of control groups. These results will improve our understanding of the conservative structure and function of IGFBPs and show potential applications for the growth of shrimp.

Keywords: Litopenaeus vannamei; gene expression; gene structures; growth; insulin growth factor binding proteins.


Conflict of interest statement

The authors declare no conflict of interest.

Figures

Figure 1
Figure 1
Phylogenetic tree of insulin-like growth factor binding proteins (IGFBPs) and their gene structures. The domains of IGFBPs obtained from the SMART program are located on the right of the phylogenetic tree. The bootstrap values are given at each branch node.
Figure 2
Figure 2
Multiple sequence alignment of the three domains of the IGFBP protein sequence. (A) N-terminal insulin growth factor binding (IB) domain: the highly conserved motif is framed in blue (CGCCxxC), except for Homo sapiens IGFBP6; the motifs of other species are highly conserved. The conserved decapod motif is framed in red (RxLxxL). (B) Mid-region Kazal domain: the conserved motif is framed in blue (LxxLL). This motif is different from other species, and the L site in this motif is not particularly conserved. (C) C-terminal immunoglobulin C-2 (IGc2) domain: the highly conserved motif is framed in blue (RGGP). This motif is extremely conserved in most species.
Figure 3
Figure 3
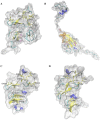
Predicted 3D structure of LvIGFBPs. (A) Predicted 3D structure of the N-terminal IB domain of LvIGFBP1. Cysteine residues are in green, and the CGCCxxC motif is in mauve; (B) predicted 3D structure of the C-terminal IGc2 domain of LvIGFBP1; (C) predicted 3D structure of LvIGFBP2; and (D) predicted 3D structure of LvIGFBP3. Cysteine residues are in yellow, predicted ligand binding sites are in orange, predicted enzyme active sites are in magenta, and the RGGP motif is in mauve. The β-sheet is in yellow, the helix is in blue, the β-turn is in cyan, and the random-coil is in white.
Figure 4
Figure 4
Heatmap of LvIGFBP gene expression profiles in (A) early development stages: zygote (zygo), 2 cell (C2), 4 cell (C4), 32 cell (C32), blastula (blas), gastrula (gast), limb bud embryo I (Lbe1), limb bud embryo II (Lbe2), larva in membrane I (Lim1), larva in membrane II (Lim1), nauplius I (N1), nauplius III (N3), nauplius VI (N6), zoea I (Z1), zoea II (Z2), zoea III (Z3), mysis I (M1), mysis II (M2), mysis III (M3), and postlarvae 1 (P1); (B) molting stages: the inter-molt (C), pre-molt (D0, D1, D2, D3, and D4), and post-molt (P1 and P2) stages; and (C) adult tissues: hemocyte (Hc), antenna (Ant), muscle (Ms), intestines (In), ovary (Ov), stomach (St), lymphoid organ (Oka), gill (Gi), hepatopancreas (Hp), testis (Te), eye-stalk (Es), brain (Br), thoracic ganglion (Tg), ventral nerve (Vn), epidermis (Epi), and heart (Ht).
Figure 5
Figure 5
The results of real-time quantitative PCR. (A) The silencing efficiency of LvIGFBP1 RNAi (RNA interference) with different dosages of double stranded RNA (dsRNA). (B) Relative expression level of LvIGFBP1 after RNAi in muscle. (C) Relative expression level of LvIGFBP1 after RNAi in ventral nerve. The expression of target genes was detected by qRT-PCR and normalized to the 18S rRNA gene as the internal reference. These results were based on three independent biological replications and are shown as mean values ± SD. Significant differences of the gene expression levels between three treatments are shown as ** p < 0.01 and * p < 0.05.
Figure 6
Figure 6
The growth characters after LvIGFBP1 RNAi in L. vannamei. The results were based on three independent biological replications and are shown as mean values ± SD. (A) The increase in body weight after LvIGFBP1 RNAi. (B) The increase in body length after LvIGFBP1 RNAi. (C) The raincloud figure reflected the increase in body weight after RNAi. (D) The raincloud figure reflected the increase in body length after RNAi. Significant differences of the gene expression levels between three treatments are shown as * p < 0.05.

References

    1. Tatar M., Kopelman A., Epstein D., Tu M.P., Yin C.M., Garofalo R.S. A mutant Drosophila insulin receptor homolog that extends life-span and impairs neuroendocrine function. Science. 2001;292:107–110. doi: 10.1126/science.1057987. - DOI - PubMed
    1. Taguchi A., White M.F. Insulin-like signaling, nutrient homeostasis, and life span. Annu. Rev. Physiol. 2008;70:191–212. doi: 10.1146/annurev.physiol.70.113006.100533. - DOI - PubMed
    1. Das D., Arur S. Conserved insulin signaling in the regulation of oocyte growth, development, and maturation. Mol. Reprod. Dev. 2017;84:444–459. doi: 10.1002/mrd.22806. - DOI - PMC - PubMed
    1. Skorokhod A., Gamulin V., Gundacker D., Kavsan V., Muller I.M., Muller W.E.G. Origin of insulin receptor-like tyrosine kinases in marine sponges. Biol. Bull. 1999;197:198–206. doi: 10.2307/1542615. - DOI - PubMed
    1. Vitali V., Horn F., Catania F. Insulin-like signaling within and beyond metazoans. Biol. Chem. 2018;399:851–857. doi: 10.1515/hsz-2018-0135. - DOI - PubMed

Substances

LinkOut - more resources