. 2021 Jan 21;10(2):212.
doi: 10.3390/cells10020212.

Longitudinal Multi-Parametric Liquid Biopsy Approach Identifies Unique Features of Circulating Tumor Cell, Extracellular Vesicle, and Cell-Free DNA Characterization for Disease Monitoring in Metastatic Breast Cancer Patients

Affiliations

Longitudinal Multi-Parametric Liquid Biopsy Approach Identifies Unique Features of Circulating Tumor Cell, Extracellular Vesicle, and Cell-Free DNA Characterization for Disease Monitoring in Metastatic Breast Cancer Patients

Corinna Keup et al. Cells. .

Abstract

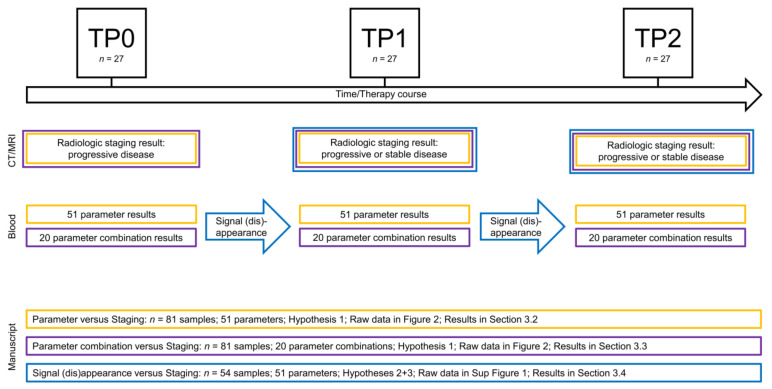
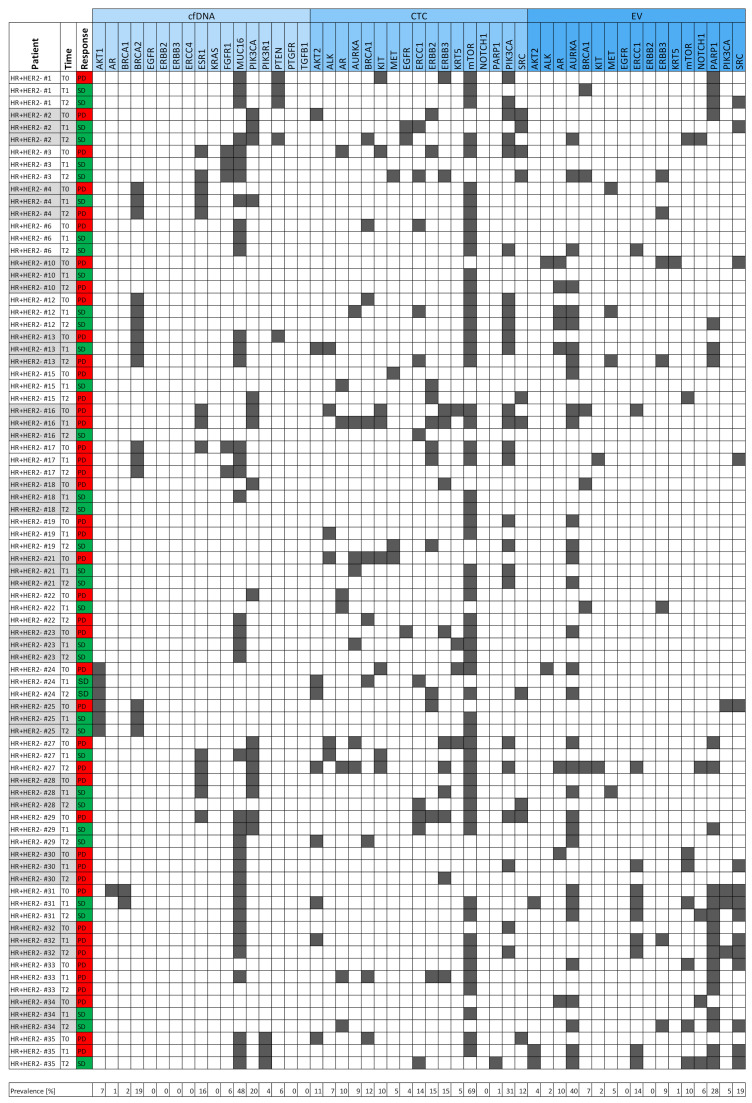
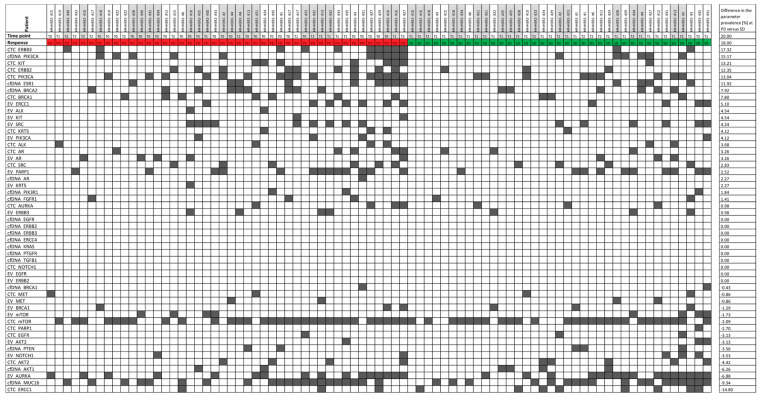
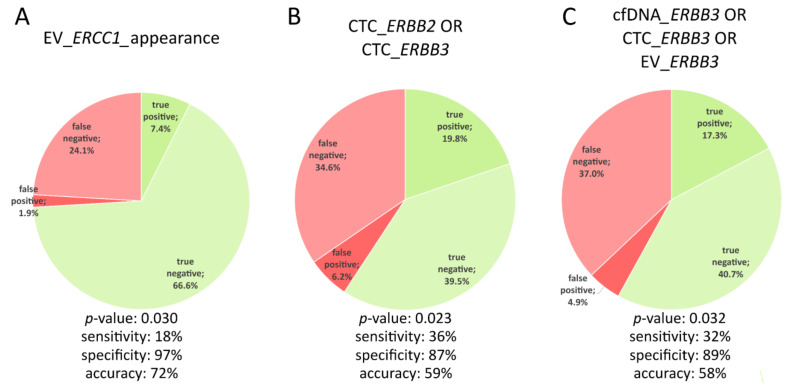
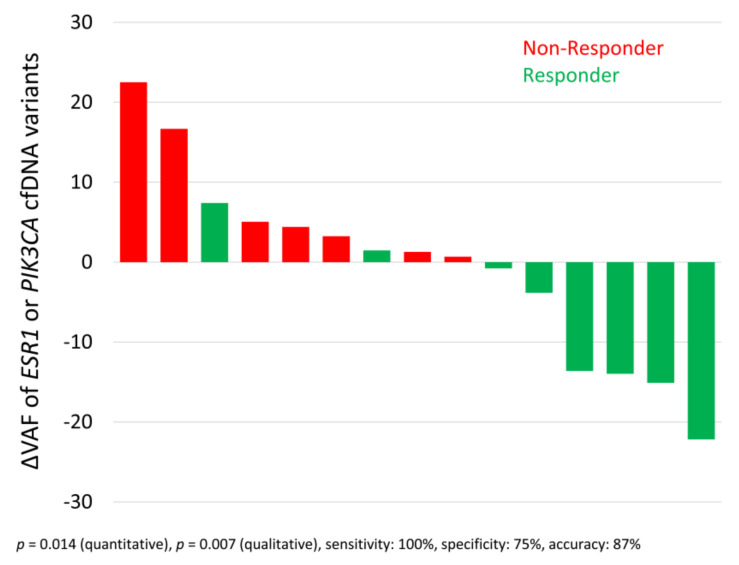
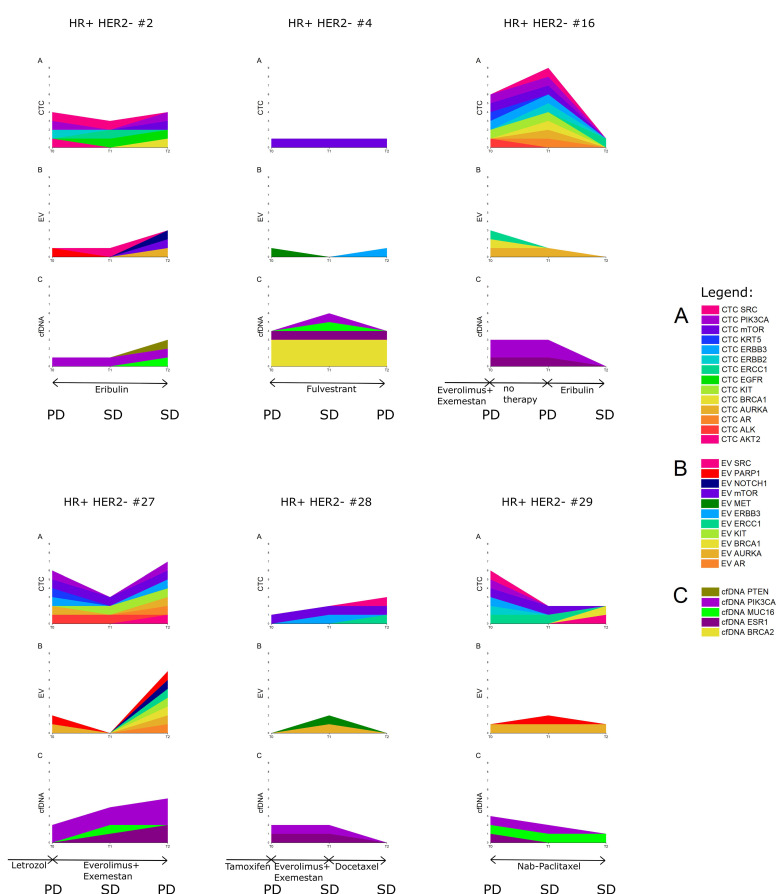
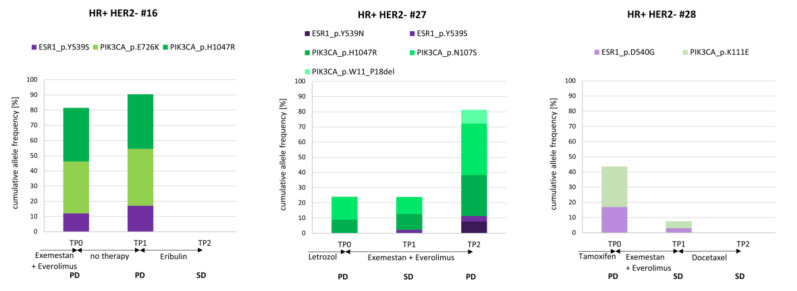
Dynamics of mRNA from circulating tumor cells (CTCs), mRNA from extracellular vesicles (EVs), and cell-free DNA (cfDNA) were assessed to examine the relevance of a longitudinal multi-parametric liquid biopsy strategy. Eighteen milliliters of blood was drawn from 27 hormone receptor-positive and human epidermal growth factor receptor 2 (HER2)-negative metastatic breast cancer (MBC) patients at disease progression and at two subsequent radiologic staging time points. CTC mRNA and EV mRNA were analyzed using multi-marker qPCR, and cfDNA was analyzed using targeted next-generation sequencing (NGS). The presence of ERBB2 or ERBB3 overexpression signals in CTCs significantly correlated with disease progression (87% specificity, 36% sensitivity, p-value = 0.023), and the presence of either ERBB3 signals in CTCs or EVs or cfDNA variants in ERBB3 also showed a significant association with progressive MBC. Fluctuations during treatment were detected in the EV fraction with the appearance of hitherto undetected ERCC1 signals correlating with progressive disease (97% specificity, 18% sensitivity, p-value = 0.030). Allele frequency development of ESR1 and PIK3CA variants detected at subsequent staging time points could be used as a predictor for therapy success and, importantly, might help guide therapy decisions. The three analytes, each with their own unique features for disease monitoring, were shown to be complementary, underlining the usefulness of the longitudinal multi-parametric liquid biopsy approach.

Keywords: follow-up; gene expression; molecular signature; multi-analyte; multi-modal; multi-parametric; mutation; next-generation sequencing; serial sampling; unique molecular indices.


Conflict of interest statement

C.K. received support for travel expenses from QIAGEN, Hilden, Germany. V.S. and M.S. are employees at QIAGEN, Hilden, Germany. O.H. received honoraria from Riemser, Roche, Amgen, Pfizer, Eisai, Hexal, MSD, Daiichi Sankyo, and Novartis. R.K. has received honoraria from Tesaro and Astra-Zeneca in the last 3 years, is part of the advisory board from Medtronic and council of International Gynaecological Cancer Society (IGCS) and president of Society of European Robotic Gynecological Surgery (SERGS), and has proctored and presented for Intuitive Surgical. S.K.-B. is a consultant for QIAGEN, Hilden, Germany.

Figures

Figure 1
Figure 1
Data evaluation workflow.
Figure 2
Figure 2
Heatmap of the entire data matrix. Three blood samples from the initial progression time point (TP0) and two subsequent staging time points (TP1 and TP2) of each of the 27 HR+ HER2– metastatic breast cancer (MBC) patients were used to characterize 17 parameters in each of the three liquid biopsy analytes: cell-free DNA (cfDNA, light blue), circulating tumor cell (CTC) mRNA (blue), and extracellular vesicle (EV) mRNA (dark blue). The presence of a variant (cfDNA) or overexpression signal (CTC or EV) is denoted by gray squares. The results of the radiologic imaging performed at the time of blood draw divided the samples into two clinically relevant populations [progressive disease (PD), in red; stable disease (SD), in green].
Figure 3
Figure 3
Heatmap of the signal prevalence in samples drawn at a progressive disease time point (PD, red) versus stable disease time point (SD, green). The 81 samples were divided into the population of samples drawn at PD (44 samples) and SD (37 samples). The signal prevalence (in %) of all 51 parameters was calculated in the two populations separately and was then compared by calculating the difference in the prevalence within the two populations.
Figure 4
Figure 4
Characteristics of the three monitoring markers identified. A significant correlation (p-value < 0.05) between the signal appearance (A) or parameter combination (B + C) and disease progression was shown using the two-tailed Fisher’s exact test. The accuracy of the three monitoring markers decreases from left to right.
Figure 5
Figure 5
Waterfall plot mapping the cfDNA variant allele frequency (VAF) development of ESR1 or PIK3CA variants and therapy response. Difference in variant allele frequencies (ΔVAF) of ESR1 variants or PIK3CA variants between two consecutive staging time points correlated with therapy response (at the second time point evaluated by radiologic imaging and according to RECIST). Only the 15 cases with a detectable VAF at one time point and the next time point were evaluated. The two-tailed Mann–Whitney U-test and the two-tailed Fisher’s exact test were used to evaluate the ∆VAFs thus obtained.
Figure 6
Figure 6
Development of CTC and EV overexpression signals and cfDNA variants in six index patients at three consecutive staging time points. The staging result (by radiologic imaging according to RECIST guidelines) at the time point at which blood was drawn is indicated as PD (progressive disease) or SD (stable disease). (A) CTC mRNA signals, (B) EV mRNA signals, and (C) cfDNA variants. Within each analyte, each color indicates a variant in another gene or overexpression signal of another transcript, while data of the same gene or transcript in different analytes are indicated with the same color.
Figure 7
Figure 7
cfDNA variants across three consecutive staging time points. The cumulative allele frequency of all detected cfDNA variants at each of the three time points was exemplified in three patients. Therapy regimens and staging results (SD: stable disease; PD: progressive disease) are indicated. PIK3CA (green) and ESR1 (purple) variants were called in these patients, mostly with varying allele frequencies across the observation period.

References

    1. Rossi G., Mu Z., Rademaker A.W., Austin L.K., Strickland K.S., Costa R.L.B., Nagy R.J., Zagonel V., Taxter T.J., Behdad A., et al. Cell-Free DNA and Circulating Tumor Cells: Comprehensive Liquid Biopsy Analysis in Advanced Breast Cancer. Clin. Cancer Res. 2018;24:560–568. doi: 10.1158/1078-0432.CCR-17-2092. - DOI - PubMed
    1. Heitzer E., Haque I.S., Roberts C.E.S., Speicher M.R. Current and future perspectives of liquid biopsies in genomics-driven oncology. Nat. Rev. Genet. 2019;20:71–88. doi: 10.1038/s41576-018-0071-5. - DOI - PubMed
    1. Venesio T., Siravegna G., Bardelli A., Sapino A. Liquid Biopsies for Monitoring Temporal Genomic Heterogeneity in Breast and Colon Cancers. Pathobiology. 2017 doi: 10.1159/000473882. - DOI - PubMed
    1. Lianidou E., Pantel K. Liquid Biopsies. Genes Chromosomes Cancer. 2018 doi: 10.1002/gcc.22695. - DOI - PubMed
    1. Ferlay J., Soerjomataram I., Dikshit R., Eser S., Mathers C., Rebelo M., Parkin D.M., Forman D., Bray F. Cancer incidence and mortality worldwide: Sources, methods and major patterns in GLOBOCAN 2012. Int. J. Cancer. 2015;136:E359–E386. doi: 10.1002/ijc.29210. - DOI - PubMed

Publication types

MeSH terms