Predicting the Distribution of the Invasive Species Leptocybe invasa: Combining MaxEnt and Geodetector Models
- PMID: 33494404
- PMCID: PMC7911618
- DOI: 10.3390/insects12020092
Predicting the Distribution of the Invasive Species Leptocybe invasa: Combining MaxEnt and Geodetector Models
Abstract
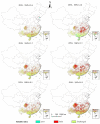
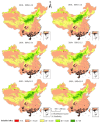
Leptocybe invasa is a globally invasive pest of eucalyptus plantations, and is steadily spread throughout China. Predicting the growth area of L. invasa in China is beneficial to the establishment of early monitoring, forecasting, and prevention of this pest. Based on 194 valid data points and 21 environmental factors of L. invasa in China, this study simulated the potential distribution area of L. invasa in China under three current and future climate scenarios (SSPs1-2.5, SSPs2-3.5, and SSPs5-8.5) via the MaxEnt model. The study used the species distribution model (SDM) toolbox in ArcGIS software to analyze the potential distribution range and change of L. invasa. The importance of crucial climate factors was evaluated by total contribution rate, knife-cut method, and environmental variable response curve, and the area under the receiver operating characteristic (ROC) curve was used to test and evaluate the accuracy of the model. The results showed that the simulation effect of the MaxEnt model is excellent (area under the ROC curve (AUC) = 0.982,). The prediction showed that L. invasa is mainly distributed in Guangxi, Guangdong, Hainan, and surrounding provinces, which is consistent with the current actual distribution range. The distribution area of the potential high fitness zone of L. invasa in the next three scenarios increases by between 37.37% and 95.20% compared with the current distribution. Climate change affects the distribution of L. invasa, with the annual average temperature, the lowest temperature of the coldest month, the average temperature of the driest season, the average temperature of the coldest month, and the precipitation in the wettest season the most important. In the future, the core areas of the potential distribution of L. invasa in China will be located in Yunnan, Guangxi, Guangdong, and Hainan. They tend to spread to high latitudes (Hubei, Anhui, Zhejiang, Jiangsu, and other regions).
Keywords: L. invasa; MaxEnt; climate change; suitable growth area.
Conflict of interest statement
The authors declare no conflict of interest.
Figures


References
-
- Chen B.X., Sun Y.F., Han Z.H., Huang H.K., Zhang H.B., Li Y.K., Zhang G.L., Liu W.X. Challenges in preventing and controlling invasive alien species in China. J. Biosaf. 2020;29:157–163.
-
- Liu T.T., Zhang H.J., Ma Y.Z. Assessment of economic damage from biological invasion. Ecol. Econ. 2010;2:173–175.
-
- O’Connor B., Bojinski S., Röösli C., Schaepman M.E. Monitoring global changes in biodiversity and climate is more important than ever as ecological crisis intensifies. Ecol. Inform. 2019;55 doi: 10.1016/j.ecoinf.2019.101033. - DOI
-
- Change I.C. The Physical Science basis. In: Stocker T.F., Qin D., Plattner G.-K., Tignor M., Allen S.K., Boschung J., Nauels A., Xia Y., Bex V., et al., editors. Contribution of Working Group I to the Fifth Assessment Report of the Intergovernmental Panel on Climate Change. Cambridge University Press; Cambridge, UK: New York, NY, USA: 2018. p. 1535.
-
- Li J., Chang H., Liu T., Zhang C. The potential geographical distribution of haloxylon across Central Asia under climate change in the 21st century. Agric. For. Meteorol. 2019;275:243–254. doi: 10.1016/j.agrformet.2019.05.027. - DOI
Grants and funding
LinkOut - more resources
Full Text Sources
Other Literature Sources

