. 2021 Jan 21;22(3):1063.
doi: 10.3390/ijms22031063.

Decreased Levels of Thioredoxin o1 Influences Stomatal Development and Aperture but Not Photosynthesis under Non-Stress and Saline Conditions

Affiliations

Decreased Levels of Thioredoxin o1 Influences Stomatal Development and Aperture but Not Photosynthesis under Non-Stress and Saline Conditions

Antonio Sánchez-Guerrero et al. Int J Mol Sci. .

Abstract

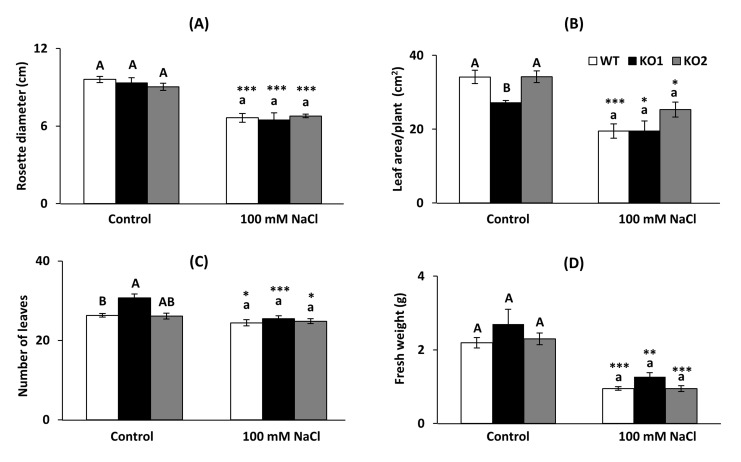
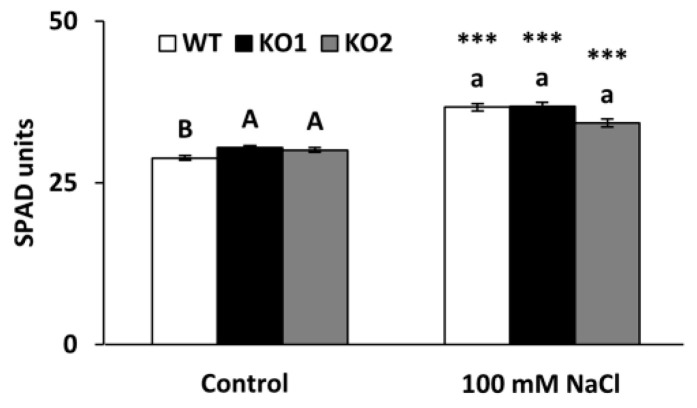
Salinity has a negative impact on plant growth, with photosynthesis being downregulated partially due to osmotic effect and enhanced cellular oxidation. Redox signaling contributes to the plant response playing thioredoxins (TRXs) a central role. In this work we explore the potential contribution of Arabidopsis TRXo1 to the photosynthetic response under salinity analyzing Arabidopsis wild-type (WT) and two Attrxo1 mutant lines in their growth under short photoperiod and higher light intensity than previous reported works. Stomatal development and apertures and the antioxidant, hormonal and metabolic acclimation are also analyzed. In control conditions mutant plants displayed less and larger developed stomata and higher pore size which could underlie their higher stomatal conductance, without being affected in other photosynthetic parameters. Under salinity, all genotypes displayed a general decrease in photosynthesis and the oxidative status in the Attrxo1 mutant lines was altered, with higher levels of H2O2 and NO but also higher ascorbate/glutathione (ASC/GSH) redox states than WT plants. Finally, sugar changes and increases in abscisic acid (ABA) and NO may be involved in the observed higher stomatal response of the TRXo1-altered plants. Therefore, the lack of AtTRXo1 affected stomata development and opening and the mutants modulate their antioxidant, metabolic and hormonal responses to optimize their adaptation to salinity.

Keywords: antioxidants; oxidative stress; photosynthesis; salinity; stomata; thioredoxin o1.


Conflict of interest statement

The authors declare no conflict of interest. The funders had no role in the design of the study; in the collection, analyses, or interpretation of data; in the writing of the manuscript, or in the decision to publish the results.

Figures

Figure 1
Figure 1
Phenotypic characterization of growth parameters. (A) Rosette diameter, (B) total leaf area, (C) number of leaves and (D) fresh weight of the aerial part of A. thaliana plants. Wild type plants (WT) and two Attrxo1 mutant lines (KO1 and KO2) were grown in the absence (Control) and presence of 100 mM NaCl. Data are the mean ± SE of at least eight independent experiments. Different letters indicate significant differences (p < 0.05) among genotypes in each condition according to the Tukey’s test, and the asterisks indicate significant differences of each genotype in salinity compared to the control condition using the t-Student’s test (*, **, *** at p < 0.05, p < 0.01 and p < 0.001, respectively).
Figure 2
Figure 2
Stomatal characterization. (A) Foliar epidermis of A. thaliana wild type (WT) and two KO Attrxo1 mutant lines grown in the absence (Control) and presence of 100 mM of NaCl. Density of (B) total (immature and mature) and (C) mature stomata. Pictures were captured with a clear field microscope and a 40× objective. Data are the mean ± SE of three independent experiments (n > 2000 stomata per genotype and treatment). Different letters indicate significant differences (p < 0.05) among genotypes in each condition according to the Tukey’s test, and the asterisks indicate significant differences of each genotype in salinity compared to the control condition using the t-Student’s test (p < 0.05). Arrows point some immature stomata and two of them (1 and 2) are shown in detail.
Figure 3
Figure 3
(A) Stomatal size and (B) opening index measured on the abaxial epidermis of the leaves in A. thaliana wild type (WT) and two KO Attrxo1 mutant lines grown in the absence (Control) and presence of 100 mM of NaCl. The aperture index represents the measurement of the width/length of the stomatal pore. Data are the mean ± SE of three independent experiments (n > 500 stomata per genotype and treatment). Different letters indicate significant differences (p < 0.05) among genotypes in each condition according to the Tukey’s test, and the asterisks indicate significant differences of each genotype in salinity compared to the control condition using the t-Student’s test (**, *** at p < 0.01 and p < 0.001, respectively).
Figure 4
Figure 4
Total chlorophyll content in A. thaliana wild type (WT) and two KO Attrxo1 mutant lines grown in the absence (Control) and presence of 100 mM of NaCl. Data in SPAD units are mean ± standard error of at least eight independent experiments. Different letters indicate significant differences (p < 0.05) among genotypes in each condition according to the Tukey’s test, and the asterisks indicate significant differences of each genotype in salinity compared to the control condition using the t-Student’s test (p < 0.001).
Figure 5
Figure 5
Oxidative stress markers. (A) Hydrogen peroxide, (B) nitric oxide (in arbitrary fluorescence units), (C) carbonyl (CO) proteins and (D) malondialdehyde (MDA) in leaves of A. thaliana wild type (WT) and two KO Attrxo1 mutant lines grown in the absence (Control) and presence of 100 mM of NaCl. Data per fresh weight (FW) or mg proteins (prot.) are the mean ± SE of at least three independent experiments. Different letters indicate significant differences (p < 0.05) among genotypes in each condition according to the Tukey’s test, and the asterisks indicate significant differences of each genotype in salinity compared to the control condition using the t-Student’s test (*, **, *** at p < 0.05, p < 0.01 and p < 0.001, respectively).
Figure 6
Figure 6
Ascorbate, glutathione and nitrosoglutathione content in leaves of A. thaliana wild type (WT) and two KO Attrxo1 mutant lines grown in the absence (Control) and presence of 100 mM of NaCl. (A) Reduced ascorbate (ASC), (B) dehydroascorbate (DHA), (C) reduced glutathione (GSH), (D) oxidized glutathione (GSSG) and (E) nitrosoglutathione (GSNO) content per fresh weight (FW). Data are the mean ± SE of at least three independent experiments. Different letters indicate significant differences (p < 0.05) among genotypes in each condition according to the Tukey’s test, and the asterisks indicate significant differences of each genotype in salinity compared to the control condition using the t-Student’s test (*, ** at p < 0.05 and p < 0.01, respectively).
Figure 7
Figure 7
Hormone content in leaves of A. thaliana wild type (WT) and two KO Attrxo1 mutant lines grown in the absence (Control) and presence of 100 mM of NaCl. (A) Abscisic acid ABA, (B) gibberellin GA4 and (C) indoleacetic acid IAA are expressed by fresh weight (FW). Data are the mean ± SE of at least three independent experiments. Different letters indicate significant differences (p < 0.05) among genotypes in each condition according to the Tukey’s test, and the asterisks indicate significant differences of each genotype in salinity compared to the control condition using the t-Student’s test (*, **, *** at p < 0.05, p < 0.01 and p < 0.001, respectively).
Figure 8
Figure 8
Heat map of relative levels of metabolites in leaves of A. thaliana wild type (WT) and two KO Attrxo1 mutant lines grown in the absence (Control) and presence of 100 mM of NaCl. Relative metabolite levels in leaves of all lines under control and saline conditions normalized with respect to the mean value of WT plants under control condition. Fold-changes were log2 transformed (i.e., all metabolite levels from WT in control condition were 0). The red and blue colors represent the increases and decreases, respectively. The values represent the average from six samples and the asterisks indicate significant differences (p < 0.05) from the WT in each condition using the t-Student’s test. The statistically significant differences between control and salinity of each genotype are presented in Table S1.
Figure 9
Figure 9
Photosynthetic parameters in leaves of A. thaliana wild type (WT) and two KO Attrxo1 mutant lines grown in the absence (Control) and presence of 100 mM of NaCl. (A) Net photosynthetic assimilation (AN), (B) stomatal conductance to CO2 (gs), (C) electron transport rate (Jflu) and (D) mesophyll conductance from curve-fitting (gmCF). Data are the mean ± SE of at least 9 replicates. Different letters indicate significant differences (p < 0.05) among genotypes in each condition according to the Tukey’s test, and the asterisks indicate significant differences of each genotype in salinity compared to the control condition using the t-Student’s test (p < 0.05).
Figure 10
Figure 10
Photosynthetic parameters in leaves of A. thaliana wild type (WT) and two KO Attrxo1 mutant lines grown in the absence (Control) and presence of 100 mM of NaCl. (A) Maximum velocity of Rubisco carboxylation (Vcmax) and (B) maximum electron transport rate (Jmax). Data are the mean ± SE of at least 9 replicates. Different letters indicate significant differences (p < 0.05) among genotypes in each condition according to the Tukey’s test, and the asterisks indicate significant differences of each genotype in salinity compared to the control condition using the t-Student’s test (p < 0.05).

Similar articles

Cited by

References

    1. Lázaro J.J., Jiménez A., Camejo D., Iglesias-Baena I., Martí M.C., Lázaro-Payo A., Barranco-Medina S., Sevilla F. Dissecting the integrative antioxidant and redox systems in plant mitochondria. Effect of stress and S-nitrosylation. Front. Plant Sci. 2013;4:1–20. doi: 10.3389/fpls.2013.00460. - DOI - PMC - PubMed
    1. Locato V., Cimini S., De Gara L. ROS and redox balance as multifaceted players of cross-tolerance: Epigenetic and retrograde control of gene expression. J. Exp. Bot. 2018;69:3373–3391. doi: 10.1093/jxb/ery168. - DOI - PubMed
    1. Flexas J., Bota J., Loreto F., Cornic G., Sharkey T.D. Diffusive and metabolic limitations to photosynthesis under drought and salinity in C3 plants. Plant Biol. 2004;6:269–279. doi: 10.1055/s-2004-820867. - DOI - PubMed
    1. Flexas J., Bota J., Galmés J., Medrano H., Ribas-Carbó M. Keeping a positive carbon balance under adverse conditions: Responses of photosynthesis and respiration to water stress. Physiol. Plant. 2006;127:343–352. doi: 10.1111/j.1399-3054.2006.00621.x. - DOI
    1. Camejo D., Ortiz-Espín A., Lázaro J.J., Romero-Puertas M.C., Lázaro-Payo A., Sevilla F., Jiménez A. Functional and structural changes in plant mitochondrial PrxII F caused by NO. J. Proteom. 2015;119:112–125. doi: 10.1016/j.jprot.2015.01.022. - DOI - PubMed