. 2021 Jan 25;21(1):63.
doi: 10.1186/s12870-021-02836-7.

Environmental and genetic regulation of plant height in soybean

Affiliations

Environmental and genetic regulation of plant height in soybean

Qing Yang et al. BMC Plant Biol. .

Abstract

Background: Shoot architecture is fundamentally crucial to crop growth and productivity. As a key component of shoot architecture, plant height is known to be controlled by both genetic and environmental factors, though specific details remain scarce.

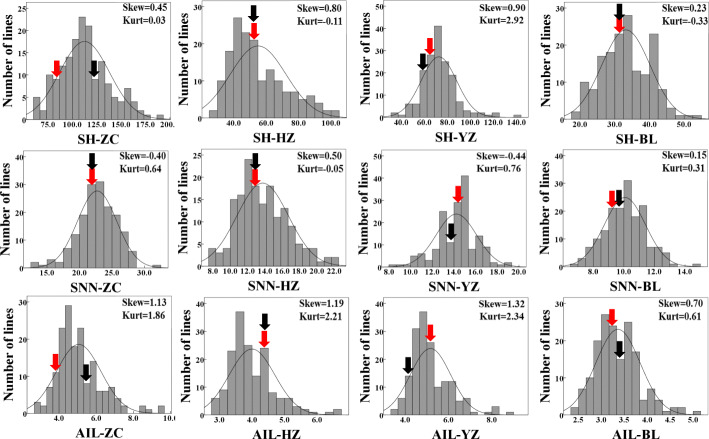
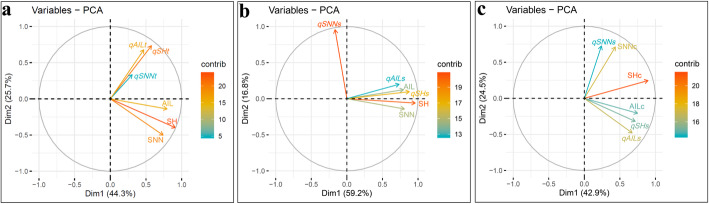
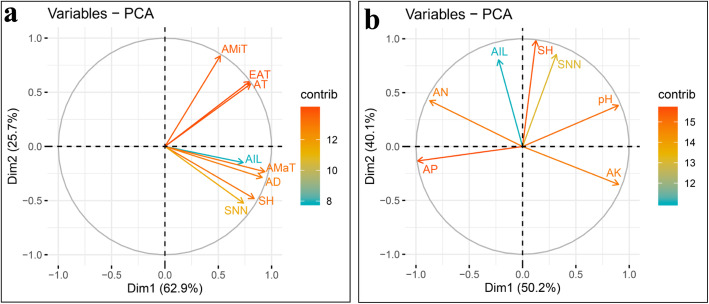
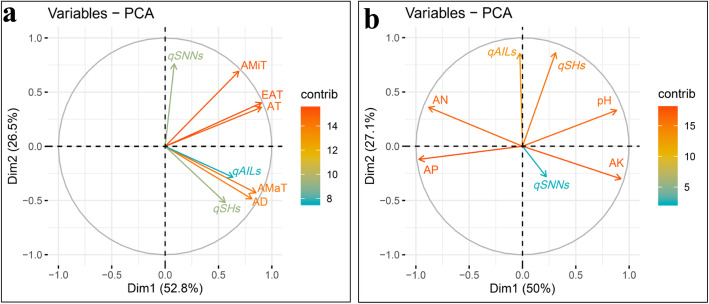
Results: In this study, 308 representative soybean lines from a core collection and 168 F9 soybean progeny were planted at distinct field sites. The results demonstrated the presence of significant genotype × environment interaction (G × E) effects on traits associated with plant height in a natural soybean population. In total, 19 loci containing 51 QTLs (quantitative trait locus) for plant height were identified across four environments, with 23, 13 and 15 being QTLs for SH (shoot height), SNN (stem node number) and AIL (average internode length), respectively. Significant LOD ranging from 2.50 to 16.46 explained 2.80-26.10% of phenotypic variation. Intriguingly, only two loci, Loc11 and Loc19-1, containing 20 QTLs, were simultaneously detected across all environments. Results from Pearson correlation analysis and PCA (principal component analysis) revealed that each of the five agro-meteorological factors and four soil properties significantly affected soybean plant height traits, and that the corresponding QTLs had additive effects. Among significant environmental factors, AD (average day-length), AMaT (average maximum temperature), pH, and AN (available nitrogen) had the largest impacts on soybean plant height. Therefore, in spite of uncontrollable agro-meteorological factors, soybean shoot architecture might be remolded through combined efforts to produce superior soybean genetic materials while also optimizing soil properties.

Conclusions: Overall, the comprehensive set of relationships outlined herein among environment factors, soybean genotypes and QTLs in effects on plant height opens new avenues to explore in work aiming to increase soybean yield through improvements in shoot architecture.

Keywords: Agro-meteorological factors; Genotype; Plants height; QTLs; Shoot architecture; Soil properties.


Conflict of interest statement

The authors declare that the research was conducted in the absence of any commercial or financial relationships that could be construed as a potential conflict of interest.

Figures

Fig. 1
Fig. 1
Plant height traits of soybean varied significantly among geographically distinct growth environments. a-c Plant height traits of 308 soybean cultivars selected from a core germplasm collection and grown in two distinct environments. d-f Plant height traits of 168 F9 recombinant inbred lines (RIL) grown in four environments. HN: Hainan, ZC: Zhao county, HZ: Hangzhou, YZ: Yangzhong, BL: Boluo; The black and red lines, lower and upper edges, and bars above or below the boxes represent median and mean values, 25th, 75th, 5th and 95th percentiles of all data, respectively; Asterisks and different letters over error bars indicate significant differences of the same trait among different environments in the Student’s t-test at 1‰ (P< 0.001) significance level
Fig. 2
Fig. 2
Distributions of plant height traits in 168 F9 RILs reared in four geographically distinct growth environments. Parental values are indicated by red (BX10) and black (BD2) arrows, respectively; Skew: Skewness; Kurt: Kurtosis; SH: shoot height; SNN: stem node number; AIL: average internode length; ZC: Zhao county, HZ: Hangzhou, YZ: Yangzhong, BL: Boluo
Fig. 3
Fig. 3
Principal component analysis (PCA) among detectable QTLs and soybean plant height traits under varied environments. The PCA plots were drawn based on a the three tested traits and total additive effects of QTLs for each trait; b the three tested traits and additive effects of QTLs in single environments, and c additive effects of QTLs in single environments and corrected values for each tested trait; SH: shoot height; SNN: stem node number; AIL: average internode length; qSHt, qSNNt and qAILt represent the sum of additive effects of QTLs for SH, SNN and AIL under all environments, respectively; qSHs, qSNNs and qAILs represented the sum of additive effects of QTLs for SH, SNN and AIL in single environments, respectively; SHc, SNNc and AILc represent corrected values for soybean SH, SNN and AIL, respectively; The contributions to phenotypic variation are represented by the color and length of vectors
Fig. 4
Fig. 4
Principal component analysis (PCA) plot of relationships among plant height traits, agro-meteorological data and basic soil chemical properties. The PCA plots were drawn based on a the three plant height traits and agro-meteorological data, and b the three plant height traits and basic soil characteristics; SH: shoot height; SNN: stem node number; AIL: average internode length; AMaT: average maximum temperature; AMiT: average minimum temperature; AT: accumulated temperature; EAT: effective accumulated temperature; AD: average day-length; AN: available nitrogen; AP: available phosphorus; AK: available potassium; The contributions to phenotypic variation are represented by the color and lengths of the vectors
Fig. 5
Fig. 5
Principal component analysis (PCA) plots of relationships among detectable QTLs, agro-meteorological data and basic soil chemical properties. PCA plots were drawn based on relationships between a additive effects of QTLs in single environments and agro-meteorological data, and b additive effects of QTLs in single environments and basic soil characteristics; AMaT: average maximum temperature; AMiT: average minimum temperature; AT: accumulated temperature; EAT: effective accumulated temperature; AD: average day-length; AN: available nitrogen; AP: available phosphorus; AK: available potassium; qSHs, qSNNs and qAILs represent the sum of additive effects of QTLs on soybean shoot height, stem node number and average internode length, respectively, in single environment trials. The contributions to phenotypic variation are represented by the color and lengths of the vectors

References

    1. Khan MS, Zaidi A, Wani PA. Role of phosphate-solubilizing microorganisms in sustainable agriculture - a review. Agron Sustain Dev. 2007;27(1):29–43. doi: 10.1051/agro:2006011. - DOI
    1. Ray DK, Mueller ND, West PC, Foley JA. Yield trends are insufficient to double global crop production by 2050. PLoS One. 2013;8(6):e66428. doi: 10.1371/journal.pone.0066428. - DOI - PMC - PubMed
    1. Jez JM, Lee SG, Sherp AM. The next green movement: plant biology for the environment and sustainability. Science. 2016;353(6305):1241–1244. doi: 10.1126/science.aag1698. - DOI - PubMed
    1. Reinhardt D, Kuhlemeier C. Plant architecture. EMBO Rep. 2002;3(9):846–851. doi: 10.1093/embo-reports/kvf177. - DOI - PMC - PubMed
    1. Wang B, Steven MS, Li JY. Genetic regulation of shoot architecture. Annu Rev Plant Biol. 2018;69(1):437–468. doi: 10.1146/annurev-arplant-042817-040422. - DOI - PubMed