

Clinical Responsiveness to All-trans Retinoic Acid Is Potentiated by LSD1 Inhibition and Associated with a Quiescent Transcriptome in Myeloid Malignancies
- PMID: 33495312
- PMCID: PMC8026558
- DOI: 10.1158/1078-0432.CCR-20-4054
Clinical Responsiveness to All-trans Retinoic Acid Is Potentiated by LSD1 Inhibition and Associated with a Quiescent Transcriptome in Myeloid Malignancies
Abstract
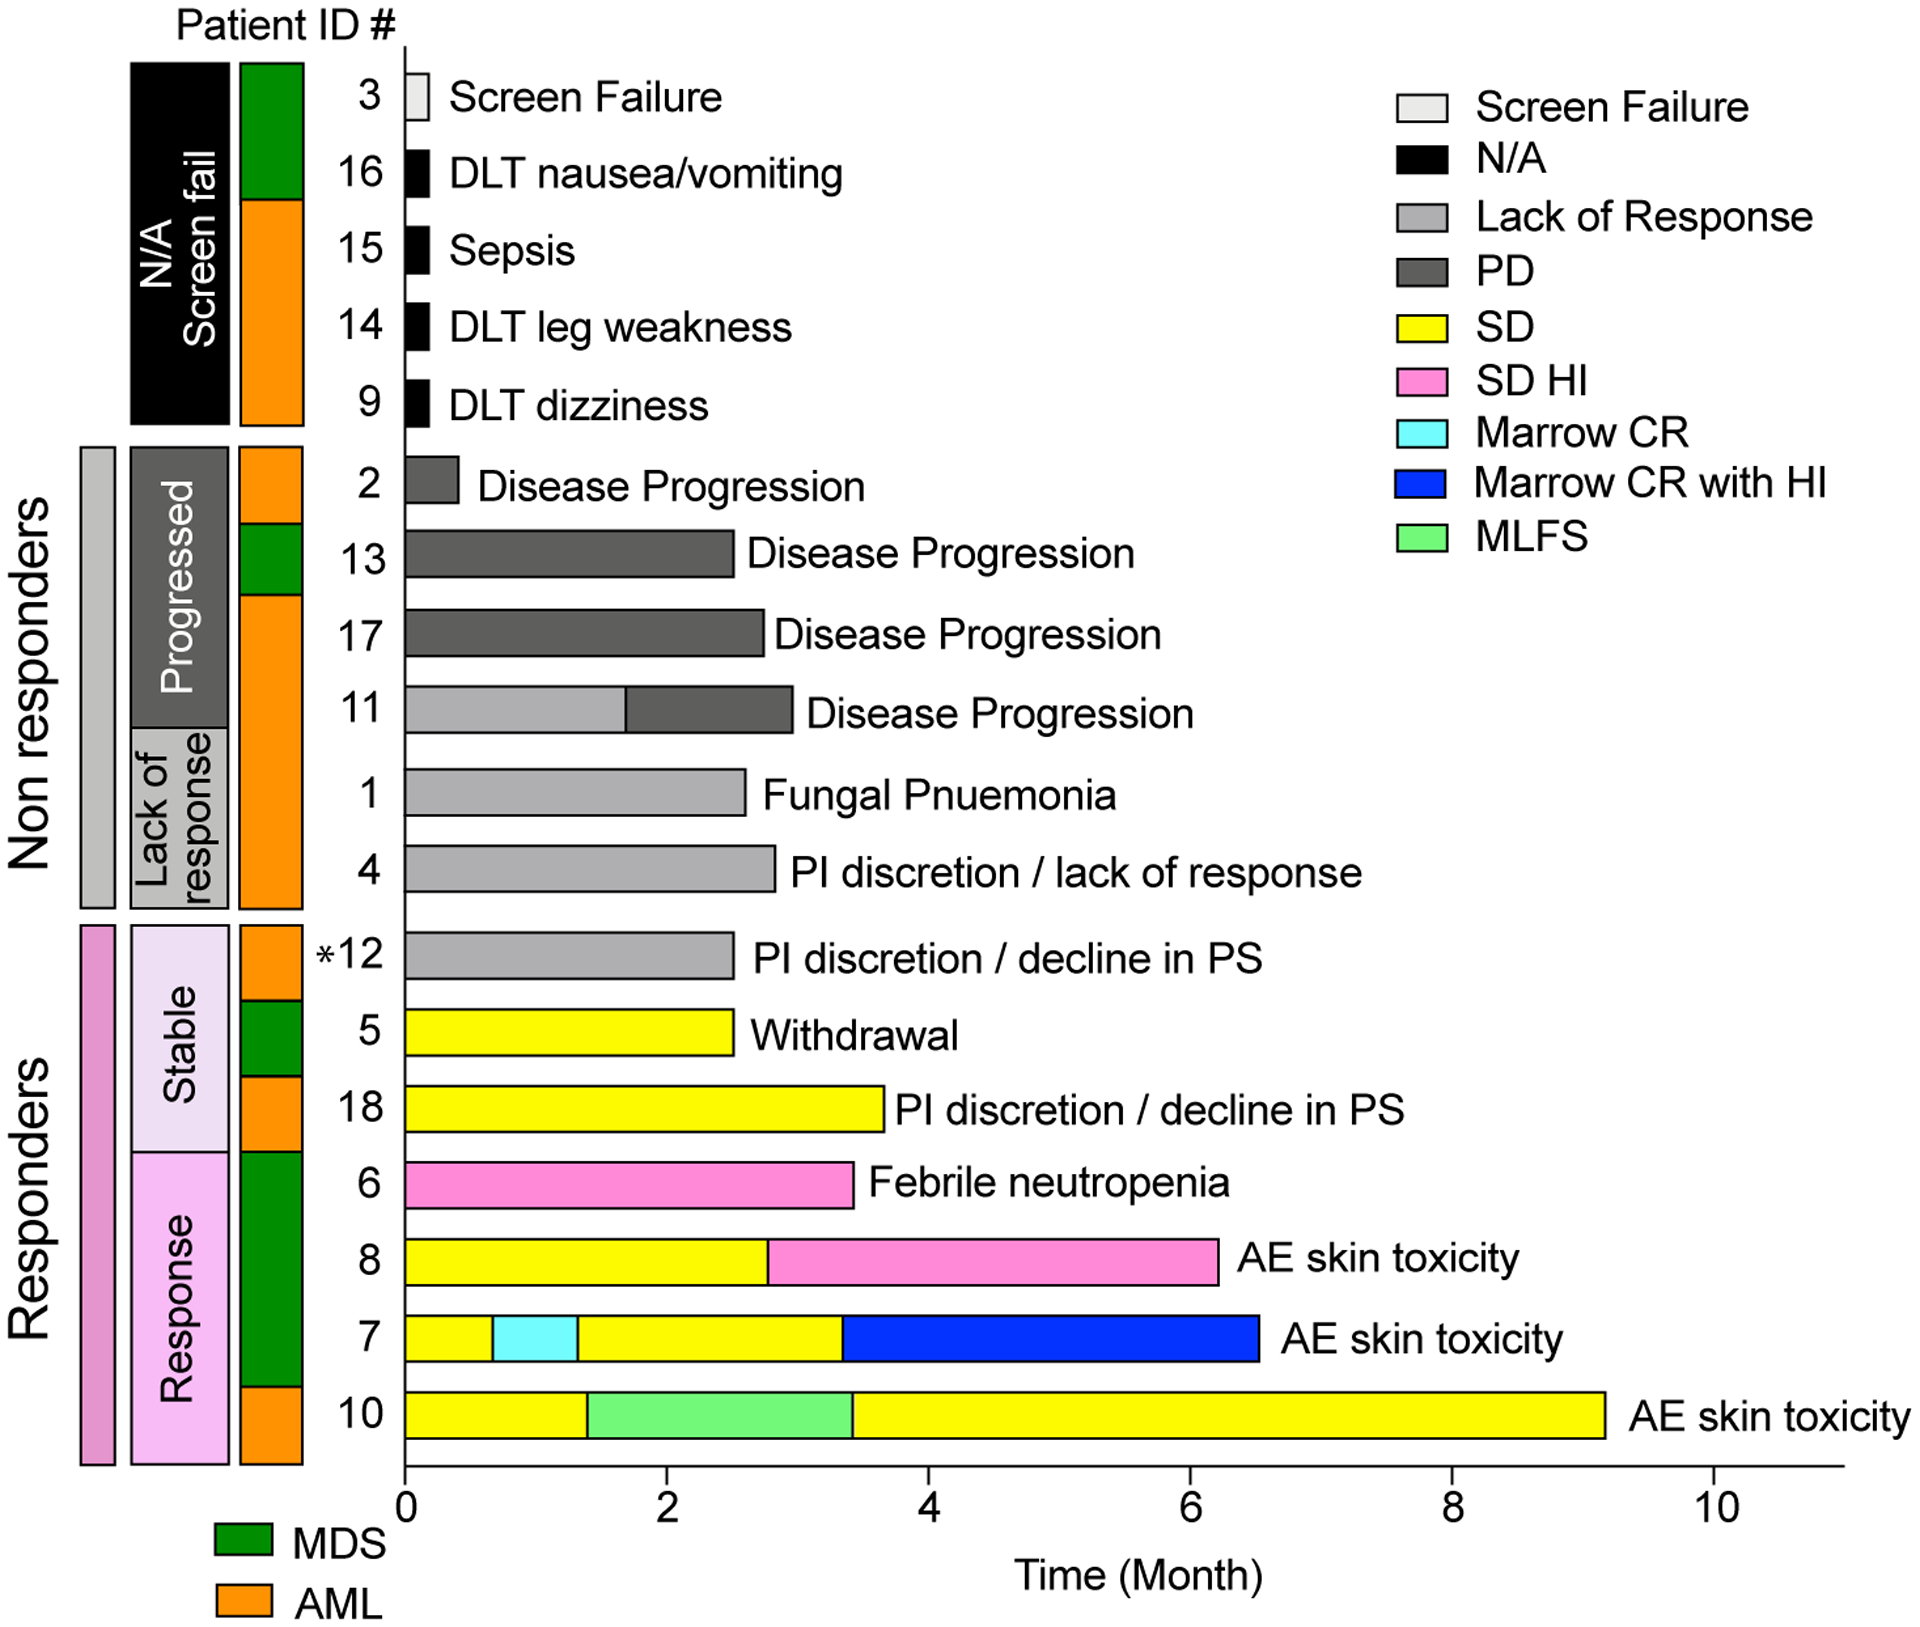
Purpose: In preclinical studies, the lysine-specific histone demethylase 1A (LSD1) inhibitor tranylcypromine (TCP) combined with all-trans retinoic acid (ATRA) induces differentiation and impairs survival of myeloid blasts in non-acute promyelocytic leukemia acute myeloid leukemia (AML). We conducted a phase I clinical trial (NCT02273102) to evaluate the safety and activity of ATRA plus TCP in patients with relapsed/refractory AML and myelodysplasia (MDS).
Patients and methods: Seventeen patients were treated with ATRA and TCP (three dose levels: 10 mg twice daily, 20 mg twice daily, and 30 mg twice daily).
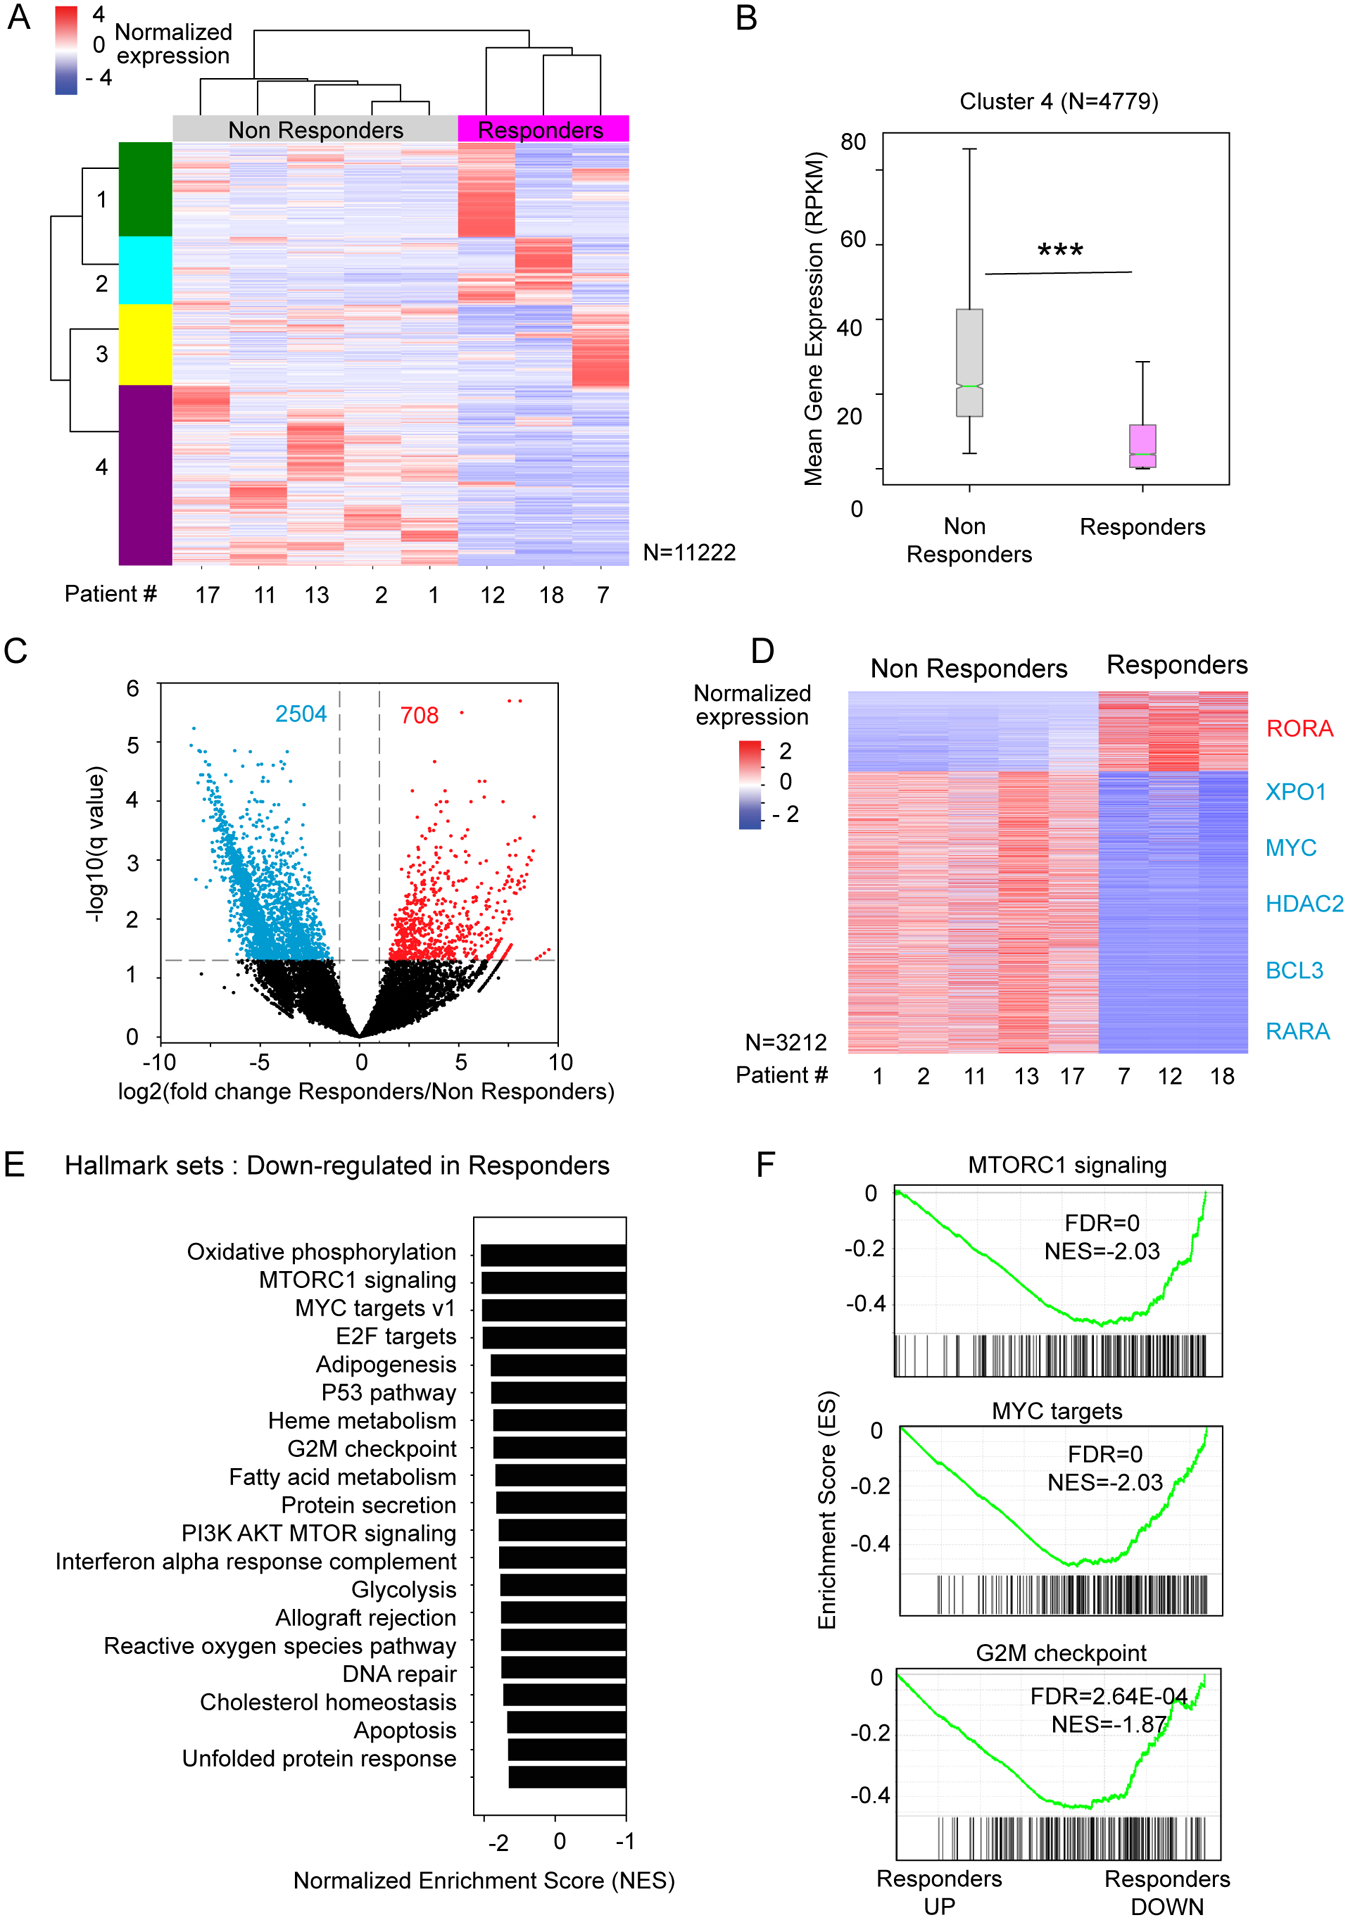
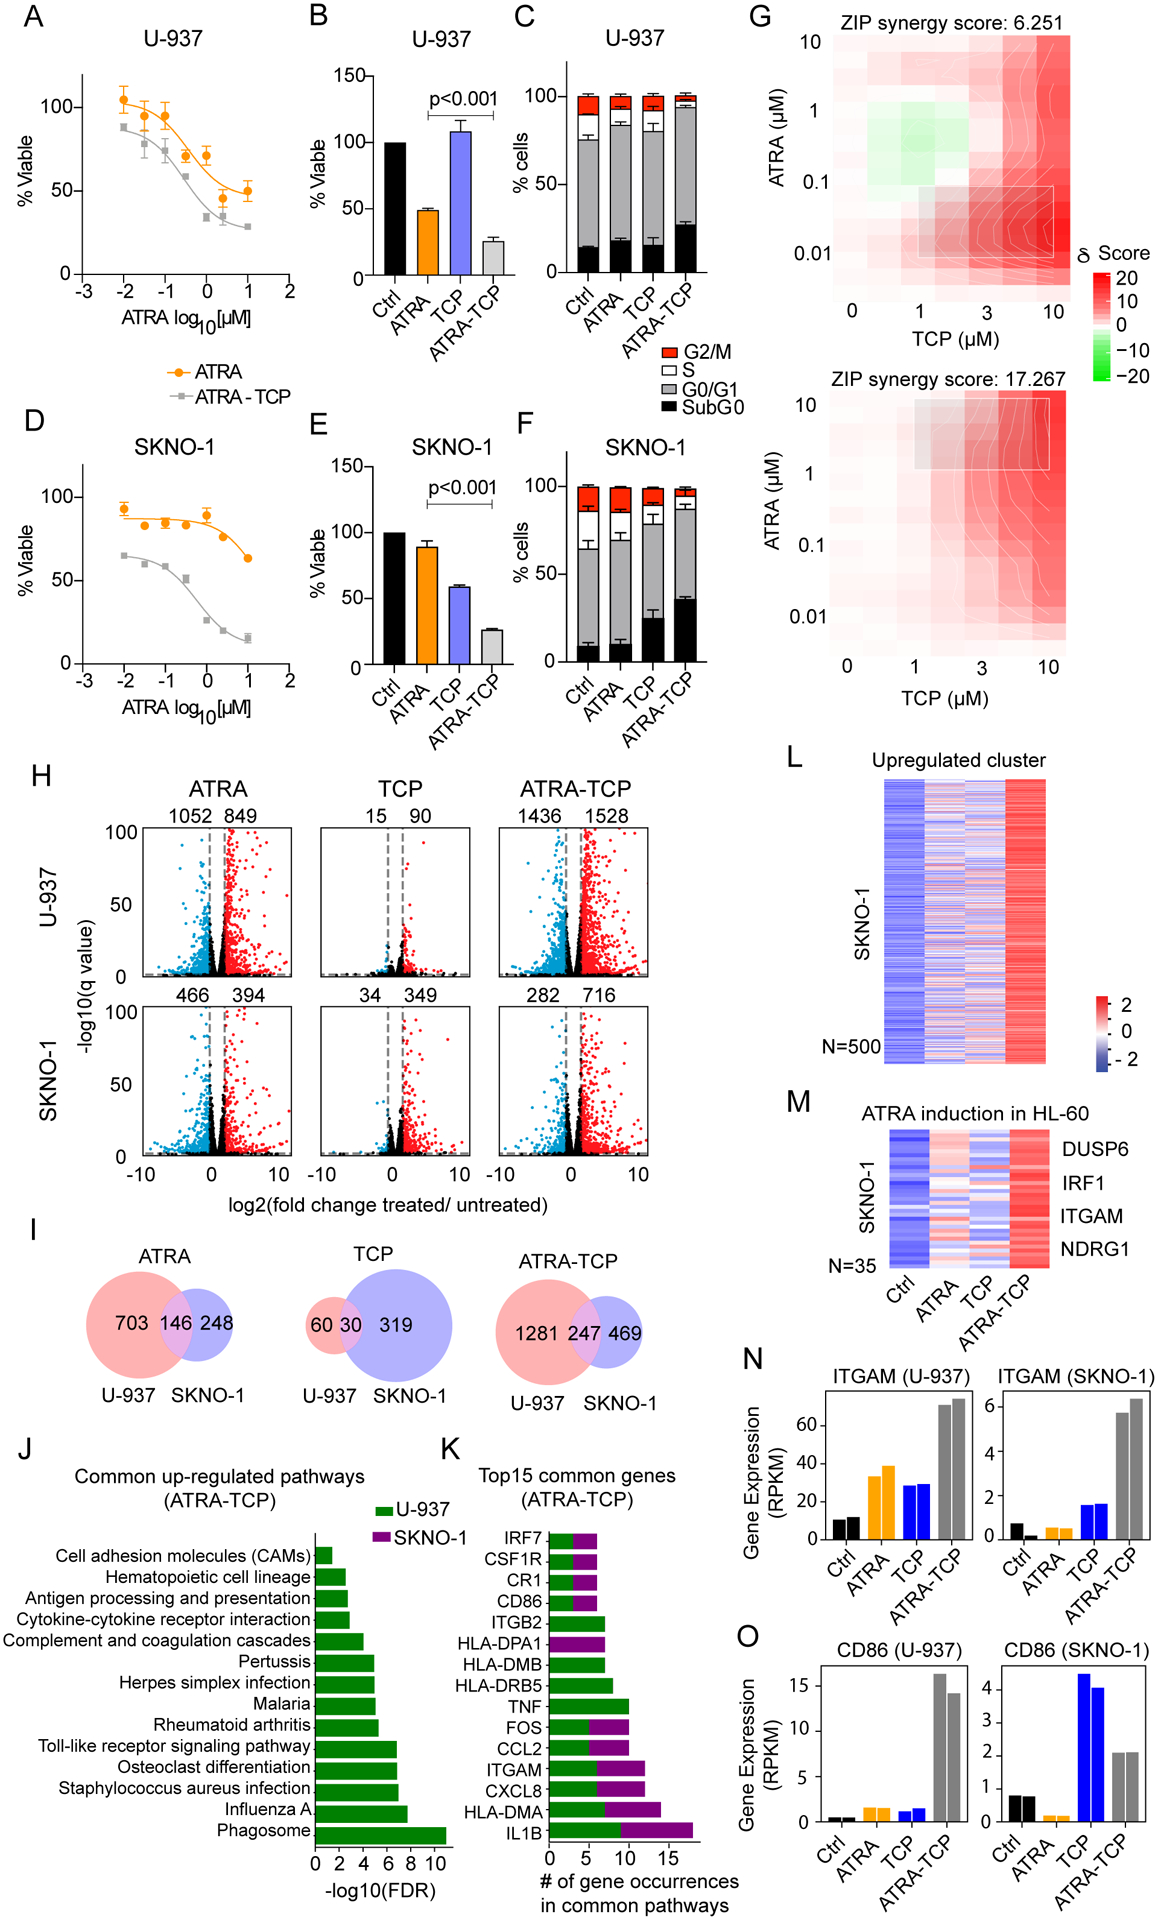
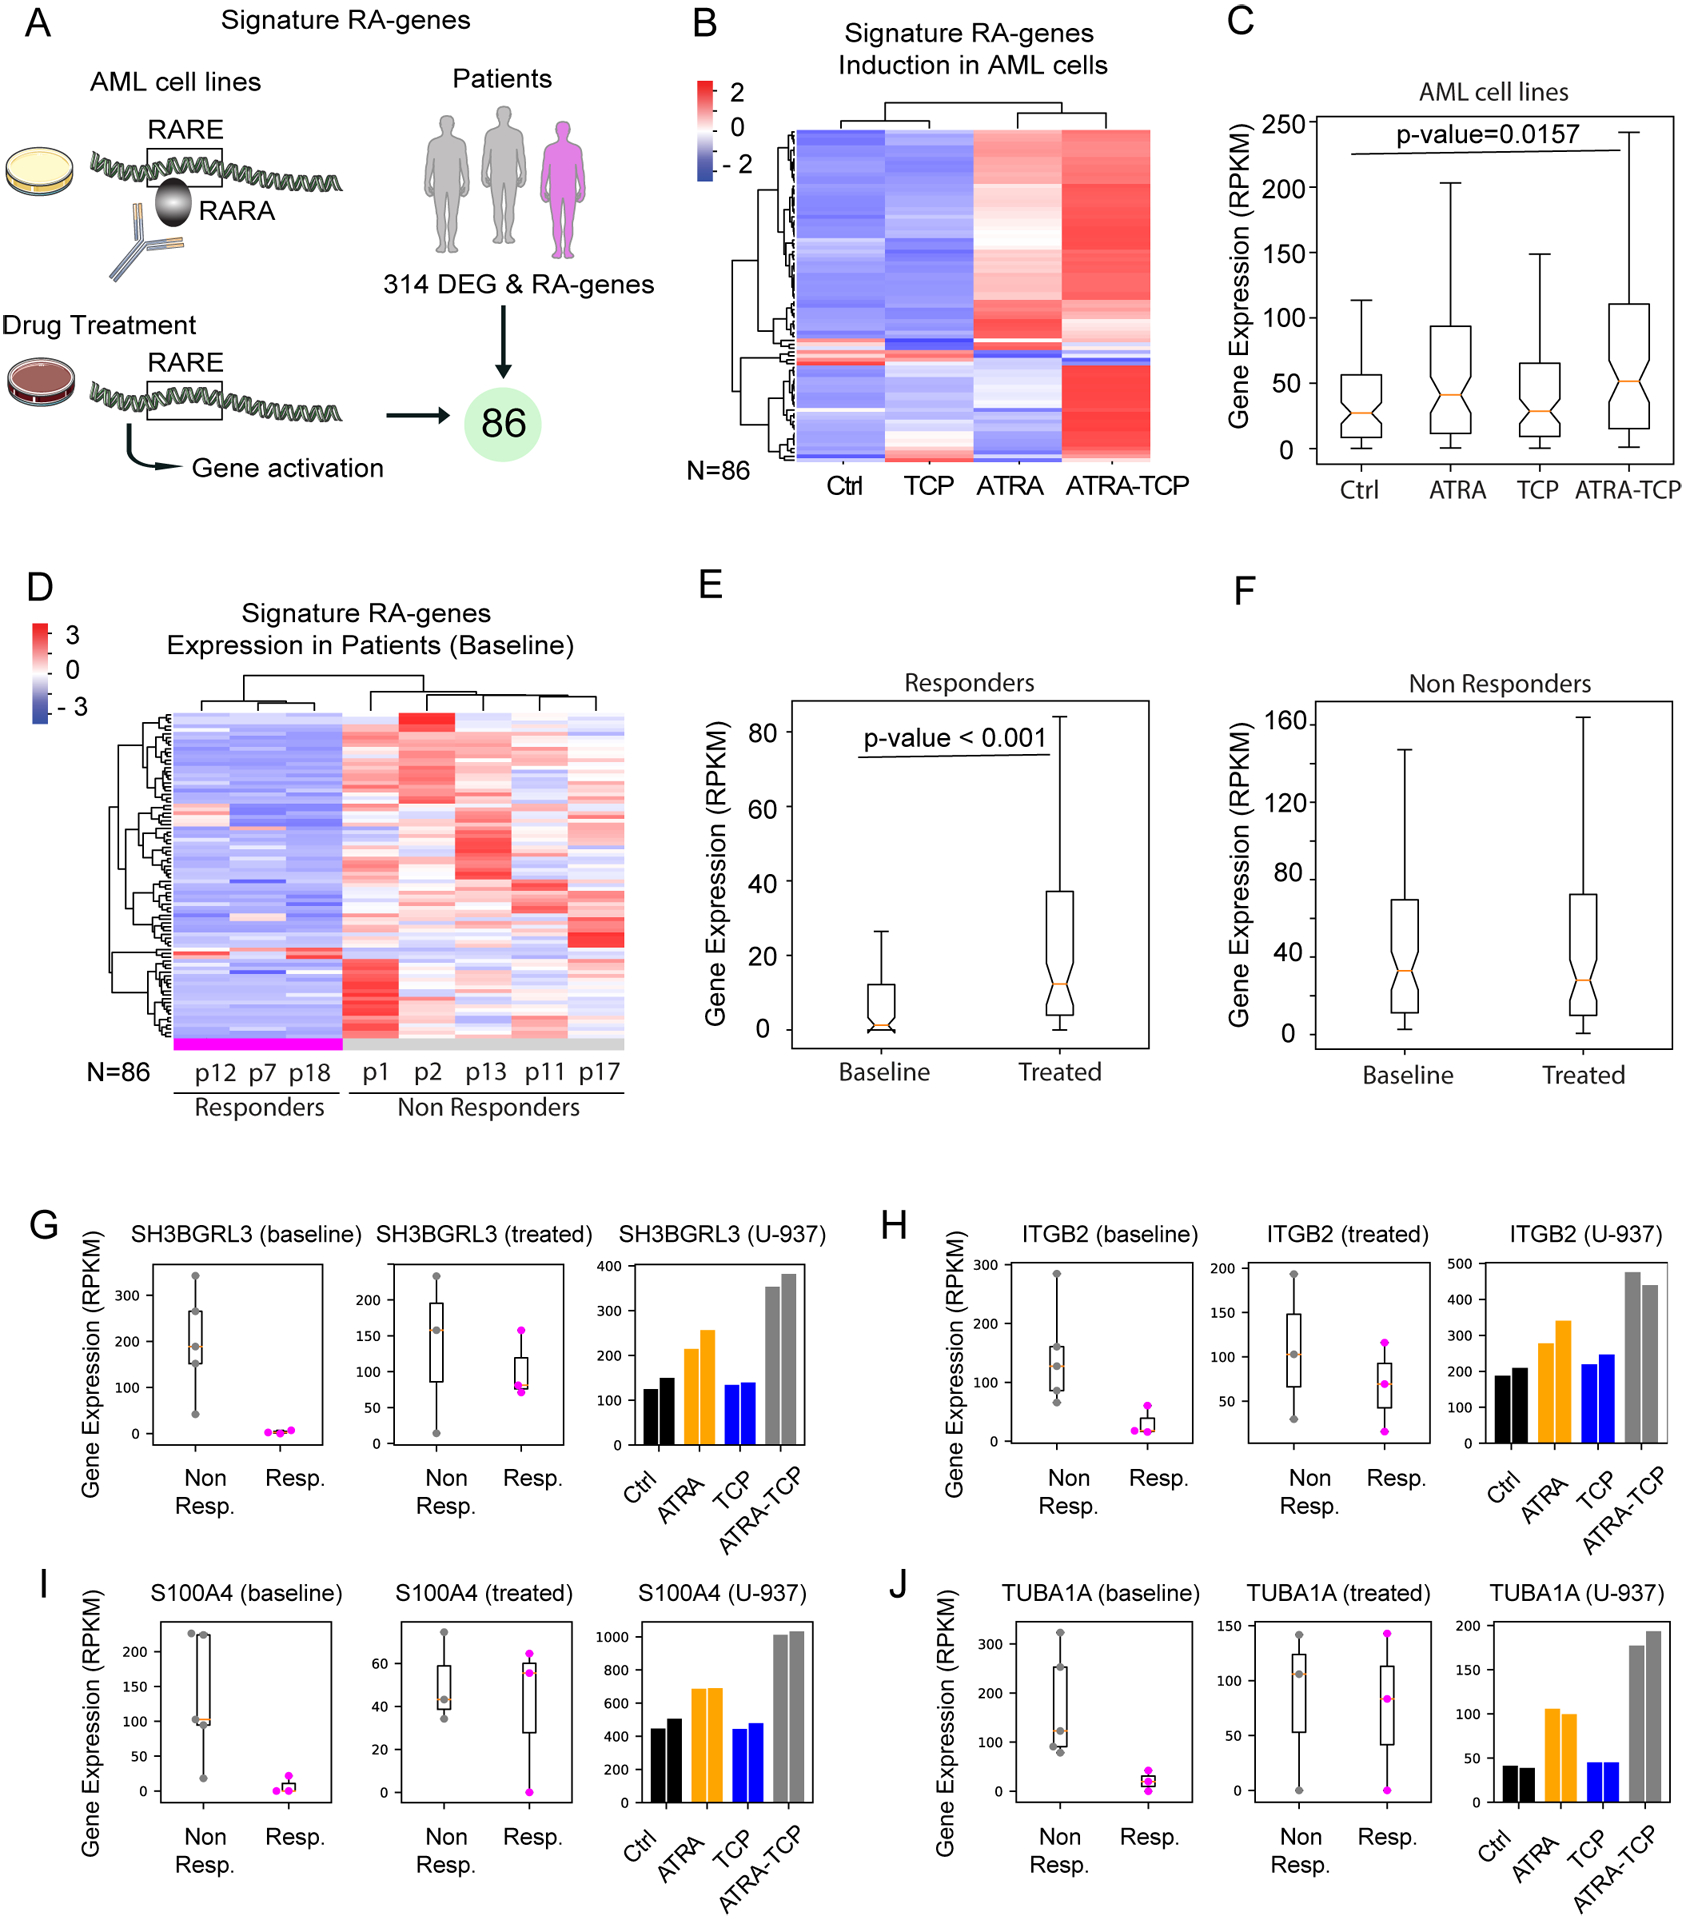
Results: ATRA-TCP had an acceptable safety profile. The MTD of TCP was 20 mg twice daily. Best responses included one morphologic leukemia-free state, one marrow complete remission with hematologic improvement, two stable disease with hematologic improvement, and two stable disease. By intention to treat, the overall response rate was 23.5% and clinical benefit rate was 35.3%. Gene expression profiling of patient blasts showed that responding patients had a more quiescent CD34+ cell phenotype at baseline, including decreased MYC and RARA expression, compared with nonresponders that exhibited a more proliferative CD34+ phenotype, with gene expression enrichment for cell growth signaling. Upon ATRA-TCP treatment, we observed significant induction of retinoic acid-target genes in responders but not nonresponders. We corroborated this in AML cell lines, showing that ATRA-TCP synergistically increased differentiation capacity and cell death by regulating the expression of key gene sets that segregate patients by their clinical response.
Conclusions: These data indicate that LSD1 inhibition sensitizes AML cells to ATRA and may restore ATRA responsiveness in subsets of patients with MDS and AML.
©2021 American Association for Cancer Research.
Conflict of interest statement
COMPETING INTERESTS
The authors declare no competing financial interests.
Figures
Similar articles
-
Sensitization of Non-M3 Acute Myeloid Leukemia Blasts to All-Trans Retinoic Acid by the LSD1 Inhibitor Tranylcypromine: TRANSATRA Phase I Study.Eur J Haematol. 2025 Sep;115(3):266-277. doi: 10.1111/ejh.14426. Epub 2025 Jun 3. Eur J Haematol. 2025. PMID: 40459012 Free PMC article. Clinical Trial.
-
Inhibition of the LSD1 (KDM1A) demethylase reactivates the all-trans-retinoic acid differentiation pathway in acute myeloid leukemia.Nat Med. 2012 Mar 11;18(4):605-11. doi: 10.1038/nm.2661. Nat Med. 2012. PMID: 22406747 Free PMC article.
-
A proof of concept phase I/II pilot trial of LSD1 inhibition by tranylcypromine combined with ATRA in refractory/relapsed AML patients not eligible for intensive therapy.Leukemia. 2021 Mar;35(3):701-711. doi: 10.1038/s41375-020-0892-z. Epub 2020 Jun 19. Leukemia. 2021. PMID: 32561840 Free PMC article. Clinical Trial.
-
Inhibitors of LSD1 as a potential therapy for acute myeloid leukemia.Expert Opin Investig Drugs. 2016 Jul;25(7):771-80. doi: 10.1080/13543784.2016.1175432. Epub 2016 Apr 21. Expert Opin Investig Drugs. 2016. PMID: 27077938 Review.
-
Effects of all-trans retinoic acid (ATRA) in addition to chemotherapy for adults with acute myeloid leukaemia (AML) (non-acute promyelocytic leukaemia (non-APL)).Cochrane Database Syst Rev. 2018 Aug 6;8(8):CD011960. doi: 10.1002/14651858.CD011960.pub2. Cochrane Database Syst Rev. 2018. PMID: 30080246 Free PMC article.
Cited by
-
Sensitization of Non-M3 Acute Myeloid Leukemia Blasts to All-Trans Retinoic Acid by the LSD1 Inhibitor Tranylcypromine: TRANSATRA Phase I Study.Eur J Haematol. 2025 Sep;115(3):266-277. doi: 10.1111/ejh.14426. Epub 2025 Jun 3. Eur J Haematol. 2025. PMID: 40459012 Free PMC article. Clinical Trial.
-
LSD1 inhibition modulates transcription factor networks in myeloid malignancies.Front Oncol. 2023 Mar 10;13:1149754. doi: 10.3389/fonc.2023.1149754. eCollection 2023. Front Oncol. 2023. PMID: 36969082 Free PMC article. Review.
-
Targeting the retinoic acid signaling pathway as a modern precision therapy against cancers.Front Cell Dev Biol. 2023 Aug 11;11:1254612. doi: 10.3389/fcell.2023.1254612. eCollection 2023. Front Cell Dev Biol. 2023. PMID: 37645246 Free PMC article. Review.
-
Targeting MAO-B with Small-Molecule Inhibitors: A Decade of Advances in Anticancer Research (2012-2024).Molecules. 2024 Dec 31;30(1):126. doi: 10.3390/molecules30010126. Molecules. 2024. PMID: 39795182 Free PMC article. Review.
-
HMG20B stabilizes association of LSD1 with GFI1 on chromatin to confer transcription repression and leukemia cell differentiation block.Oncogene. 2022 Oct;41(44):4841-4854. doi: 10.1038/s41388-022-02471-y. Epub 2022 Sep 28. Oncogene. 2022. PMID: 36171271 Free PMC article.
References
-
- Frohling S, Scholl C, Gilliland DG, Levine RL. Genetics of myeloid malignancies: pathogenetic and clinical implications. Journal of clinical oncology : official journal of the American Society of Clinical Oncology. 2005;23(26):6285–95. - PubMed
-
- Lowenberg B. Acute myeloid leukemia: the challenge of capturing disease variety. Hematology Am Soc Hematol Educ Program. 2008:1–11. - PubMed
-
- Khwaja A, Bjorkholm M, Gale RE, Levine RL, Jordan CT, Ehninger G, et al. Acute myeloid leukaemia. Nat Rev Dis Primers. 2016;2:16010. - PubMed
-
- Huang ME, Ye YC, Chen SR, Zhao JC, Gu LJ, Cai JR, et al. All-trans retinoic acid with or without low dose cytosine arabinoside in acute promyelocytic leukemia. Report of 6 cases. Chin Med J (Engl). 1987;100(12):949–53. - PubMed
-
- Huang ME, Ye YC, Chen SR, Chai JR, Lu JX, Zhoa L, et al. Use of all-trans retinoic acid in the treatment of acute promyelocytic leukemia. Blood. 1988;72(2):567–72. - PubMed
Publication types
MeSH terms
Substances
Associated data
Grants and funding
LinkOut - more resources
Full Text Sources
Other Literature Sources
Medical
Molecular Biology Databases
Research Materials
Miscellaneous
