. 2021 Feb 2;118(5):e2019768118.
doi: 10.1073/pnas.2019768118.

Genome-wide detection of cytosine methylation by single molecule real-time sequencing

Affiliations

Genome-wide detection of cytosine methylation by single molecule real-time sequencing

O Y Olivia Tse et al. Proc Natl Acad Sci U S A. .

Abstract

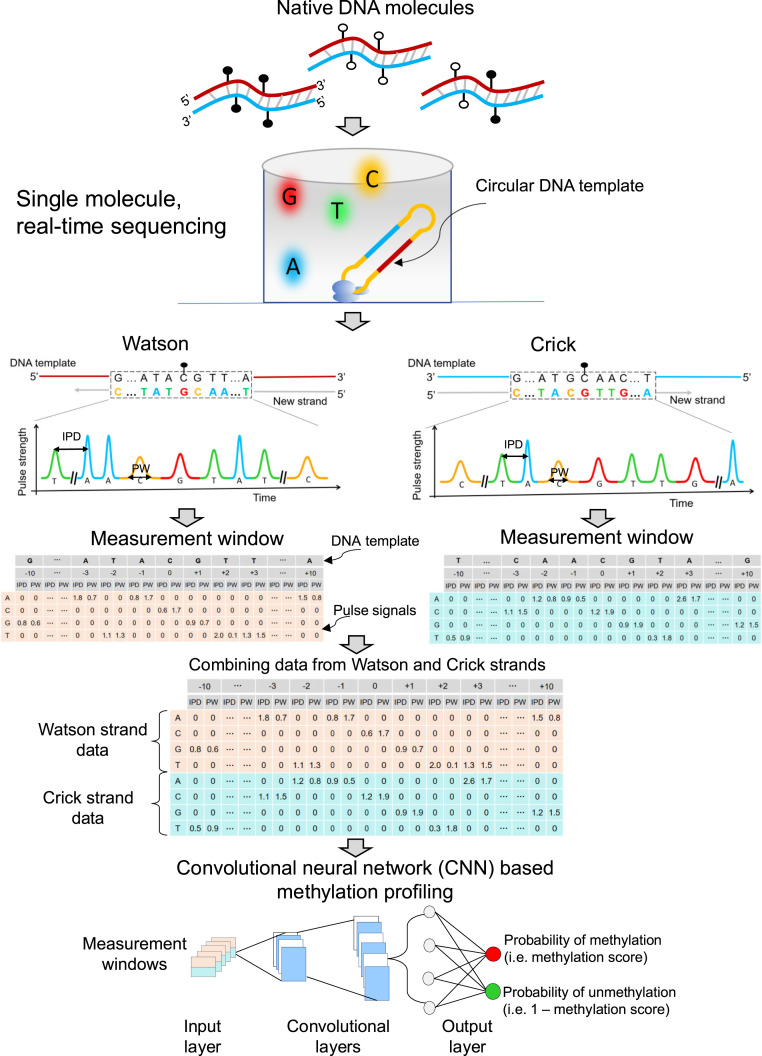
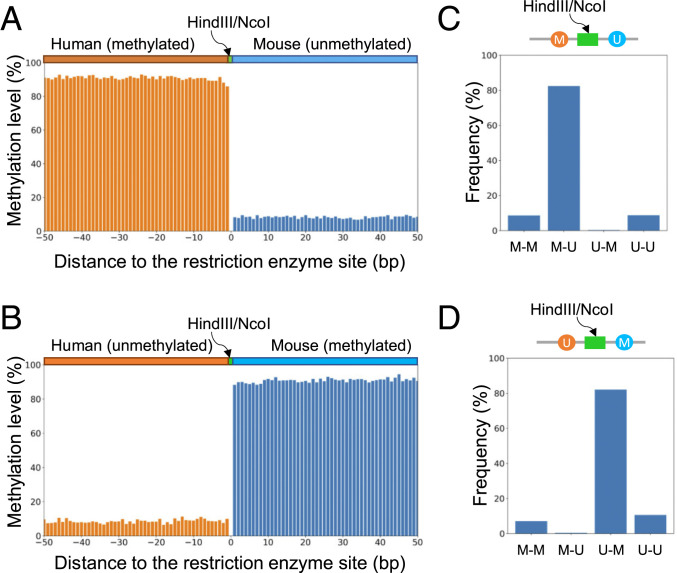
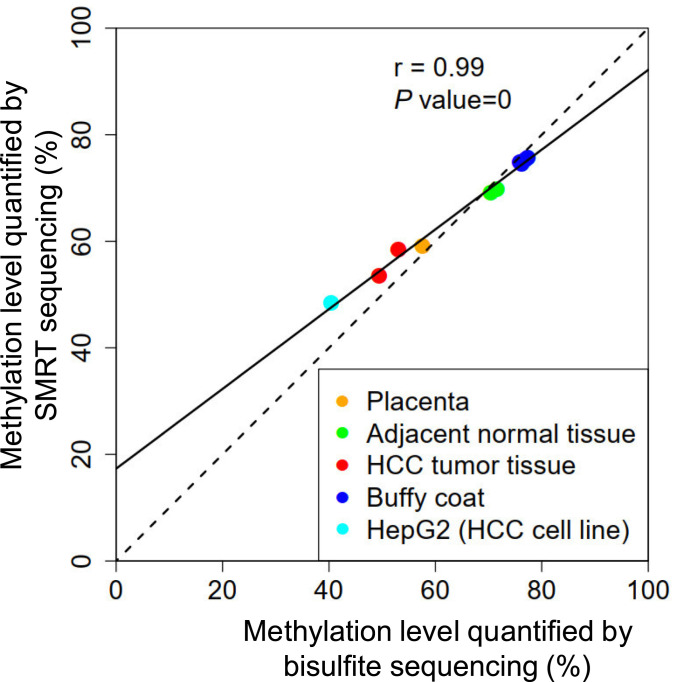
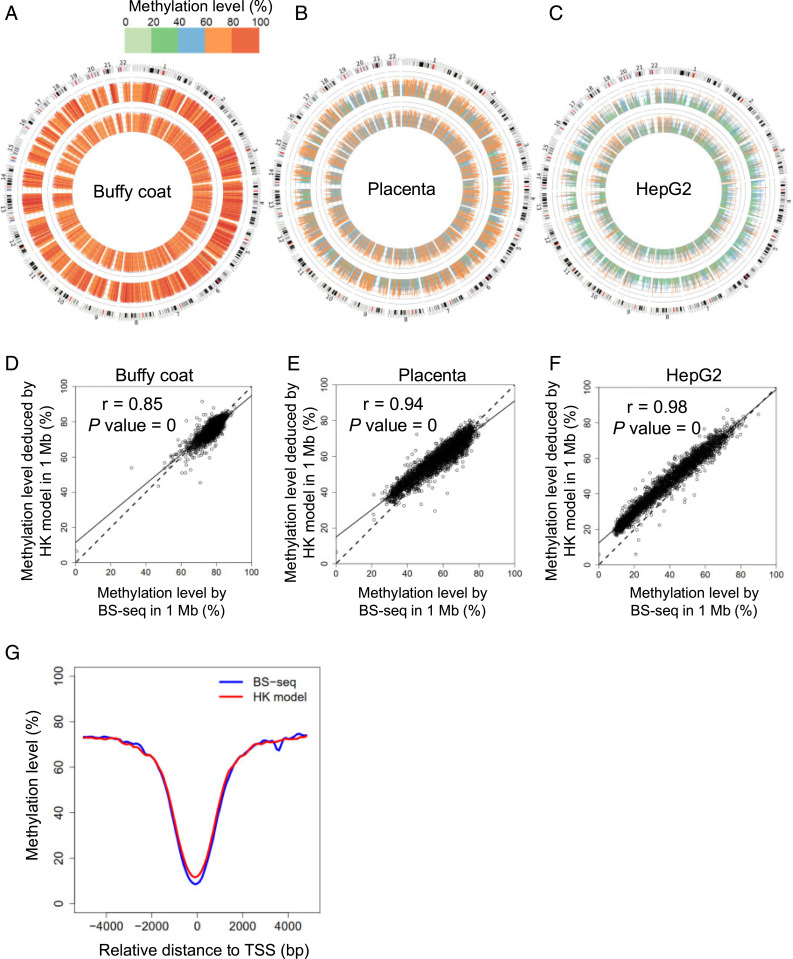
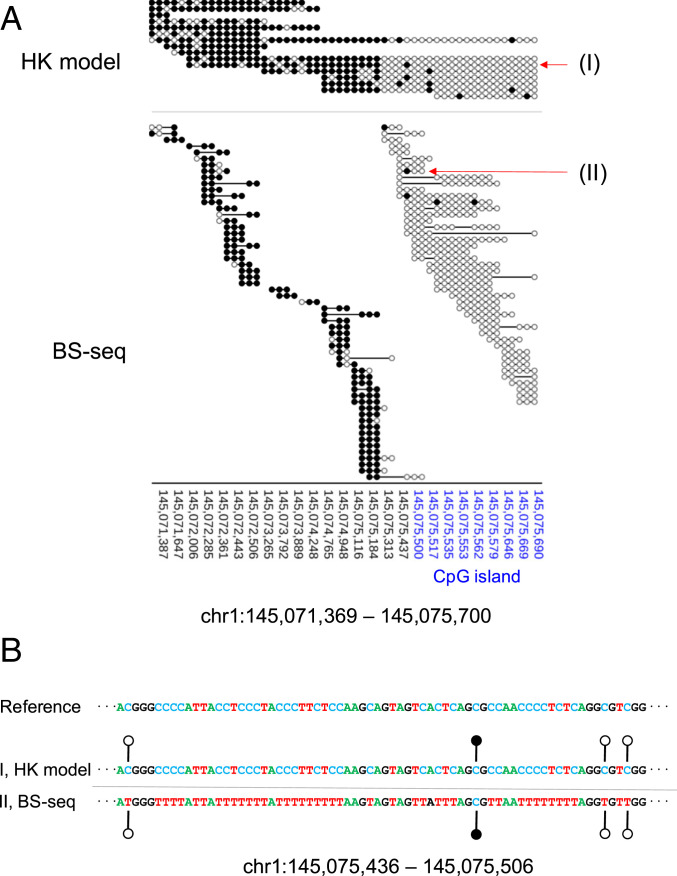
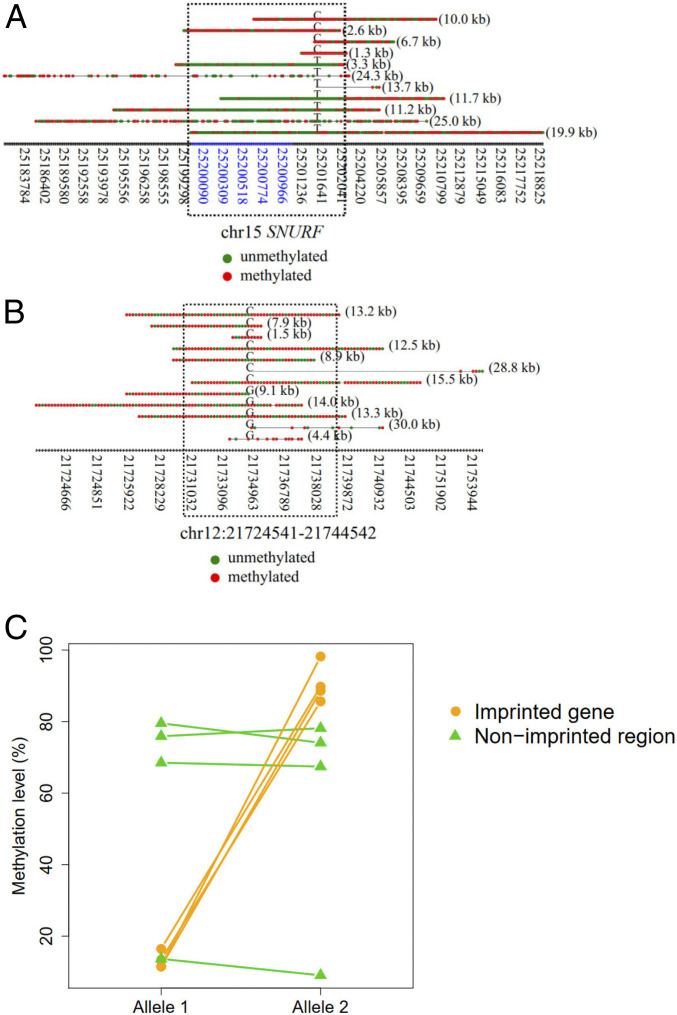
5-Methylcytosine (5mC) is an important type of epigenetic modification. Bisulfite sequencing (BS-seq) has limitations, such as severe DNA degradation. Using single molecule real-time sequencing, we developed a methodology to directly examine 5mC. This approach holistically examined kinetic signals of a DNA polymerase (including interpulse duration and pulse width) and sequence context for every nucleotide within a measurement window, termed the holistic kinetic (HK) model. The measurement window of each analyzed double-stranded DNA molecule comprised 21 nucleotides with a cytosine in a CpG site in the center. We used amplified DNA (unmethylated) and M.SssI-treated DNA (methylated) (M.SssI being a CpG methyltransferase) to train a convolutional neural network. The area under the curve for differentiating methylation states using such samples was up to 0.97. The sensitivity and specificity for genome-wide 5mC detection at single-base resolution reached 90% and 94%, respectively. The HK model was then tested on human-mouse hybrid fragments in which each member of the hybrid had a different methylation status. The model was also tested on human genomic DNA molecules extracted from various biological samples, such as buffy coat, placental, and tumoral tissues. The overall methylation levels deduced by the HK model were well correlated with those by BS-seq (r = 0.99; P < 0.0001) and allowed the measurement of allele-specific methylation patterns in imprinted genes. Taken together, this methodology has provided a system for simultaneous genome-wide genetic and epigenetic analyses.

Keywords: base modifications; epigenetics; epigenomics; third-generation sequencing.


Conflict of interest statement

Competing interest statement: A patent application on the described technology has been filed and licensed to Take2 Holdings Limited, founded by the research team.

Figures

Fig. 1.
Fig. 1.
Schematic 5mC detection using single molecule sequencing and the HK model. Double-stranded DNA molecules were ligated with hairpin adapters, forming circular DNA templates. DNA polymerase in a ZMW would incorporate nucleotides labeled with different fluorophores into the complementary strand of a DNA template, thus emitting different fluorescent colors indicating nucleotide information: for example, red, yellow, green, and blue colors represented G, C, T, and A, respectively. The light pulse signals were reflective of DNA polymerase kinetics, depending on the base modifications. Pulse signals included IPD and PW. For a cytosine subjected to methylation analysis, IPDs, PWs, and sequence context surrounding that cytosine were organized into a data matrix, referred to as a measurement window. For illustration purposes, the 10 nt upstream and downstream of the cytosine within a CpG site in question were presented as 5′-G[CCATGC]ATACGTT[GATGCA]A-3′ for the Watson strand. The bases in the brackets were left out (denoted by “…”) for the sake of simplicity. In this case, the measurement window size, including the interrogated cytosine in the middle, was 21 nt. For a position of -3 corresponding to the base of adenine (“A”), the IPD (1.8) and PW (0.7) associated with “A” were filled in the corresponding cells between a column of “-3” and a row of “A.” The other cells in the same columns were filled by “0.” The remaining IPDs and PWs related to the 21-nt sequence context were filled in that measurement window based on the same rule. The kinetic signals and sequence context originating from the Crick strand (‘5-T[TTGCAT]CAACGTA[TGCATG]G-3′) were also processed similarly. The measurement windows for two CpG sites complementary to each other (i.e., the Watson strand and the Crick strand) were combined for downstream analysis. A number of combined measurement windows originating from methylated and unmethylated cytosines were used for training a CNN, so as to differentiate methylated and unmethylated cytosines in test samples. CNN involved input layer, convolutional layers, and output layer. The measurement windows were fed into the input layer, followed by the process of convolutional layers; then, the probability of methylation (range: 0 to 1) for a CpG was generated through the output layer based on a sigmoid function. This approach was referred to as the “holistic kinetic (HK) model” (HK model).
Fig. 2.
Fig. 2.
The HK model training and validation using datasets generated from amplified DNA and M.SssI-treated DNA. (A) Box plots for methylation scores in training datasets derived from the whole genome amplified DNA (WGA DNA dataset) and M.SssI-treated DNA (M.SssI-treated DNA dataset) on the basis of different sequencing kits including Sequel I sequencing kit 3.0 and Sequel II sequencing kit 1.0 and 2.0. (B) ROC curves for training datasets on the basis of different sequencing kits. (C) Box plots for the methylation scores in testing datasets. (D) ROC curves for testing datasets.
Fig. 3.
Fig. 3.
Methylation pattern analysis for human–mouse hybrid fragments. (A) Methylation levels across CpG sites from human–mouse hybrid fragments present in the human (meth)–mouse (unmeth) dataset. CpG sites were pooled together according to the relative distance to the nearest base of a restriction cutting site (HindIII or NcoI). (B) Methylation levels across CpG sites from human–mouse hybrid fragments present in the human (unmeth)–mouse (meth) dataset. (C) Methylation patterns for the two nearest CpG sites immediately flanking a restriction cutting site (HindIII or NcoI) for human–mouse hybrid fragments present in the human (meth)–mouse (unmeth) dataset. (D) Methylation patterns for two CpG sites immediately flanking a restriction cutting site (HindIII/NcoI) for human–mouse hybrid fragments present in the human (unmeth)–mouse (meth) dataset. “M-M” represents that the first and second CpG sites in the human and mouse parts are both methylated. “M-U” represents that the first CpG site in the human part is methylated while the second CpG site in the mouse part is unmethylated. “U-M” represents that the first CpG site in the human part is unmethylated while the second CpG site in the mouse part is methylated. “U-U” represents that the first and second CpG sites in the human and mouse parts are both unmethylated.
Fig. 4.
Fig. 4.
Correlation of overall methylation levels quantified by BS-seq and the HK model. Each dot represents one sample.
Fig. 5.
Fig. 5.
Methylation levels quantified by BS-seq and the HK model at 1-Mb resolution. Circos plots show methylation levels determined by the HK model (inner ring) and BS-seq (outer ring) across different 1-Mb regions of human genome for buffy coat (A), placenta (B), and the HepG2 HCC cell line (C). Scatter plots show correlations of methylation level in each 1-Mb genomic region determined by the HK model and BS-seq for buffy coat (D), placenta (E), and the HepG2 HCC cell line (F). (G) Methylation patterns surrounding TSSs.
Fig. 6.
Fig. 6.
Methylation patterns at single-base resolution. (A) Methylation patterns for the region chr1: 145,071,369 to 145,075,700 overlapping the CGI. The genomic coordinates of the CGI are highlighted in blue. “(I)” and “(II)” represent two sequence reads that are used to highlight the difference in the readout between the HK model and BS-seq. (B) Genetic and epigenetic information generated using the HK model (denoted “I”) and BS-seq (denoted “II”). For the ease of visualization, A, C, T, and G are denoted in different colors. For the HK model, the original genomic sequence and methylation information are directly and simultaneously read out from the results. For BS-seq, the interpretation of a “TG” readout (i.e., whether the T means an unmethylated cytosine, or whether a T is present at that position in the genome) can only be made after comparison with the reference genomic sequence. Filled lollipops, methylated C; unfilled lollipops, unmethylated C.
Fig. 7.
Fig. 7.
Methylation patterns for each single molecule derived from imprinted regions. (A) An example showing the methylation patterns for each DNA molecule in association with imprinted regions of gene SNURF. The x axis indicates the coordinates of CpG sites. The coordinates highlighted in blue indicate CGIs. Red dots indicate methylated CpG sites. Green dots indicate unmethylated CpG sites. The alphabet embedded among each horizontal series red and green dots (i.e., CpG sites) indicates the allele at the SNP site. The numbers in parentheses on the right of each horizontal series of dots indicate the size of a fragment. The dashed rectangle indicates the regions overlapped with the known imprinting control region. (B) An example showing the methylation patterns for each DNA molecule originating from nonimprinted regions. The dashed rectangle indicates a region surrounding the SNP site highlighted for comparison. (C) Methylation levels between imprinted and nonimprinted regions.

References

    1. Feinberg A. P., The key role of epigenetics in human disease prevention and mitigation. N. Engl. J. Med. 378, 1323–1334 (2018). - PMC - PubMed
    1. Smith Z. D., Meissner A., DNA methylation: Roles in mammalian development. Nat. Rev. Genet. 14, 204–220 (2013). - PubMed
    1. Hofer A., Liu Z. J., Balasubramanian S., Detection, structure and function of modified DNA bases. J. Am. Chem. Soc. 141, 6420–6429 (2019). - PubMed
    1. Olova N., et al. , Comparison of whole-genome bisulfite sequencing library preparation strategies identifies sources of biases affecting DNA methylation data. Genome Biol. 19, 33 (2018). - PMC - PubMed
    1. Grunau C., Clark S. J., Rosenthal A., Bisulfite genomic sequencing: Systematic investigation of critical experimental parameters. Nucleic Acids Res. 29, E65 (2001). - PMC - PubMed

Publication types