. 2021 Feb 2;118(5):e2012327118.
doi: 10.1073/pnas.2012327118.

Anomalous influenza seasonality in the United States and the emergence of novel influenza B viruses

Affiliations

Anomalous influenza seasonality in the United States and the emergence of novel influenza B viruses

Rebecca K Borchering et al. Proc Natl Acad Sci U S A. .

Abstract

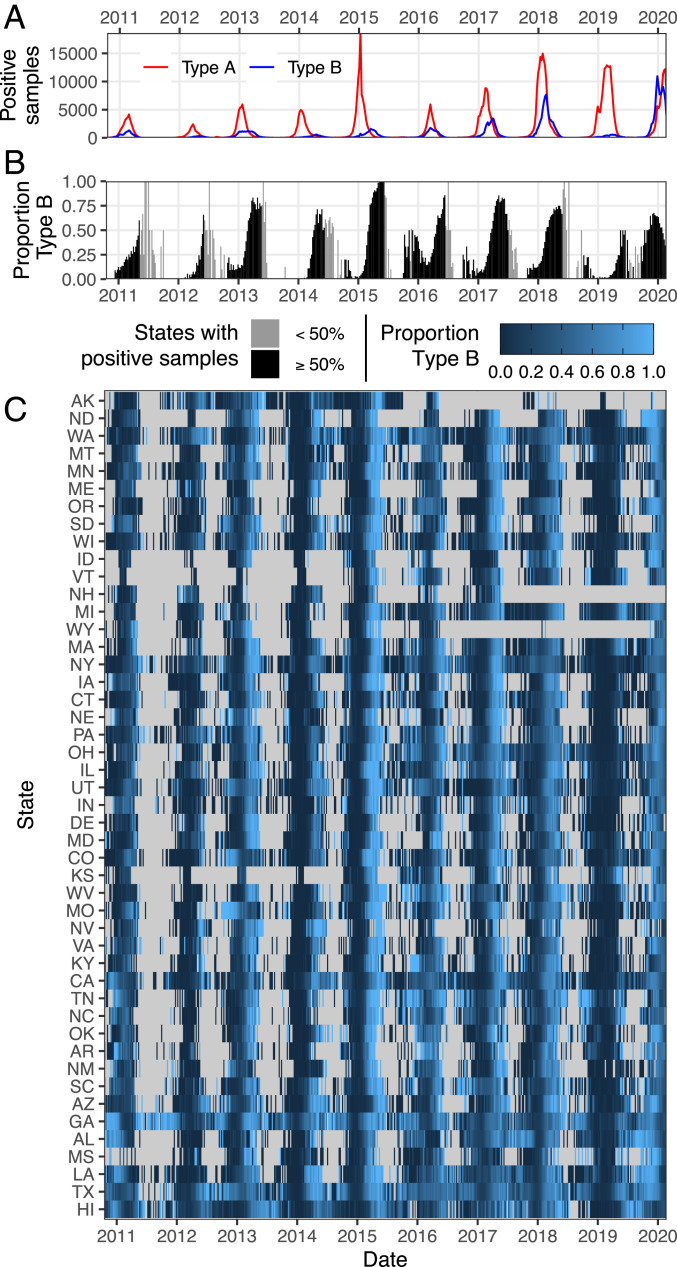
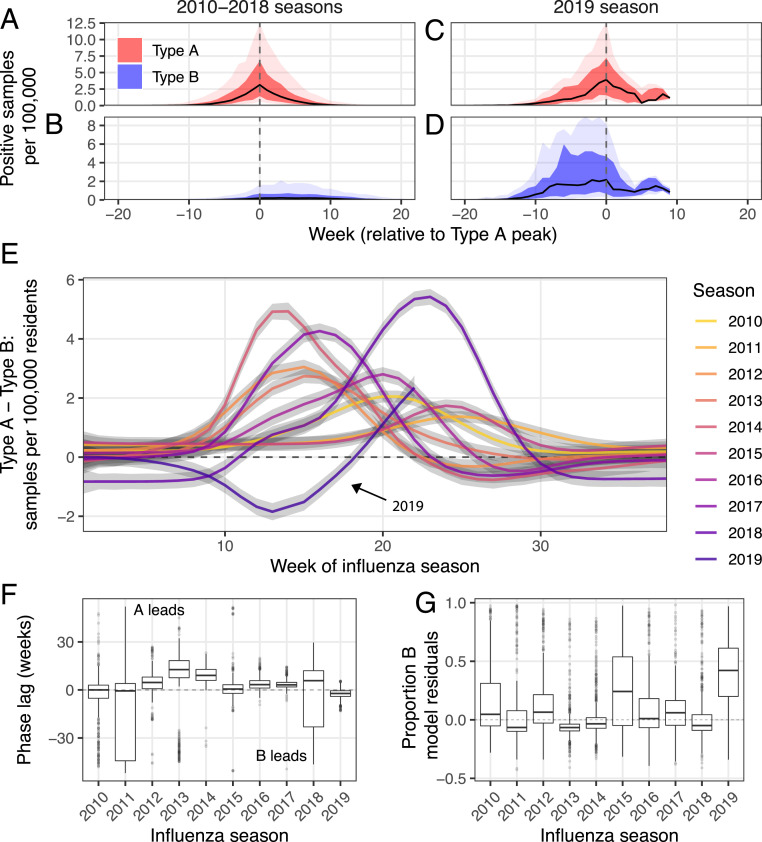
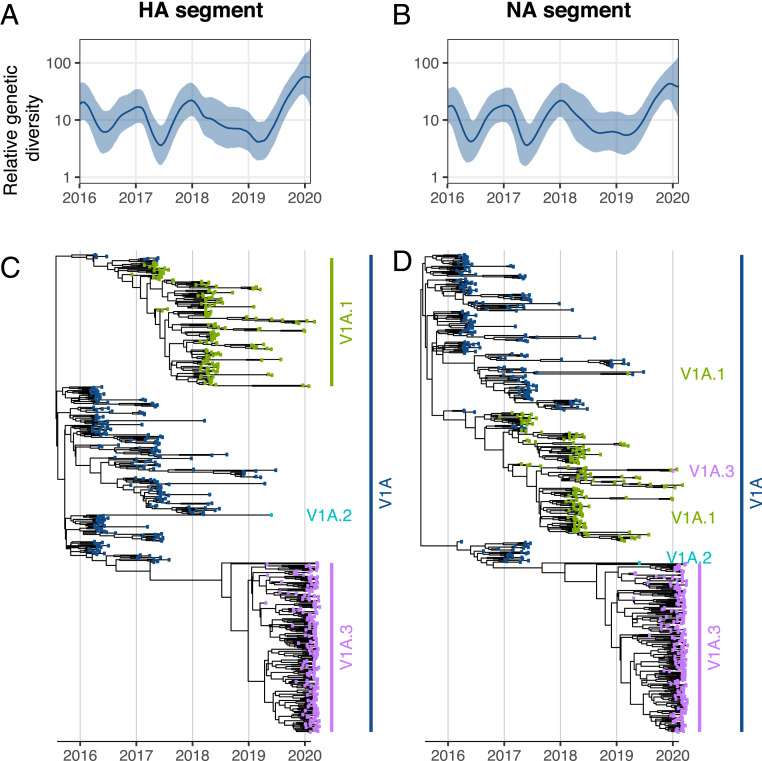
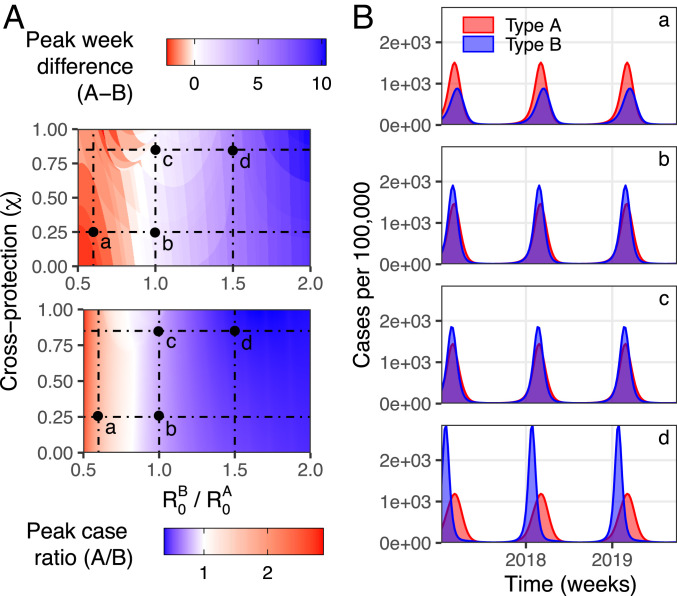
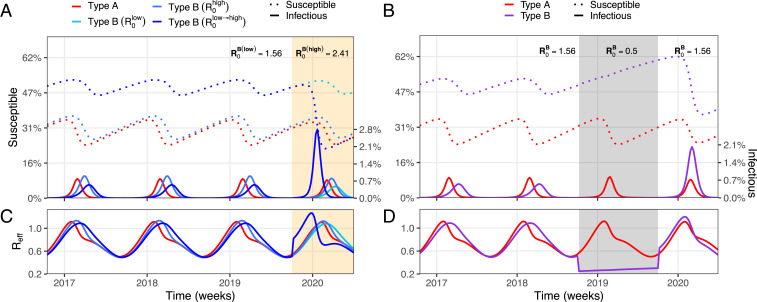
The 2019/2020 influenza season in the United States began earlier than any season since the 2009 H1N1 pandemic, with an increase in influenza-like illnesses observed as early as August. Also noteworthy was the numerical domination of influenza B cases early in this influenza season, in contrast to their typically later peak in the past. Here, we dissect the 2019/2020 influenza season not only with regard to its unusually early activity, but also with regard to the relative dynamics of type A and type B cases. We propose that the recent expansion of a novel influenza B/Victoria clade may be associated with this shift in the composition and kinetics of the influenza season in the United States. We use epidemiological transmission models to explore whether changes in the effective reproduction number or short-term cross-immunity between these viruses can explain the dynamics of influenza A and B seasonality. We find support for an increase in the effective reproduction number of influenza B, rather than support for cross-type immunity-driven dynamics. Our findings have clear implications for optimal vaccination strategies.

Keywords: epidemiological models; genetic diversity; influenza; statistical inference; viral interference.


Conflict of interest statement

The authors declare no competing interest.

Figures

Fig. 1.
Fig. 1.
Timing of influenza type A and type B epidemics in the United States. (A) Weekly national total of positive samples by type (see SI Appendix, Fig. S1 for total number of samples tested weekly by state). (B) Proportion of positive samples of type B (weekly median of all states). Gray shows periods of limited reporting (less than 50% of states reporting positive samples). (C) Weekly state-level proportion of positive samples that are type B. Gray indicates weeks lacking positive samples (either because positive A and positive B counts were both reported as zero or because one or more of these counts were not reported). States are organized from north to south (top to bottom). Weekly state-level type A and type B positive samples per 100,000 individuals are presented in SI Appendix, Figs. S2 and S3, respectively.
Fig. 2.
Fig. 2.
Relative timing of positive influenza samples of type A and type B. (A and B) For each state and influenza season (excluding the 2019 season), we identify the week with the largest number of positive type A samples per 100,000 individuals. We then recenter these peak weeks at week zero and consider other weeks of each season relative to their corresponding peak A reference week. We then summarize the distribution of positive samples in each relative week (median in black, IQR and 80% CI in dark and light shading, respectively). In C and D, we repeat this analysis for the (incomplete) 2019 season (and thus contain fewer observations). A and C show type A (red) and B and D show type B (blue). See also SI Appendix, Fig. S9. (E) Generalized additive model fit showing, for each season (indicated by color), the expected weekly difference (per 100,000 individuals) in positive samples between types A and B (gray shading shows 95% CI). Observed values for each week–state pair are displayed for each season in SI Appendix, Fig. S11. (F) Phase lag between weekly type A and type B samples for weeks within seasons 2010 to 2019 (median, IQR indicated by boxplot). Dominant periods for each time series were calculated using wavelet transform, with relevant phases extracted from filtered time series using a low-pass filter with cutoff period of 1 y (Materials and Methods). (G) Performance of season-specific GAMs of weekly proportion of positive samples that are type B, displayed as model residuals (the difference between observed and predicted proportions; Materials and Methods and SI Appendix, Figs. S12 and S13).
Fig. 3.
Fig. 3.
Phylodynamic analysis of influenza B/Victoria viruses in the United States. (A and B) Relative genetic diversity of HA and NA gene segments estimated using a Bayesian Skyride model with Gaussian Markov random field (GMRF) smoothing. (C and D) Reconstructed temporal phylogenies for HA and NA gene segments, respectively. Tip color on phylogenies denotes subclades (V1A.1 to 3) determined by the HA gene segment.
Fig. 4.
Fig. 4.
Simulation study reflecting dynamic effects of cross-protection (χAB=χBA=χ) and relative changes in type-specific R0s. (A) The difference in the epidemic phases of types A and B (Top) and the peaks ratios (Bottom) of the two influenza types with relative changes of R0B with respect to R0A (horizontal axis). (B) Epidemic dynamics (cases per 100,000) for the two types resulting from parameter values selected at points a, b, c, and d in A. R0A is fixed at 2, and duration of cross-protection is fixed at 1 m. Type-specific immunity is assumed to last 4 y for both types.
Fig. 5.
Fig. 5.
Illustration of our hypothesis. (A) Simulation experiments demonstrating susceptible dynamics (dotted lines) and the corresponding relative timing and amplitude of influenza A (solid red line) and influenza B (solid blue lines). For influenza B, we depict three distinct scenarios: R0B is low throughout (=1.56) or high throughout (=2.41), or R0B starts low (=1.56), but increases (=2.41) at the start of the 2019 season (highlighted in orange). The associated effective reproductive numbers (Reff=R0×SN) are presented in C. B and D present similar information to that in A and C but perform an alternative experiment, testing whether the absence of an influenza B outbreak in the 2018/2019 season highlighted in gray and resulting accumulation of susceptible individuals alone would explain the anomalous dynamics in influenza season 2019. Parameter values are presented in Table 2 and SI Appendix, Table S5.

References

    1. Smith D. J., et al. , Mapping the antigenic and genetic evolution of influenza virus. Science 305, 371–376 (2004). - PubMed
    1. Koelle K., Rasmussen D. A., The effects of a deleterious mutation load on patterns of influenza A/H3N2’s antigenic evolution in humans. Elife 4, e07361 (2015). - PMC - PubMed
    1. Plotkin J. B., Dushoff J., Levin S. A., Hemagglutinin sequence clusters and the antigenic evolution of influenza A virus. Proc. Natl. Acad. Sci. U.S.A. 99, 6263–6268 (2002). - PMC - PubMed
    1. Bedford T., et al. , Integrating influenza antigenic dynamics with molecular evolution. elife 3, e01914 (2014). - PMC - PubMed
    1. Linderman S. L., et al. , Potential antigenic explanation for atypical H1N1 infections among middle-aged adults during the 2013–2014 influenza season. Proc. Natl. Acad. Sci. U.S.A. 111, 15798–15803 (2014). - PMC - PubMed

Publication types

LinkOut - more resources