. 2021 Mar 2;96(9):e1369-e1382.
doi: 10.1212/WNL.0000000000011528. Epub 2021 Jan 25.

Natural History, Phenotypic Spectrum, and Discriminative Features of Multisystemic RFC1 Disease

Collaborators, Affiliations

Natural History, Phenotypic Spectrum, and Discriminative Features of Multisystemic RFC1 Disease

Andreas Traschütz et al. Neurology. .

Abstract

Objective: To delineate the full phenotypic spectrum, discriminative features, piloting longitudinal progression data, and sample size calculations of replication factor complex subunit 1 (RFC1) repeat expansions, recently identified as causing cerebellar ataxia, neuropathy, vestibular areflexia syndrome (CANVAS).

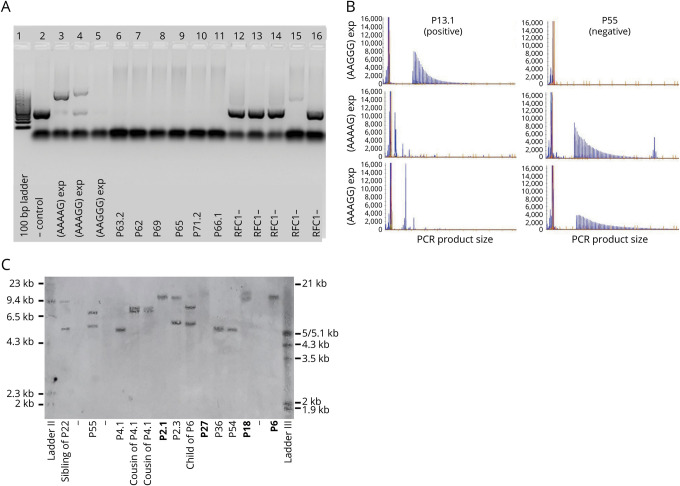
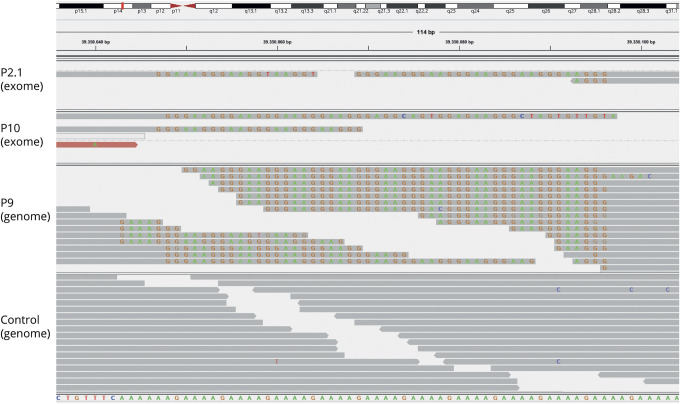
Methods: Multimodal RFC1 repeat screening (PCR, Southern blot, whole-exome/genome sequencing-based approaches) combined with cross-sectional and longitudinal deep phenotyping in (1) cross-European cohort A (70 families) with ≥2 features of CANVAS or ataxia with chronic cough (ACC) and (2) Turkish cohort B (105 families) with unselected late-onset ataxia.

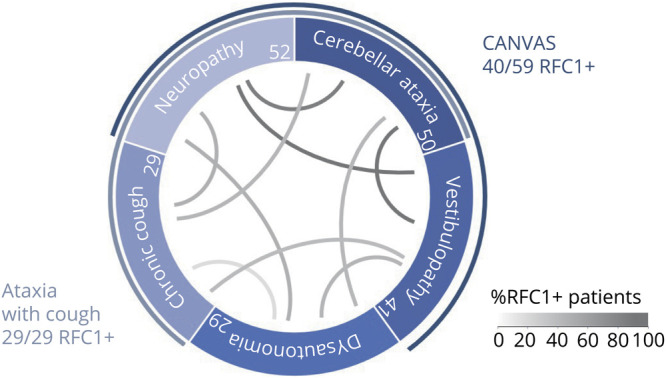
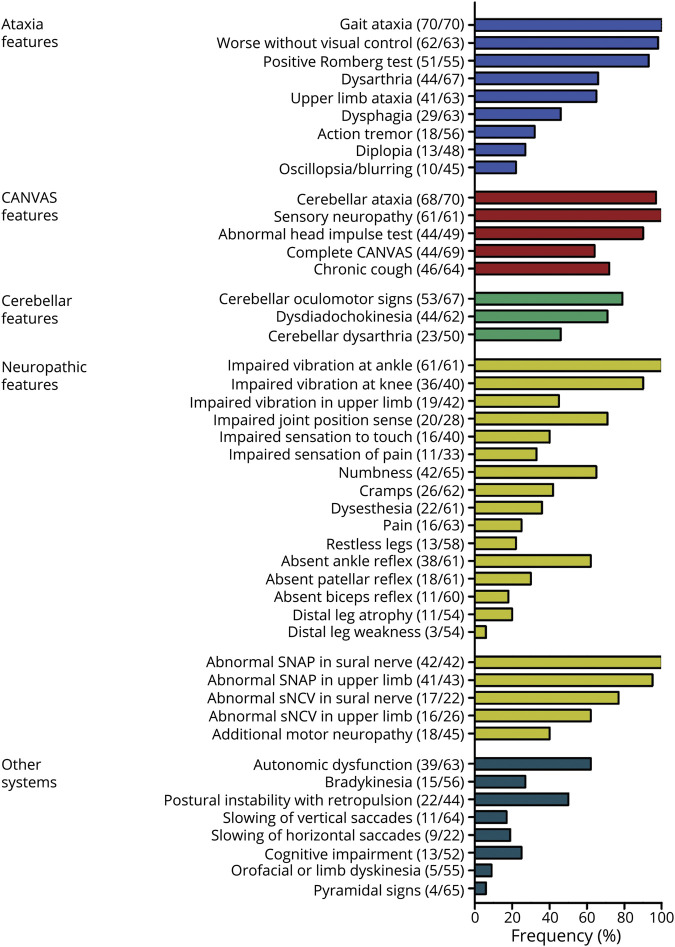
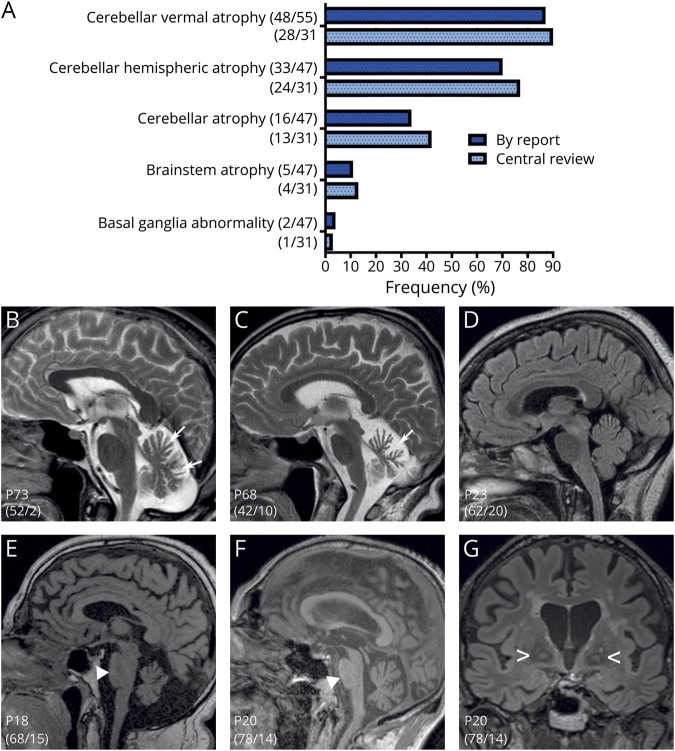
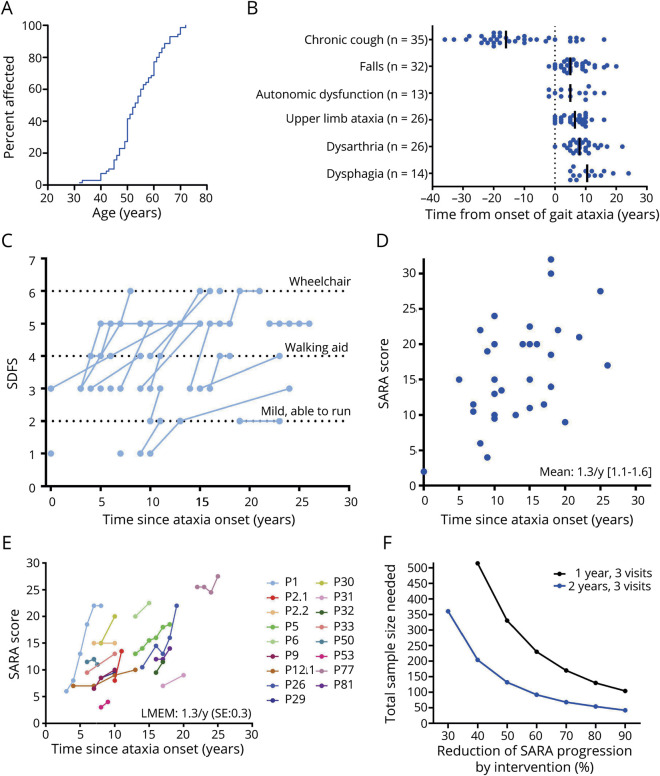
Results: Prevalence of RFC1 disease was 67% in cohort A, 14% in unselected cohort B, 68% in clinical CANVAS, and 100% in ACC. RFC1 disease was also identified in Western and Eastern Asian individuals and even by whole-exome sequencing. Visual compensation, sensory symptoms, and cough were strong positive discriminative predictors (>90%) against RFC1-negative patients. The phenotype across 70 RFC1-positive patients was mostly multisystemic (69%), including dysautonomia (62%) and bradykinesia (28%) (overlap with cerebellar-type multiple system atrophy [MSA-C]), postural instability (49%), slow vertical saccades (17%), and chorea or dystonia (11%). Ataxia progression was ≈1.3 Scale for the Assessment and Rating of Ataxia points per year (32 cross-sectional, 17 longitudinal assessments, follow-up ≤9 years [mean 3.1 years]) but also included early falls, variable nonlinear phases of MSA-C-like progression (SARA points 2.5-5.5 per year), and premature death. Treatment trials require 330 (1-year trial) and 132 (2-year trial) patients in total to detect 50% reduced progression.

Conclusions: RFC1 disease is frequent and occurs across continents, with CANVAS and ACC as highly diagnostic phenotypes yet as variable, overlapping clusters along a continuous multisystemic disease spectrum, including MSA-C-overlap. Our natural history data help to inform future RFC1 treatment trials.

Classification of evidence: This study provides Class II evidence that RFC1 repeat expansions are associated with CANVAS and ACC.


Figures

Figure 1
Figure 1. Identification of RFC1 Repeat Expansions
(A) Flanking PCR, products run on a 1% agarose gel. Lanes 2 to 5: controls, including reference sequence (AAAAG)11 in lane 2. Lanes 6 to 11: positive samples with absent product amplification indicating biallelic pathogenic AAGGG expansions. Lanes 12 to 16: negative samples with product amplification consistent with reference sequence or a nonpathogenic expansion. (B) Repeat-primed PCR targeting the pathogenic (AAGGG)exp, nonpathogenic (AAAAG)exp, and (AAAGG)exp expansions; visualization of separated fluorescein amidite–labeled PCR products. Ladder markers are 35, 50, 75, 100, 139, 150, 160, 200, 250, 300, 340, 350, 400, 450, 490, and 500 nucleotides. Representative plots from a P13.1 carrying the biallelic AAGGG repeat expansion and P55 carrying nonpathogenic (AAAGG)exp/(AAAAG)exp expansions in compound heterozygous state. (C) Southern blotting of genomic DNA from 13 patients and unaffected relatives. Patients carrying biallelic pathogenic expansions in RFC1 (bold) show 2 discrete or 1 overlapping band. In RFC1-negative cases, either one 5-kb band corresponding to the expected size for reference allele (AAAAG)11 or bands of increased size can be observed.
Figure 2
Figure 2. RFC1 Screening by Next-Generation Sequencing
Integrative genomics viewer visualization of exome (P2.1, P10) and genome (P9) sequencing reads aligned to the repeat locus and flanking regions showing the presence of a mutated AAGGG repeat motif. Sequence reads from both directions are interrupted and do not span the entire length of the repeat expansion. The repeated AAGGG motif does not map to the (AAAAG)11 reference sequence, and reads showing the sequence alteration are soft-clipped. The lower panel shows sequence reads from a control genome dataset. RFC1 = replication factor complex subunit 1.
Figure 3
Figure 3. Continuous Spectrum of Variable Feature Combinations in RFC1 Disease
Prevalence of key features of replication factor complex subunit 1 (RFC1) disease and their within-participant combinations in 52 RFC1-positive patients (all from cohort A). Absolute number of patients with individual feature shown in circle sections. Lines represent relative co-occurrence of 2 features among RFC1-positive patients with reported presence or absence of both features. Within this combinatorial spectrum, the combination of ataxia with chronic cough and the triad of cerebellar ataxia, neuropathy, and vestibulopathy areflexia syndrome (CANVAS) represent just 2 instances of variable clusters along a continuous overlapping spectrum of RFC1 disease yet with a relatively increased associative strength.
Figure 4
Figure 4. Phenotypic Spectrum of RFC1 Disease
Prevalence of signs, symptoms, and electrodiagnostic findings of 70 patients with biallelic RFC1 repeat expansions. Numerator and denominator in brackets indicate the number of affected patients and the number of patients assessed for this feature, respectively. CANVAS = cerebellar ataxia, neuropathy, and vestibular areflexia syndrome; RFC1 = replication factor complex subunit 1.
Figure 5
Figure 5. MRI Features of RFC1 Disease
(A) MRI findings by report and by centralized review of digital images by 2 independent raters. Numerator and denominator in brackets indicate the number of patients with a feature and the number of patients assessed for this feature, respectively. (B–D) Mild to moderate cerebellar atrophy of the vermis with variable extent and temporal evolution, for example, marked cerebellar atrophy at 42 years of age in P68 vs absence of atrophy in P23 at 62 years of age after 20 years of ataxia. (E and F) Representative images of mild pontine atrophy after >14 years’ disease duration. (G) Patient with pallidal T2 signal abnormalities. Numerator and denominator in brackets on images indicate age and ataxia duration at MRI. RFC1 = replication factor complex subunit 1.
Figure 6
Figure 6. Feature Evolution and Disease Progression
(A) Onset of ataxia in replication factor complex subunit 1 disease is relatively late (compared to other recessive ataxias), with 50% of patients affected by 54 years of age. (B) Temporal evolution of ataxia and nonataxia features relative to onset of gait ataxia (dotted line). (C) Cross-sectional and longitudinal functional disease progression as indicated by the Spinocerebellar Degeneration Functional Score (SDFS; n = 33). (D) Cross-sectional progression of ataxia indicated by the individual Scale for the Assessment and Rating of Ataxia (SARA) score at the last assessment relative to ataxia duration (n = 32). (E) Prospective longitudinal progression of ataxia (n = 17). Comparable ataxia severities (e.g., P32 vs P50, or P9 vs P31) and phases of accelerated progression (e.g., P1, P26) occur after interindividually variable durations of ataxia. (F) Sample size estimations for the detection of reduced SARA score progression in parallel-group (1:1) interventional trials with 3 visits in observation periods of either 1-year (0, 6, and 12 months) or 2-year (0, 12, and 24 months) duration. LMEM = linear mixed effect model; SE = standard error.

References

    1. Cortese A, Simone R, Sullivan R, et al. . Biallelic expansion of an intronic repeat in RFC1 is a common cause of late-onset ataxia. Nat Genet 2019;51:649–658. - PMC - PubMed
    1. Rafehi H, Szmulewicz DJ, Bennett MF, et al. . Bioinformatics-based identification of expanded repeats: a non-reference intronic pentamer expansion in RFC1 causes CANVAS. Am J Hum Genet 2019;105:151–165. - PMC - PubMed
    1. Szmulewicz DJ, Roberts L, McLean CA, MacDougall HG, Halmagyi GM, Storey E. Proposed diagnostic criteria for cerebellar ataxia with neuropathy and vestibular areflexia syndrome (CANVAS). Neurol Clin Pract 2016;6:61–68. - PMC - PubMed
    1. Szmulewicz DJ, McLean CA, MacDougall HG, Roberts L, Storey E, Halmagyi GM. CANVAS an update: clinical presentation, investigation and management. J Vestib Res 2014;24:465–474. - PubMed
    1. Cortese A, Tozza S, Yau WY, et al. . Cerebellar ataxia, neuropathy, vestibular areflexia syndrome due to RFC1 repeat expansion. Brain 2020;143:480–490. - PMC - PubMed

Publication types

MeSH terms