. 2021 Jan 25;12(1):582.
doi: 10.1038/s41467-020-20828-3.

Structural insights into the disruption of TNF-TNFR1 signalling by small molecules stabilising a distorted TNF

Affiliations

Structural insights into the disruption of TNF-TNFR1 signalling by small molecules stabilising a distorted TNF

David McMillan et al. Nat Commun. .

Abstract

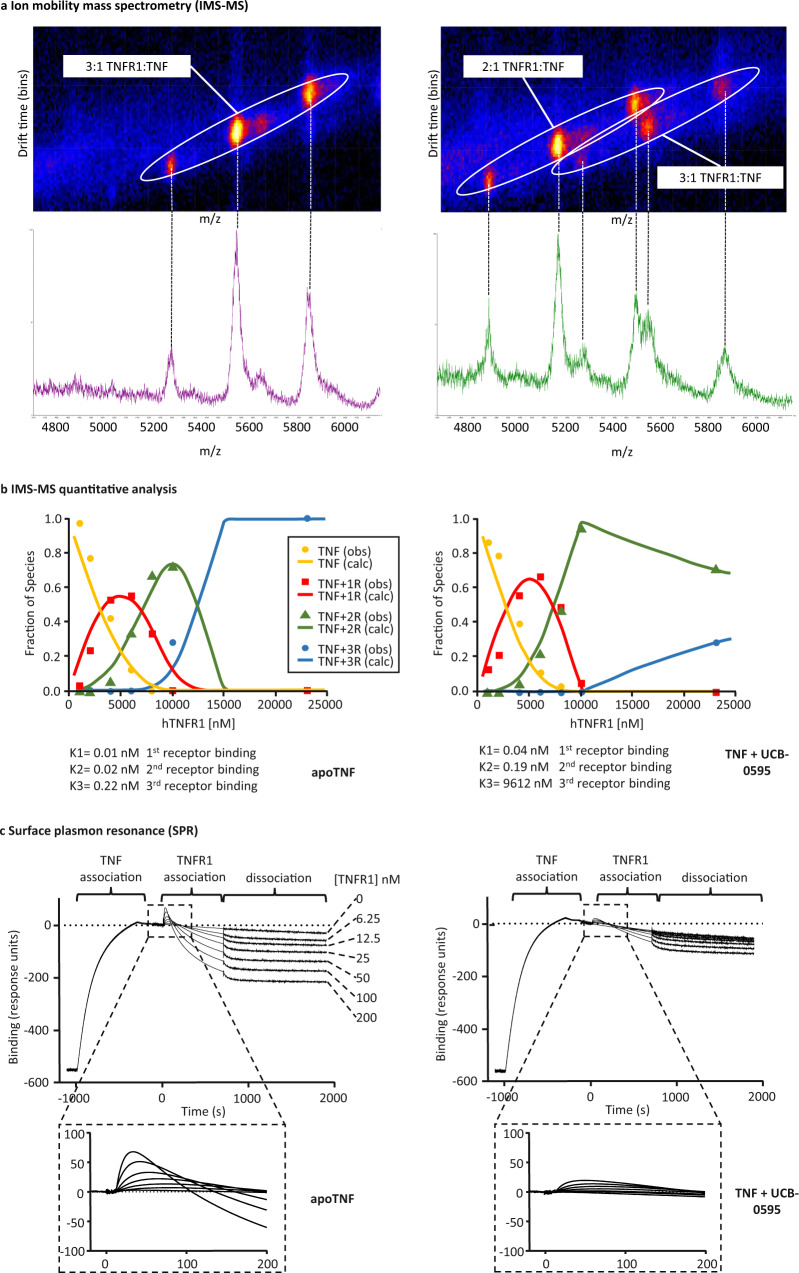
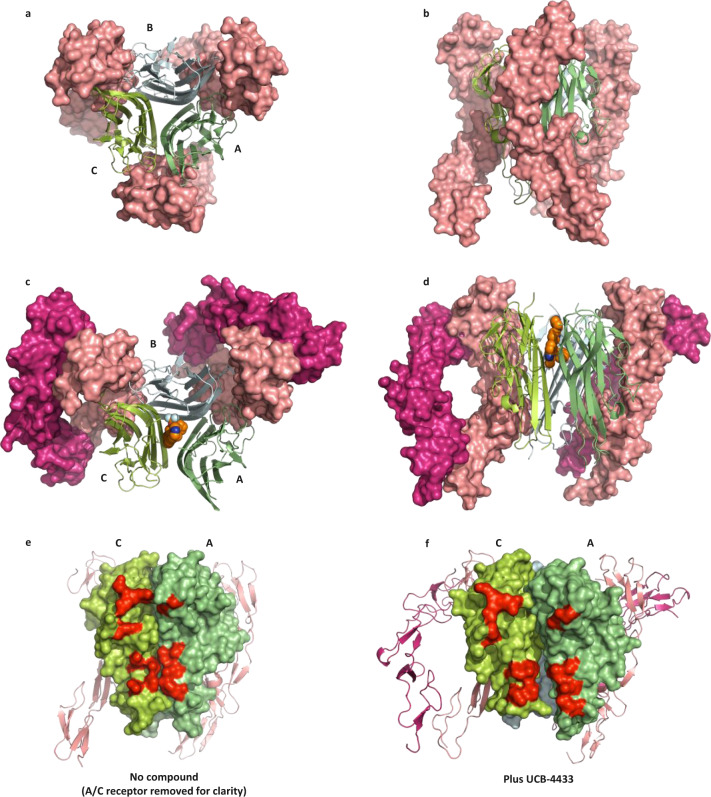
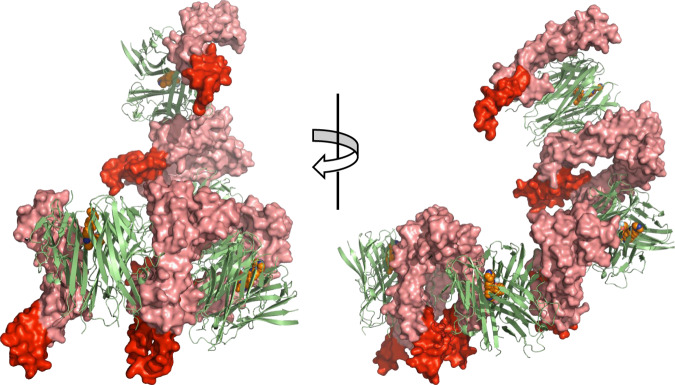
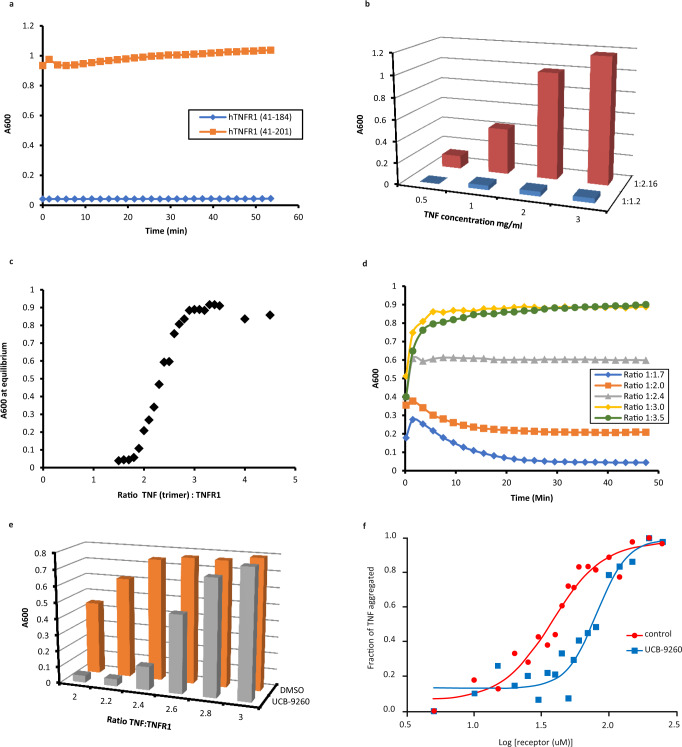
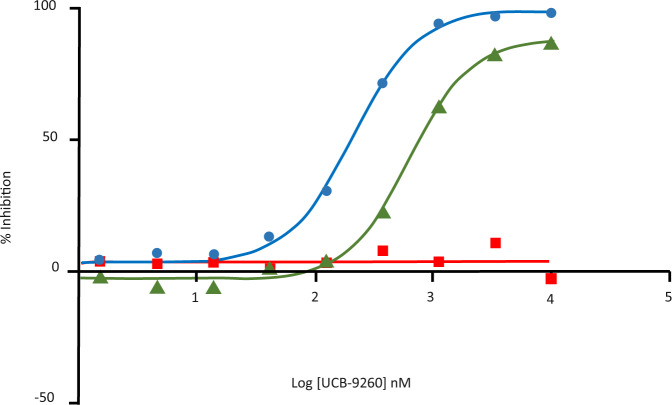
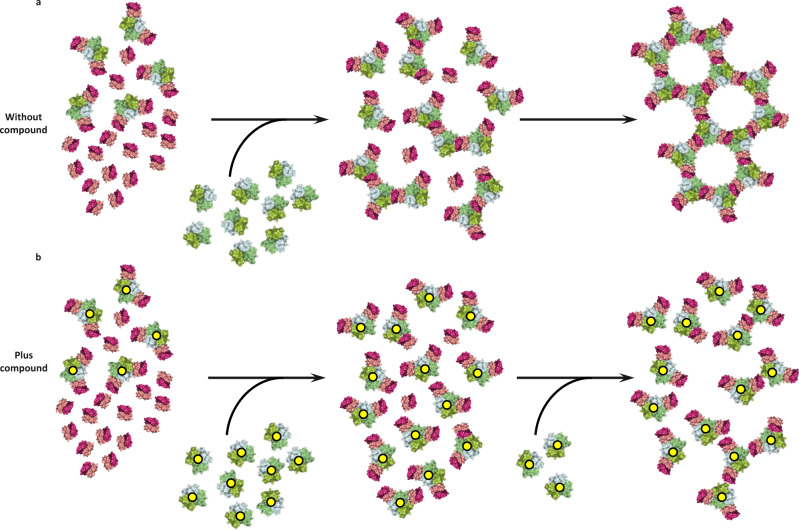
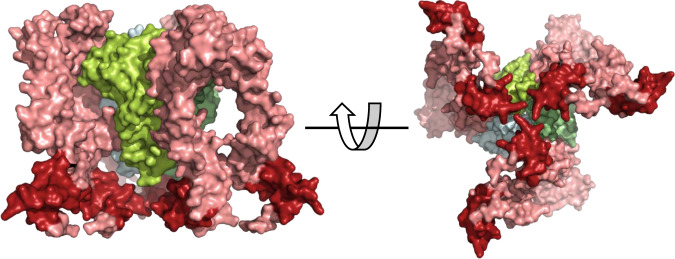
Tumour necrosis factor (TNF) is a trimeric protein which signals through two membrane receptors, TNFR1 and TNFR2. Previously, we identified small molecules that inhibit human TNF by stabilising a distorted trimer and reduce the number of receptors bound to TNF from three to two. Here we present a biochemical and structural characterisation of the small molecule-stabilised TNF-TNFR1 complex, providing insights into how a distorted TNF trimer can alter signalling function. We demonstrate that the inhibitors reduce the binding affinity of TNF to the third TNFR1 molecule. In support of this, we show by X-ray crystallography that the inhibitor-bound, distorted, TNF trimer forms a complex with a dimer of TNFR1 molecules. This observation, along with data from a solution-based network assembly assay, leads us to suggest a model for TNF signalling based on TNF-TNFR1 clusters, which are disrupted by small molecule inhibitors.


Conflict of interest statement

D.Mc., C.M., J.P., D.F., R.G., P.M., T.C., B.C., A.L., T.B. and J.O’C are/were all employees of UCB Pharma and may hold stock and/or stock options.

Figures

Fig. 1
Fig. 1. Effect of compounds on TNF–TNFR1 interaction.
a IMS-MS of hTNF with 5-fold excess hTNFR1 (left panel), hTNF plus UCB-0595 (10-fold excess) and 5-fold excess hTNFR1 (right panel). Circled signals and corresponding peaks show three ionisation states for each receptor-bound form. b Quantitative analysis of IMS-MS data generated using hTNF and hTNF plus UCB-0595 (10-fold excess) (left and right panels, respectively) over a range of hTNFR1 concentrations (x axis). Traces (calc—calculated) indicating the percentage of each species; 0 receptor, 1 receptor, 2 receptor and 3 receptor-bound are shown (yellow, red, green and blue traces, respectively). Symbols (obs—observed) represent experimentally measured molar fractions of the different species in equilibrium (n = 1 independent experiments, a similar reduction in affinity of the third receptor binding was observed for multiple compounds—Supplementary Table 1). Source data are provided as a Source Data file. c SPR of hTNF (left panel) and hTNF plus UCB-0595 (10-fold excess) (right panel) binding to immobilised hTNFR1 (first injection) followed by injection of hTNFR1 at a range of concentrations. Detail of the TNFR1 binding response (third receptor binding) is highlighted (dashed box) (n = 1 independent experiments).
Fig. 2
Fig. 2. Comparison of mouse TNF-humanTNFR1 complex with and without compound.
Top view (a) and side view (b) of trimeric mTNF (green ribbons, monomers assigned A, B and C) with three copies of monomeric receptor-bound (pink surface rendered) (PDB: 7KP7 [https://www.rcsb.org/structure/unreleased/7KP7]). Top view (c) and side view (d) of trimeric mTNF (green ribbons) with UCB-4433 bound (orange space-fill) and two copies of dimeric hTNFR1 bound (pink and purple surface rendered) (PDB: 7KP8 [https://www.rcsb.org/structure/unreleased/7KP8]). e Side view of mTNF (green surface rendered) without compound—one copy of the hTNFR1 has been removed to reveal the non-distorted a–c receptor binding site (selected residues involved in hTNFR1 binding highlighted in red). f Side view of mTNF (green surface rendered) with UCB-4433 bound (not visible) revealing the distorted A–C receptor binding site (selected residues involved in receptor binding highlighted in red).
Fig. 3
Fig. 3. Extended TNF–TNFR1 chain.
Four copies of trimeric mTNF (green ribbons) linked by hTNFR1 dimers (pink surface rendered) as present in the crystal lattice (PDB: 7KP8 [https://www.rcsb.org/structure/unreleased/7KP8]). Membrane proximal ends of each receptor are highlighted in red.
Fig. 4
Fig. 4. In vitro TNF–TNFR1 network assembly.
a Aggregation of hTNF (3 mg/mL) +hTNFR1(41–201) (orange trace) and hTNF (3 mg/mL) +hTNFR1(41–184) (blue trace) over time (ratio of TNF:TNFR = 1:2.16). b Aggregation of hTNF +hTNFR1(41–201) over a range of concentrations and at two ratios of hTNF:hTNFR1 (1:1.2 blue bars and 1:2.16 red bars). c Aggregation state of hTNF (2 mg/mL) +hTNFR1 at equilibrium over a range of ratios. d Aggregation of hTNF (2 mg/mL) +hTNFR1 at five ratios (1:1.7 blue trace, 1:2 orange trace, 1:2.4 grey trace, 1:3 yellow trace, 1:3.5 green trace) over time. e Aggregation of hTNF (2 mg/mL) + hTNFR1 over a range of ratios with UCB-9260 (10-fold excess over hTNF trimer) (grey bars) and DMSO only (orange bars) (n = 1 independent experiments). f Aggregation of hTNF +hTNFR1 at a fixed ratio of TNF:TNFR = 1:3.2 over a range of total protein concentrations with UCB-9260 (5-fold excess over TNF) (blue trace) (n = 1 independent experiments, a similar rightward shift in the point of aggregation was observed for multiple compounds—Supplementary Fig. 3) and DMSO control (red trace) (n = 2 independent experiments). Source data are provided as a Source Data file.
Fig. 5
Fig. 5. Inhibition of TNF signalling in cells.
Representative concentration–response curves showing the effect of UCB-9260 on signalling in an NFκβ reporter cell assay driven by 10 pM hTNF (blue trace), 100pM hTNF (green trace) and anti-TNFR1 antibody at 300 ng/mL (red trace). Source data are provided as a Source Data file.
Fig. 6
Fig. 6. Model of TNF–TNFR1 signalling network.
a Schematic representation of TNFR1 dimers (pink and purple) pre-clustered, with a portion bound to TNF (green) (two copies of TNFR1 dimer bound per TNF trimer). Addition of more TNF (green) results in linking of the TNF-two-receptor-bound units into larger TNF-three-receptor-bound clusters finally assembling into a large network. b Same scenario as a in the presence of compound (yellow dots), resulting in incomplete network assembly.
Fig. 7
Fig. 7. Model of TNF with long-form TNFR1 (41–201) dimers bound.
Side and bottom view of surface rendered trimeric TNF (green) with three copies of long-form TNFR1 (41–201) dimers bound (pink). The fourth cysteine-rich domain of each receptor is highlighted in red.

References

    1. Bodmer J, Pascal S, Tschopp J. The molecular architecture of the TNF superfamily. Trends Biochem. Sci. 2015;27:19–26. doi: 10.1016/S0968-0004(01)01995-8. - DOI - PubMed
    1. Brenner D, Heiko B, Mak TW. Regulation of tumor necrosis factor signalling: live or let die. Nat. Rev. Immunol. 2015;15:362–374. doi: 10.1038/nri3834. - DOI - PubMed
    1. Engelmann H, et al. Antibodies to a soluble form of a tumor necrosis factor (TNF) receptor have TNF-like activity. J. Biol. Chem. 1990;265:14497–14504. doi: 10.1016/S0021-9258(18)77330-4. - DOI - PubMed
    1. Grell M, Scheurich P, Meager A, Pfizenmaier K. TR60 and TR80 tumor necrosis factor (TNF)-receptors can independently mediate cytosis. Lymphokine Cytokine Res. 1993;12:143–148. - PubMed
    1. Wajant H. Principals of antibody-mediated TNF receptor activation. Cell Death Differ. 2015;22:1727–1741. doi: 10.1038/cdd.2015.109. - DOI - PMC - PubMed

MeSH terms

Substances