. 2021 Jan 25;12(1):122.
doi: 10.1038/s41419-021-03408-1.

SCA-1 micro-heterogeneity in the fate decision of dystrophic fibro/adipogenic progenitors

Affiliations

SCA-1 micro-heterogeneity in the fate decision of dystrophic fibro/adipogenic progenitors

Giulio Giuliani et al. Cell Death Dis. .

Abstract

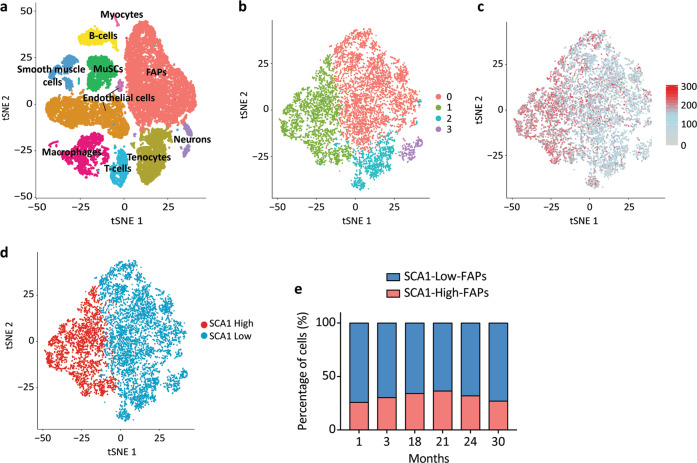
The term micro-heterogeneity refers to non-genetic cell to cell variability observed in a bell-shaped distribution of the expression of a trait within a population. The contribution of micro-heterogeneity to physiology and pathology remains largely uncharacterised. To address such an issue, we investigated the impact of heterogeneity in skeletal muscle fibro/adipogenic progenitors (FAPs) isolated from an animal model of Duchenne muscular dystrophy (DMD), the mdx mouse. FAPs play an essential role in muscle homoeostasis. However, in pathological conditions or ageing, they are the source of intramuscular infiltrations of fibrotic or adipose tissue. By applying a multiplex flow cytometry assay, we characterised and purified from mdx muscles two FAP cell states expressing different levels of SCA-1. The two cell states are morphologically identical and repopulate each other after several growth cycles. However, they differ in their in vitro behaviour. Cells expressing higher levels of SCA-1 (SCA1-High-FAPs) differentiate more readily into adipocytes while, when exposed to a fibrogenic stimulation, increase the expression of Col1a1 and Timp1 mRNA. A transcriptomic analysis confirmed the adipogenic propensity of SCA1-High-FAPs. In addition, SCA1-High-FAPs proliferate more extensively ex vivo and display more proliferating cells in dystrophic muscles in comparison to SCA1-Low-FAPs. Adipogenesis of both FAP cell states is inhibited in vitro by leucocytes from young dystrophic mice, while leucocytes isolated from aged dystrophic mice are less effective in limiting the adipogenesis of SCA1-High-FAPs suggesting a differential regulatory effect of the microenvironment on micro-heterogeneity. Our data suggest that FAP micro-heterogeneity is modulated in pathological conditions and that this heterogeneity in turn may impact on the behaviour of interstitial mesenchymal cells in genetic diseases.


Conflict of interest statement

The authors declare that they have no conflict of interest

Figures

Fig. 1
Fig. 1. Micro-heterogeneity of SCA-1 in fibro/adipogenic progenitors.
a Schematic representation of the workflow applied to study FAP heterogeneity. Cells are taken from Servier Medical Art (SMART), under Creative Commons Attribution 3.0 Unported License. b Representative viSNE maps of total mononuclear cells isolated from young wild type and mdx mice. The four clusters produce by FlowSOM algorithm were mapped onto the viSNE maps and correspond to the following mononuclear cell populations: FAPs (blue), endothelial cells (orange), leucocytes (green) and muscle satellite cells (MuSCs, red). c Representative Self-Organising Maps (SOMs) of FAPs identified in (a). SOMs were obtained with the FlowSOM algorithm. Each node represents a cluster of cells, nodes with similar expression profile are linked by an edge. Colour of nodes indicate SCA-1 expression level. Node outlines indicate the four metaclusters (red, blue, black and green) obtained by the algorithm. Red and blue shadings highlight FAPs expressing high levels (red and blue metaclusters, called SCA1-High-FAPs) and low levels (black and green metaclusters, called SCA1-Low-FAPs) of SCA-1. d Stacked bar plot showing the fraction of SCA1-High-FAPs and SCA1-Low-FAPs in wild type and mdx mice. Data are presented as mean ± SEM. Statistical significance was estimated by a One-way ANOVA, *p ≤ 0.05, **p ≤ 0.01 (n = 4). e Representative SCA-1 histograms of FAPs from wild type and mdx mice identified in (b) and their standard deviations (SD) showing a typical micro-heterogeneity profile. f Sorting strategy to decompose SCA-1 micro-heterogeneity and to isolate SCA1-High-FAPs and SCA1-Low-FAPs from mdx mice. Complete strategy, Fluorescence minus one (FMO) controls and cell states purity in Supplementary Fig. 3.
Fig. 2
Fig. 2. SCA1-High-FAPs and SCA1-Low-FAPs from mdx mouse are two cell states.
a SCA-1 histogram of the whole FAP compartment (left), freshly isolated cell states (middle) and cell states expanded 9 days in Cytogrow (right). FAP compartment was analysed as followed: CD45 CD31 cells isolated by MACS were stained with antibodies against Integrin alpha-7 and SCA-1; next a gating strategy (Supplementary Fig. 4b; unstained cells in Supplementary Fig. 4a) was applied to obtain Integrin alpha-7 SCA-1+ cells. Cell states were isolated as described and then analysed by flow cytometry (gating strategy in Supplementary Fig. 4d, e for SCA1-High-FAPs and SCA1-Low-FAPs respectively; controls in Supplementary Fig. 4c) (n = 3). b Schematic representation of the in vivo experiment. Freshly isolated FAP cell states were stained and injected into TAs of mdx mice. After 3 days SCA-1 expression of stained cells was studied by flow cytometry. c Upper panel: dot plots showing stained FAP cell states three days after the injection. Lower panel: SCA-1 distributions of FAP cell states in three different condition: freshly isolated, after 3 days in vitro and after 3 days in vivo (n = 3). d Representative crop of micrographs of SCA1-High-FAPs (left) and SCA1-Low-FAPs (right) cultured ex vivo. Cytoplasms were stained with CFSE (yellow) and nuclei were counterstained with Hoechst 33342 (blue). Scale bar 50 μm. eg Box plots representing CFSE positive area, aspect ratio (AR) and roundness of SCA1-High-FAPs (n = 96) and SCA1-Low-FAPs (n = 94) from three different biological replicates. Whiskers are minimum and maximum values of the distribution. Statistical significance was estimated by a two tailed Mann–Whitney test after a normality test.
Fig. 3
Fig. 3. SCA1-High-FAPs differentiate more efficiently into adipocytes than SCA1-Low-FAPs.
a Experimental design to induce adipogenic differentiation of mdx FAP cell states. GM = growth medium; AIM = adipogenic induction medium; MM = maintenance medium. b and c Bar plots showing the percentage of ORO positive cells and PPAR-gamma positive cells per field. AM = adipogenic medium (AM = AIM + MM). Statistical analysis was performed by a Two-way ANOVA (n = 4). d Representative micrographs of (b) and (c). Cells were immunolabelled for PPAR-gamma (yellow) and nuclei were counterstained with Hoechst 33342 (blue). Lipid droplets were stained with ORO (red). e Experimental design applied to obtain fully differentiated adipocytes. f Bar plot indicating the percentage of ORO positive cells (n = 3). Statistical significance was calculated through Student’s t test. g Representative micrographs of (f). Lipid droplets in red (ORO staining) and nuclei in blue (Hoechst 33342). h Representative viSNE maps showing the expression of SCA-1 and phospho-CREB-1 assessed by mass cytometry in FAPs isolated from mdx mouse by MACS and cultured 72 h either in GM or AIM (n = 3). i Cluster 1 (in blue) and cluster 2 (in orange) obtained applying the FlowSOM algorithm and then mapped onto viSNE maps. j Plot representing the expression in arbitrary units of SCA-1 and phospho-CREB-1 identified in (i). Data are presented as mean ± SEM. **p ≤ 0.01, ***p ≤ 0.001. Scale bars 100 μm.
Fig. 4
Fig. 4. Fibrogenic differentiation of mdx FAP cell states.
a Experimental design to induce fibrogenic differentiation of mdx FAP cell states. GM = growth medium; FM = fibrogenic medium. b Bar plot presenting alpha-SMA-positive area per cell in each field (n = 6). Statistical significance was evaluated using Two-way ANOVA. c Representative microphotographs of (b). Immunofluorescence against alpha-SMA (yellow) and nuclei counterstaining (blue, Hoechst 33342). Scale bar 100 μm. df Bar plots showing Col3a1, Col1a1 (n = 3) and Timp1 (n = 4) mRNA expression. Following 5 days of differentiation samples were analysed by Real-Time PCR. Statistical significance was estimated through a Two-way ANOVA. g, h Bar plots showing Col3a1 and Col1a1 mRNA expression immediately after sorting (n = 3). Samples were analysed by Real-Time PCR using 2-ΔΔCt comparative method. Tubulin mRNA was set as reference gene. Statistical significance was evaluated by Student’s t test. Data are presented as mean ± SEM. *p ≤ 0.05, **p ≤ 0.01, ***p ≤ 0.001.
Fig. 5
Fig. 5. SCA1-High-FAPs have a transcriptional profile committed to the adipogenic differentiation.
a Multidimensional scaling (MDS) plot of FAP cell states transcriptome. b Volcano plot of log10(adjust p-value) versus log2(fold change) showing upregulated (in green) and downregulated (in purple) genes in SCA1-Low-FAPs. c Heatmap of the Difference of the different biological replicates (n = 4). d Profile plots of the Difference of the downregulated (upper panel, purple cluster in Fig. 5c) and upregulated genes (lower panel, orange cluster in Fig. 5c) in SCA1-Low-FAPs. The right panel shows the top 4 Biological processes GO terms significantly enriched (FDR < 0.05) for upregulated and downregulated genes in SCA1-Low-FAPs. e A network in which each node represents a gene transcriptionally regulated by PPAR-gamma (from TRRUST). Red edges: genes activated by PPAR-gamma; blue edges: genes repressed by PPAR-gamma; grey edges: unknown mechanism. The nodes are filled according to the Fold Change. f Bar plot showing the percentage of PPAR-gamma positive cells after 5 days in GM (n = 3). g Representative images of bar plot in the previous panel. PPAR-gamma in red and nuclei in blue. Scale bar 100 μm. Statistical analysis was performed with Student’s t test. Data are presented as mean ± SEM. *p ≤ 0.05.
Fig. 6
Fig. 6. SCA1-High-FAPs have a higher proliferation rate than SCA1-Low-FAPs.
a Schematic representation of the experimental plan to study mdx FAP cell states proliferation rate in vitro. Collected samples were immunolabelled for Ki-67 and nuclei were counterstained with Hoechst 33342 (n = 4). b Growth curve showing the number of nuclei per field. c Plot representing the percentage of Ki-67 positive nuclei per field. d Doubling time of FAP cell states calculated using the first three days of exponential growth. Student’s t test was applied to determine statistical significance. e Experimental plan applied to investigate cell states proliferation in vivo. EdU at the concentration of 40 mg/kg was injected into the peritoneum of mdx mice. After 24 h mice were sacrificed and EdU incorporation was studied by flow cytometry. f Bar plot showing the percentage of FAP cell states in proliferating FAPs (n = 5). g Gating strategy to evaluate EdU incorporation. For the unstained sample and FMO controls see Supplementary Fig. 7b, c. Data are presented as mean ± SEM. Statistical analysis was performed using Two-way ANOVA for the in vitro experiment and Student’s t test for the in vivo experiment. * p ≤ 0.05, ** p ≤ 0.01, **** p ≤ 0.0001.
Fig. 7
Fig. 7. FAP cell states from wild type mice differ in their transcriptional profile.
a viSNE map representing the different clusters identified as distinct cell populations according to the expression of specific biomarkers. Identified populations are: myocytes, B-cells, FAPs, smooth muscle cells, MuSCs, endothelial cells, macrophages, T-cells, tenocytes and neurons. b The FAPs population subset has been re-clustered, leading to 4 distinct clusters according to their gene expression profile. The four clusters (0, 1, 2,3) were mapped onto the viSNE map of FAPs. c The expression of SCA-1 antigen has been mapped to each cell of the dataset. d viSNE map of FAPs in which clusters 0, 2, 3 are collapsed together to obtain two clusters expressing high level (SCA-1 High) and low level (SCA-1 Low) of SCA-1. e Stacked bar plot showing the percentage of the two population on the basis of SCA-1 expression levels across different ages.
Fig. 8
Fig. 8. Immune system from old mdx mice releases adipogenic potential of SCA1-High-FAPs.
a Representative images of the experiment whose results are reported in the bar plot in (b). FAPs were identified by an antibody against CD140a (green) and nuclei were counterstained with Hoechst 33342 (blue). Scale bar 40 μm. b Bar plot representing the number of FAPs (CD140a+ cells) per mm2 in a section of TA from young and old mdx mice. Statistical analysis was carried out by Student’s t test (n = 3). c Representative immunofluorescence of TA section of young and old mdx mice showing PPAR-gamma positive FAPs. FAPs were immunolabelled with an antibody against CD140a (green) and nuclei were counterstained with Hoechst 33342 (blue). In red cells expressing PPAR-gamma. Scale bar 40 μm (n = 3). d Schematic representation of the experiment in (e) and (f). Leucocytes (CD45+ cells) were isolated through MACS from young and old mdx mice. After 24 h of ex vivo culture their conditioned media (CM) were harvested and used to induce adipogenesis of young FAP cell states from mdx mice in combination with AIM and MM. Cells and dish are taken from Servier Medical Art (SMART), under Creative Commons Attribution 3.0 Unported License. e Representative microphotographs of (d). Lipid droplets were stained with ORO (red) and nuclei with Hoechst 33342 (blue). f Bar plot showing the percentage of ORO positive cells (n = 3). Statistical significance was evaluated using Two-way ANOVA. Scale bar 100 μm. g Immunofluorescence against perilipin on TAs from young (left) and old (right) mdx mice. Representative images of reconstruction of the whole TA section. Perilipin is showed in green and nuclei in blue. Dashed lines highlight section borders. Scale bar 500 μm. Lower insets show images used to reconstruct the whole muscle. Scale bar 100 μm. Arrows indicate perilipin positive cells. h Bar plot presenting the percentage of Perilipin positive area in the whole TA section. Statistical significance was evaluated using Student’s t test. n = 3. i Bar plot showing the expression of Cebpb mRNA in the TA of young (n = 3) and old (n = 4) mdx mice assessed by Real-Time PCR using 2-ΔΔCt comparative method. Tubulin mRNA was set as reference gene. Statistical significance was evaluated with Student’s t test. Data are presented as mean ± SEM. *p ≤ 0.05, **p ≤ 0.01, ***p ≤ 0.001, ****p ≤ 0.0001.

References

    1. Bianconi E, et al. An estimation of the number of cells in the human body. Ann. Hum. Biol. 2013;40:463–471. doi: 10.3109/03014460.2013.807878. - DOI - PubMed
    1. Spitzer MH, Nolan GP. Mass cytometry: single cells, many features. Cell. 2016;165:780–791. doi: 10.1016/j.cell.2016.04.019. - DOI - PMC - PubMed
    1. Macosko EZ, et al. Highly parallel genome-wide expression profiling of individual cells using nanoliter droplets. Cell. 2015;161:1202–1214. doi: 10.1016/j.cell.2015.05.002. - DOI - PMC - PubMed
    1. Buettner F, et al. Computational analysis of cell-to-cell heterogeneity in single-cell RNA-sequencing data reveals hidden subpopulations of cells. Nat. Biotechnol. 2015;33:155–160. doi: 10.1038/nbt.3102. - DOI - PubMed
    1. Trapnell C. Defining cell types and states with single-cell genomics. Genome Res. 2015;25:1491–1498. doi: 10.1101/gr.190595.115. - DOI - PMC - PubMed

Publication types