. 2021 Jan 25;6(1):15.
doi: 10.1038/s41541-020-00277-1.

Recombinant MVA-prime elicits neutralizing antibody responses by inducing antigen-specific B cells in the germinal center

Affiliations

Recombinant MVA-prime elicits neutralizing antibody responses by inducing antigen-specific B cells in the germinal center

Leila Eslamizar et al. NPJ Vaccines. .

Abstract

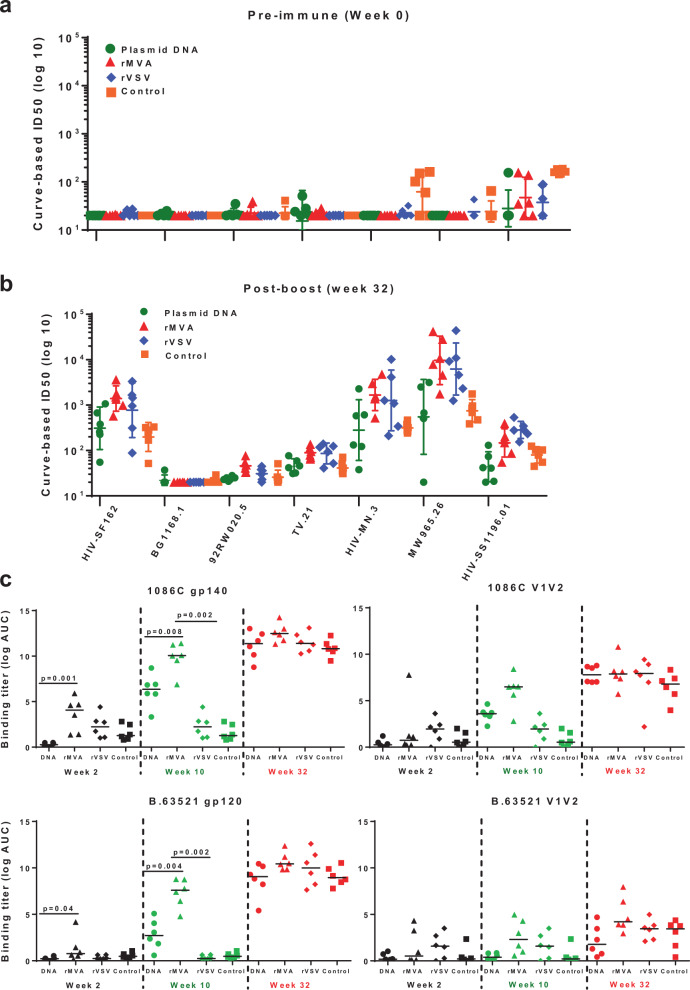
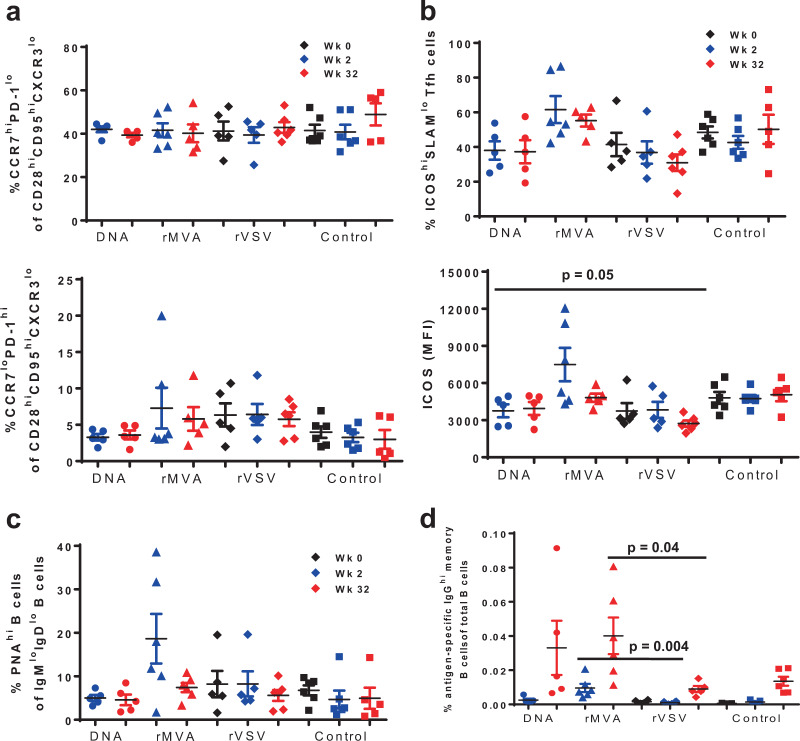
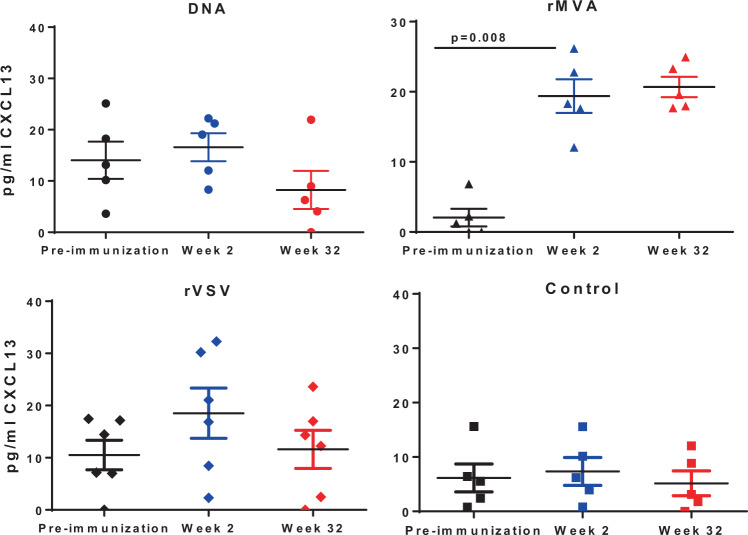
The RV144 HIV-1 vaccine trial has been the only clinical trial to date that has shown any degree of efficacy and associated with the presence of vaccine-elicited HIV-1 envelope-specific binding antibody and CD4+ T-cell responses. This trial also showed that a vector-prime protein boost combined vaccine strategy was better than when used alone. Here we have studied three different priming vectors-plasmid DNA, recombinant MVA, and recombinant VSV, all encoding clade C transmitted/founder Env 1086 C gp140, for priming three groups of six non-human primates each, followed by a protein boost with adjuvanted 1086 C gp120 protein. Our data showed that MVA-priming favors the development of higher antibody binding titers and neutralizing activity compared with other vectors. Analyses of the draining lymph nodes revealed that MVA-prime induced increased germinal center reactivity characterized by higher frequencies of germinal center (PNAhi) B cells, higher frequencies of antigen-specific B-cell responses as well as an increased frequency of the highly differentiated (ICOShiCD150lo) Tfh-cell subset.


Conflict of interest statement

The authors declare no competing interests.

Figures

Fig. 1
Fig. 1. Antibody responses elicited by different priming immunizations.
Neutralizing antibody responses as measured by TZM-bl cell-based assay at pre-immune, week 0 (a) and post-boost, week 32 (b) time points. TZM-bl cell-based neutralization assays were performed against both Tier 1 and Tier 2 viruses. Curve-based log ID50 values for pre-immunization and post-protein boost time points are shown for plasmid DNA (green circles), rMVA (red triangles), and rVSV (lavender diamonds), and protein only control (orange squares) groups. ID50 titers against seven different viruses, HIV-1 SF162, BG1168.1, 92RW020.5, TV.21, HIV-MN.3, MW965.26, and HIV-SS1196.01 are shown with geometric mean with 95% CI of the six monkeys per group. c Binding antibody titers elicited by different priming immunizations. ELISA binding titers (log AUC) of plasma against autologous (upper panels) and heterologous (lower panels) antigens from individual monkeys in four vaccine groups are shown at Week 2 (black symbols), Week 10 (green symbols), and post-boost (red symbols) time points. The lines indicate the median of the six monkeys per group.
Fig. 2
Fig. 2. Cytokine secretion profile of the PBMC of the vaccinated monkeys as measured by ICS assay.
Percentages of post-prime (upper panels) and post-protein boost (lower panels) cytokine-secreting CD4+ central/transitional memory T cells (TCM/TM) were quantified in all four groups of monkeys following stimulation with C.1086 Env peptide pool. Percentages of IFN-γ (black circles), IL-2 (blue squares), TNF-α (green triangles), both IFN-γ/IL-2 (red inverted triangles) secreting TCM/TM CD4+ T cells are shown for individual monkeys for each vaccine group with mean and SEM.
Fig. 3
Fig. 3. Distinct gene expression profile in post vaccination sorted antigen-specific TEM and TCM populations.
a Gene expression heat map identifying uniquely uregulated genes within TCM and TEM compartments for all 24 rhesus macaques (red indicates upregulation). b Gene expression profile between 1086.C ENV peptide stimulated and unstimulated cells describing up- and downregulated genes of CD4+ CD154+ populations. c, d The SVM-RFE (Support Vector Machine with Recursive Feature Elimination) transcriptional profiling is shown for TCM and TEM compartments based on expression of CD154 in c post prime and d post boost time points. Both TCM and TEM cells could be readily discriminated based on CD154 expression.
Fig. 4
Fig. 4. Increased expression of ICOS on Tfh CD4+ T cells is associated with induction of Env-specific B-cell responses after priming with rMVA.
In each panel, black symbols denote pre-immunization (Week 0), blue symbols post-prime (Week 2) and red symbols show post-boost measurements. Plasmid DNA group is represented by using circles, rMVA by triangles, rVSV by diamonds, and control group by squares. Bars depict SEM. a Both upper and lower panel show the percentages of Tfh CD4+ T cells based on the expression of CCR7 and PD-1 in lymph node-derived lymphocytes. b Upper panel shows the percentages of ICOShiSLAMlo Tfh CD4+ T cells for individual monkeys from each vaccine group at weeks 0, 2, and 32. Lower panel shows the expression of ICOS per Tfh CD4+ T cell—based on Mean Fluorescence Intensity (MFI). c Dot plots showing accumulated data of relative frequencies (%) of bulk germinal center memory B cells in lymph node (LN) tissues at the indicated time points as judged by PNA staining—memory B cells in LN tissues obtained at the indicated time points. d Immunogen-specific B cells responses were detected by using a specific Env probe in bulk memory B cells from LN tissues. The relative frequencies are shown as a percentage of total B cells. All LN samples were analyzed in one experiment. Non-parametric Mann–Whitney U test was used for the statistical analysis and mean and SEM are shown for each vaccine group.
Fig. 5
Fig. 5. rMVA prime monkeys have highest CXCL13 levels in their plasma.
Plasma samples from pre-immunization (black symbols), Week 2 (blue symbols), and Week 32 (red symbols) from all monkeys in four vaccine groups were assessed for CXCL13 levels by ELISA assay following manufacturer’s protocol (R&D Systems). Level of CXCL13 (pg/ml) was derived from the standard curve generated from the OD values at 570 nm. Mean and SEM are shown for each vaccine group.

References

    1. Pitisuttithum P, et al. Randomized, double-blind, placebo-controlled efficacy trial of a bivalent recombinant glycoprotein 120 HIV-1 vaccine among injection drug users in Bangkok, Thailand. J. Infect. Dis. 2006;194:1661–1671. doi: 10.1086/508748. - DOI - PubMed
    1. Buchbinder SP, et al. Efficacy assessment of a cell-mediated immunity HIV-1 vaccine (the Step Study): a double-blind, randomised, placebo-controlled, test-of-concept trial. Lancet (Lond., Engl.) 2008;372:1881–1893. doi: 10.1016/S0140-6736(08)61591-3. - DOI - PMC - PubMed
    1. Gray GE, et al. Safety and efficacy of the HVTN 503/Phambili study of a clade-B-based HIV-1 vaccine in South Africa: a double-blind, randomised, placebo-controlled test-of-concept phase 2b study. Lancet Infect. Dis. 2011;11:507–515. doi: 10.1016/S1473-3099(11)70098-6. - DOI - PMC - PubMed
    1. Hammer SM, et al. Efficacy trial of a DNA/rAd5 HIV-1 preventive vaccine. N. Engl. J. Med. 2013;369:2083–2092. doi: 10.1056/NEJMoa1310566. - DOI - PMC - PubMed
    1. Korber BT, Letvin NL, Haynes BF. T-cell vaccine strategies for human immunodeficiency virus, the virus with a thousand faces. J. Virol. 2009;83:8300–8314. doi: 10.1128/JVI.00114-09. - DOI - PMC - PubMed