. 2021 Jan 25;12(1):504.
doi: 10.1038/s41467-020-20774-0.

Caveolae-mediated Tie2 signaling contributes to CCM pathogenesis in a brain endothelial cell-specific Pdcd10-deficient mouse model

Affiliations

Caveolae-mediated Tie2 signaling contributes to CCM pathogenesis in a brain endothelial cell-specific Pdcd10-deficient mouse model

Huanjiao Jenny Zhou et al. Nat Commun. .

Erratum in

Abstract

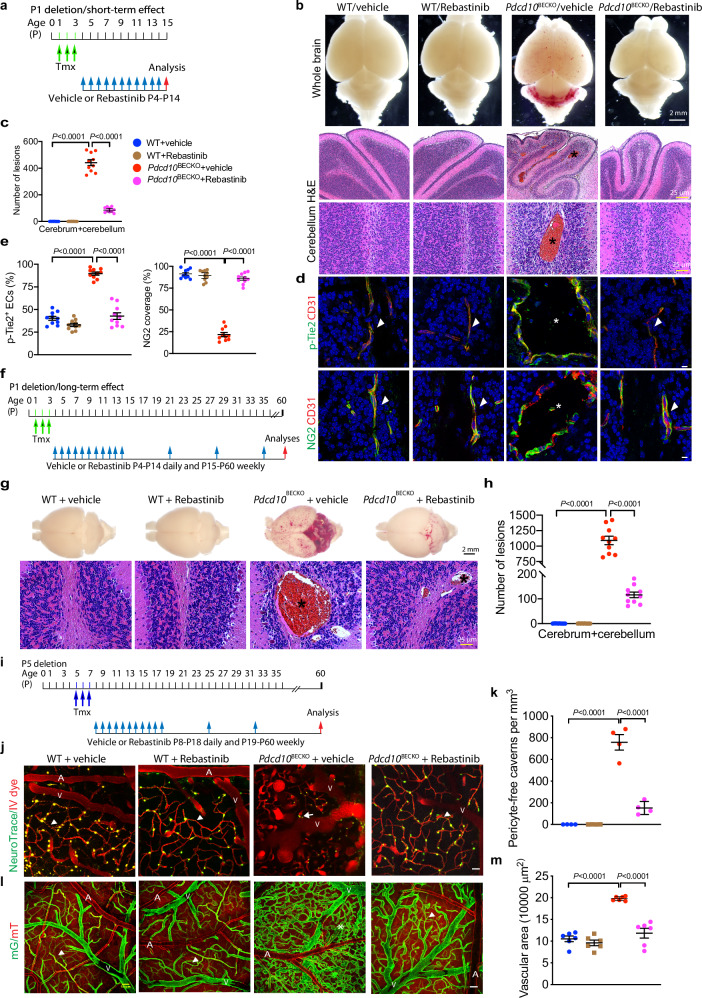
Cerebral cavernous malformations (CCMs) are vascular abnormalities that primarily occur in adulthood and cause cerebral hemorrhage, stroke, and seizures. CCMs are thought to be initiated by endothelial cell (EC) loss of any one of the three Ccm genes: CCM1 (KRIT1), CCM2 (OSM), or CCM3 (PDCD10). Here we report that mice with a brain EC-specific deletion of Pdcd10 (Pdcd10BECKO) survive up to 6-12 months and develop bona fide CCM lesions in all regions of brain, allowing us to visualize the vascular dynamics of CCM lesions using transcranial two-photon microscopy. This approach reveals that CCMs initiate from protrusion at the level of capillary and post-capillary venules with gradual dissociation of pericytes. Microvascular beds in lesions are hyper-permeable, and these disorganized structures present endomucin-positive ECs and α-smooth muscle actin-positive pericytes. Caveolae in the endothelium of Pdcd10BECKO lesions are drastically increased, enhancing Tie2 signaling in Ccm3-deficient ECs. Moreover, genetic deletion of caveolin-1 or pharmacological blockade of Tie2 signaling effectively normalizes microvascular structure and barrier function with attenuated EC-pericyte disassociation and CCM lesion formation in Pdcd10BECKO mice. Our study establishes a chronic CCM model and uncovers a mechanism by which CCM3 mutation-induced caveolae-Tie2 signaling contributes to CCM pathogenesis.


Conflict of interest statement

The authors declare no competing interests.

Figures

Fig. 1
Fig. 1. Pdcd10BECKO mice develop CCM lesions but survive to adulthood.
ac CCM lesion quantification in WT, Pdcd10BECKO, and Pdcd10ECKO mice at P10. Representative images of H&E staining and lesion quantifications in the cerebrum (arrows) and cerebellum (asterisks) are shown. The numbers of total lesions and lesions with different sizes were quantified as # of lesions per 10 coronal sections, which were 100 μm apart. n = 10 mice per group. d Cumulative survival curve for WT (Pdcd10fl/fl), Pdcd10BECKO (Mfsd2aCreERT2; Pdcd10fl/fl), and Pdcd10ECKO mice (Cdh5-CreERT2; Pdcd10fl/fl). N for each group is indicated. P < 0.0001 (Log-rank test). e Brain/body-weight ratios. Brain weight, body weight, and the brain/body-weight ratios are presented for WT and Pdcd10BECKO mice at 6–9 months old. n = 3 mice per group. fk CCM lesion characterization and quantification in WT and Pdcd10BECKO at 2–6 months. Representative images of fresh tissues, H&E staining (lesions indicated by asterisks), iron deposits (blue patches identified by Prussian blue), collagen deposition (red patches identified by Sirius Red), and EC proliferation (Ki67+) in the cerebrum (f, g) and cerebellum (h, i). Arrows indicate positive staining. The numbers of total lesions and lesions with different sizes were quantified as # of lesions per 10 coronal sections, which were 200 μm apart. n = 10 mice per group. Data are means ± SEM. P values are indicated, two-way ANOVA followed by Sidak’s multiple comparisons test (b, c, e, j, k). Scale bars: 25 μm (a); 100 μm (g, i); 1 mm (f, h). Source data are provided as a Source data file.
Fig. 2
Fig. 2. CCM lesions bulged from the capillary/post-capillary venules with blinding ends.
a Tamoxifen feeding protocols. WT (Pdcd10fl/fl) and Pdcd10BECKO (Mfsd2aCreERT2; Pdcd10fl/fl) pups were fed tamoxifen at different times to induce Ccm3 deletion at P1, P5, P10, and P21, respectively. Lesion phenotypes were analyzed at P60. b CCM lesions visualized by whole-brain imaging. c Live confocal microscopy of vascular malformations after injection of Evans blue dye (EBD in cyan color). Arrowheads and arrows indicate normal capillary and cavern, respectively. Asterisks indicate large lesions. A; artery/arterioles; V: vein/venules. dj Characterization of vascular structure and perfusion. CCM lesions and perfusion in 2-month-old WT (Mfsd2aCreERT2:mT/mG) and Pdcd10BECKO:mT/mG mice were visualized by confocal microscopy after injection with EBD. Blue: EBD; green: mG, primarily expressed in veins/venules/capillaries/arterioles; red: mT, all blood vessels. d Representative images of normal vessels in WT mice and mild to moderate lesions in Pdcd10BECKO mice are shown, with higher magnifications without EBD color at the lower panels. Arrowheads indicate normal capillaries/post-capillary venules in WT and Pdcd10BECKO mice, whereas arrows indicate non-perfused newly formed sprouts in Pdcd10BECKO mice. e The number of lesions (caverns-like structure/vascular area) are quantified. n = 4. f, g Total vascular area (mG) and EBD-perfused area are quantified. h Non-perfused (mG+/EBD) area is quantified. i Comparison of vein junctions in WT (arrowhead) and Pdcd10BECKO (arrow). Quantifications of vein diameters (j). n = 3. km Two-month-old WT and Pdcd10BECKO mice were perfused with a Texas Red intravenous (IV) dye and NeuroTrace (pericytes) followed by confocal microscopy. k Representative images of normal vessels in WT mice and mild to moderate lesions in Pdcd10BECKO mice are shown. l, m Pericyte-free caverns and pericyte density (number/vascular area) were quantified. n = 4. Arrowheads indicate normal pericyte processes in WT mice, whereas arrows indicate pericytes with shortened processes in Pdcd10BECKO mice. Asterisks indicate CCM lesions in Pdcd10BECKO mice. Data are means ± SEM. P values are indicated, one-way ANOVA followed by Sidak’s multiple comparisons test (e); one-way ANOVA followed by Tukey’s multiple comparisons test (f, g, h, j, l, m). Scale bar: 2 mm (b); 50 μm (c); 2 μm (d, k). Source data are provided as a Source data file.
Fig. 3
Fig. 3. Pericytes dissociated from microvessels with increased α-SMA expression during CCM lesion formation.
a, b P60 cerebrum sections from WT and the moderate CCM model of Pdcd10BECKO mice were stained for CD31 with NG2, VE-cadherin (VE-cad), or claudin-5 (Cldn5). Representative images of normal EC junction/EC-pericyte association (arrowheads) and disrupted EC junction/EC-pericyte association (arrows) within CCM lesions (asterisks) are shown (a). % of NG2, VE-cadherin, and claudin-5 coverage on CD31 vessels, i.e., % green (NG2, VE-cad, or Cldn5)-conjugated area/total red (CD31) areas was quantified by Image J (b), n = 10. P < 0.0001 (unpaired two-sided Student’s t-test). Data are presented as mean ± SEM. cf Pericyte phenotype characterization in early CCM lesions. c An early lesion model. Pdcd10BECKO pups were fed with tamoxifen at P1 to P3 and tissues were harvested at P15. d Brain sections from WT and Pdcd10BECKO mice were co-stained with CD31, α-SMA, and NG2. Images were captured under SP8 STED microscopy. Representative images for WT normal vessels and CCM lesions in Pdcd10BECKO mice are shown. n = 6. α-SMA was undetectable in EC or pericyte of WT vessels (arrowhead). α-SMA+ cells were co-localized with NG2+ pericyte but not with CD31+ EC within a lesion (arrows). e, f Retinas from WT and Pdcd10BECKO pups at P15 were whole-mount stained with CD31, α-SMA, and NG2. Images were captured under confocal microscopy. Representative low power (e) and high-power (f) images for WT and Pdcd10BECKO mice are shown. n = 6. α-SMA was expressed in artery and weakly in vein, but undetectable in WT microvessels (arrowhead). α-SMA was dramatically increased in CCM lesions of Pdcd10BECKO retina (asterisks). Scale bar: 25 μm (a); 8 μm (d); 100 μm (e); 5 μm (f). Source data are provided as a Source data file.
Fig. 4
Fig. 4. CCM lesions exhibit increased caveolae vesicles and Cav1-Tie2 signaling.
ai Caveolae and Cav1-Tie2 signaling characterization in the early lesion model. Pdcd10BECKO pups were fed with tamoxifen at P1 to P3 and tissues were harvested at P15. ad Caveolae characterization in CCM lesions by EM. Cerebral sections from WT and Pdcd10BECKO mice were subjected to EM. Representative images from 5 mice are shown. a Caveolae was indicated by asterisks while clathrin-coated pit by #. b Caveolae localization and forms. Luminal invagination, intracellular caveolae, and caveolae rosettes (clusters) are indicated. c Mean vesicular pit density at luminal and abluminal sides are quantified per 10 mm2. d Mean vesicular pit density at intracellular, junctional, and rosettes are quantified per 10 mm2. 20 EM section per mouse and n = 5. Data are means ± SEM. P values are indicated, unpaired two-sided Student’s t-test. eg Cav1-Tie2 signaling was upregulated in mouse CCM lesions. Cerebral sections from WT and Pdcd10BECKO mice were immunostained for Cav1 with CD31 (e), Tie2 (f), or p-Tie2 (g). Representative merged images of normal vessels (arrowheads) and CCM lesions (asterisks) are shown with individual color images of Pdcd10BECKO at the bottom. n = 6. h, i Tie2 was not localized in EC nucleus. Brain sections from WT and Pdcd10BECKO mice were co-stained with Tie2 and Cldn5 (h) or p-Tie2 and Cldn5 (i). Images were captured under SP8 STED microscopy. Representative images for WT normal vessels (arrowheads) and CCM lesions (asterisks) in Pdcd10BECKO mice are shown with individual color images of Pdcd10BECKO at the bottom. n = 6. j, k Cav1-Tie2 signaling was upregulated in human CCM lesions. Human CCM specimens were co-immunostained for CD31 and Cav1 with Tie2 (j) or p-Tie2 (k). Representative images of human CCM3 samples captured under SP8 STED microscopy are shown with high-power merged 4-color images on the right. n = 6. Arrowheads indicate normal vessels whereas asterisks indicate for lesions. Scale bar: 500 nm (a); 150 nm (b); 25 μm (e; left and middle panels in (j) and (k)); 8 μm (h, i; right panels in (j) and (k)). Source data are provided as a Source data file.
Fig. 5
Fig. 5. Cav1 silencing attenuates CCM3 loss-augmented Tie2 signaling and lumen enlargement in in vitro models.
HBMVECs were transfected with indicated siRNAs for 72 h. a Co-immunofluorescence staining with Tie2 and Cav1. Arrows and arrowheads indicate membrane and intracellular Tie2/Cav1, respectively. b, c Cav1 co-silencing attenuates Tie2 expression. Western blotting for Cav1-Tie2 signaling. Relative protein levels and p-Tie2/Tie2 ratios were quantified by taking Ctrl siRNA as 1.0. n = 3. d, e Biotinylation assay for cell surface and endocytic Tie2. Aliquot of input (1/5) was loaded as controls. Relative surface and endocytic Tie2 were quantified by taking Ctrl siRNA as 1.0. n = 3. f, g Tie2 stability was determined by cycloheximide (CHX) treatment followed by western blot with respective antibodies. The samples were derived from the same experiment and that gels/blots were processed in parallel. Relative protein levels were quantified by taking Ctrl siRNA as 1.0. n = 3. h Immunofluorescence staining with Tie2 and Lamp1. Arrows and arrowheads membrane-localized and lysosomal Tie2, respectively. High-power images of Tie2/Lamp1 co-localization are shown at bottom. i, j Adherens junctions (AJ) and tight junctions (TJ) were visualized by immunostaining, and percentages of disrupted (discontinuous) junctions are quantified in panel (j) (10 microscope fields in each group), n = 3. k Barrier function of ECs cultured on fibronectin-coated ECIS was assessed for transendothelial electric resistance (TEER; expressed as Ohms multiplied by cm2). n = 12 wells per group. l, m Organotypic angiogenesis assay in the absence or presence of Tie2 inhibitor Rebastinib (1 μM). EC sprouts and lumens were visualized by VE-cadherin and extracellular matrix collagen-IV staining. Arrows and arrowheads indicate normal lumen and dilated lumen, respectively. Number of branch points, mean lumen diameter, and lumen areas are quantified (m). All experiments were repeated at least three times. n = 10. Data are means ± SEM. P values are indicated, one-way ANOVA followed by Tukey’s multiple comparisons test (b, c, d, e, j, k, m); two-way ANOVA followed by Tukey’s multiple comparisons test (g). Scale bar: 20 μm (a, h, i); 100 μm (l). Source data are provided as a Source data file.
Fig. 6
Fig. 6. Cav1 deficiency reduces CCM lesions and normalizes PC-EC associations in Pdcd10BECKO mice.
Ccm3lox/lox (WT), Cav−/− (Cav1-KO), Pdcd10BECKO, and Pdcd10BECKO:Cav−/− (DKO) pups were fed with tamoxifen from P1 (ah) or P5 (il) to induce deletion of Ccm3, and cerebella were harvested at P15 and P60, respectively. a Images for fresh brain tissue. b, c H&E staining and lesion quantifications. Representative images are shown where lesions are indicated asterisks and n = 10. d, e Caveolae characterization by EM. Cerebral sections from each strain were subjected to EM. Representative images from 5 mice are shown. Luminal invagination and intracellular caveolae are indicated. e Mean vesicular pit density at luminal and abluminal sides are quantified per 10 mm2. 10 EM section per mouse and n = 5. fh Co-staining for Tie2/Cav1, p-Tie2/CD31, and NG2/CD31. Representative images of normal vessels (arrowheads) and CCM lesions (asterisks) are shown and n = 10. Quantification of p-Tie2-positive ECs and NG2 coverage on CD31 vessels, i.e., % green (p-Tie2 or NG2)-conjugated area/total red (CD31) areas by Image J (g, h). i CCM lesions at P60 were visualized by whole-brain imaging. j Characterization of CCM lesions and EC-pericyte interactions by confocal microscopy. Two-month-old mice were perfused with a Texas Red IV dye and NeuroTrace (pericytes) followed by confocal microscopy. j Representative images from each group are shown. Arrowheads indicate pericyte processes whereas arrows indicate pericytes with shortened processes in lesions (asterisks). k, l Pericyte density (number/area) and pericyte-free caverns were quantified. n = 4. Data are means ± SEM. P values are indicated, one-way ANOVA followed by Tukey’s multiple comparisons test (c, e, g, k, l). Scale bars: 2 mm (a, i); 100 μm (upper panel in (b)); 25 μm (lower panel in (b)); 150 nm (d); 16 μm (f); 50 μm (j). Source data are provided as a Source data file.
Fig. 7
Fig. 7. Tie2 inhibition rescued EC-pericyte associations with a therapeutic effect on CCM lesion progression.
ah Short-term effects of Rebastinib on CCM lesions. a A diagram for the protocol. Vehicle or Rebastinib was subcutaneously injected into WT and P1 deletion Pdcd10BECKO mice, and brain tissues were harvested at P15. b Images of fresh brain tissue and H&E staining of brain sections. c Lesion quantifications from the H&E staining. n = 10. d Cerebellum sections were stained for CD31 with p-Tie2 or NG2, respectively. Representative images of normal vessels (arrowheads) and CCM lesions (asterisks) are shown captured by SP8 STED microscopy. e Quantification of p-Tie2 and NG2 coverage on CD31 vessels, n = 10. fh Long-term effects of Rebastinib on CCM lesions. f A diagram for the protocol. Vehicle or Rebastinib was subcutaneously injected into WT and P1 deletion Pdcd10BECKO mice, and brain tissues were harvested at P60. g Images of fresh brain tissue and H&E staining of brain sections. i Lesion quantifications, n = 10. im Characterization of CCM lesions and EC-pericyte interactions by confocal microscopy. i A diagram for the protocol. Vehicle or Rebastinib was subcutaneously injected into WT and P5 deletion Pdcd10BECKO mice, and mice were analyzed at P60. j Two-month-old mice were perfused with a Texas Red IV dye and NeuroTrace (pericytes) followed by confocal microscopy. Representative images from each group are shown. Arrowheads indicate pericyte processes whereas arrows indicate pericytes dissociating from vessels. k Pericyte-free caverns were quantified. n = 4. l, m Characterization of CCM lesions and perfusion in WT (Mfsd2aCreERT2:mT/mG) and Pdcd10BECKO:mT/mG mice were visualized by confocal microscopy. l Representative images of normal or normalized microvessels (arrowheads) and CCM lesions (asterisks) are shown. Veins (V) and artery are indicated. m Vascular areas are quantified. n = 6. Data are means ± SEM. P values are indicated, one-way ANOVA followed by Tukey’s multiple comparisons test (c, e, h, k, m). Scale bars: 2 mm (upper panels in (b) and (g)); 25 μm (lower panels in (b) and (g)); 8 μm (d); 50 μm (j, l). Source data are provided as a Source data file.
Fig. 8
Fig. 8. Tie2 inhibition normalized EC barrier function in CCM mouse models.
a A diagram for the protocols. Vehicle or Rebastinib was subcutaneously injected into Ctrl or P1 deletion Pdcd10BECKO mice, and P15 mice were subjected to TMR-dextran perfusion (be) or transcytosis assays (f, g). be TMR-dextran perfusion was performed at P15 by retro-orbital injection. Local brain and retinal vascular leakages were indicated by accumulation of TMR-dextran dye outside the vasculatures. b Whole-brain tissue images (top) and frozen sections co-stained with CD31 (lower 3 panels). Representative images of normal or normalized microvessels (arrowheads) and leaky vessels (arrows) within or near CCM lesions (asterisks) are shown. c Quantifications of Permeability index (area of tracer/area of vessels). n = 5. d Whole-mount staining of retinas with CD31. Representative images of normal or normalized microvessels (arrowheads) and leaky vessels (arrows) within or near CCM lesions (asterisks) are shown. e Quantifications of Permeability index (area of tracer/area of vessels). n = 5. f, g Cerebral sections from WT and Pdcd10BECKO mice (P1 deletion/P15 harvest) were subjected to EM. f Representative EM images from 5 mice are shown. Tight junction (TJ) was indicated by bracket in WT and dashed bracket in Pdcd10BECKO. g TJ length was quantified per 10 mm2. 20 EM section per mouse and n = 5. h, i Brain EC transcytosis assay. P15 mice were subjected to HRP perfusion and DAB reaction assay followed by EM imaging of microvessels. Representative images of normal or normalized microvascular ECs (arrowheads) and leaky ECs with increased DAB bots (arrows) are shown. i Transcytosis events (DAB dots per 10 mm2) were quantified. n = 5. Data are means ± SEM. P values are indicated, one-way ANOVA followed by Tukey’s multiple comparisons test (c, e, g, i). Scale bars: 5 mm (top panel in (b)); 25 μm (2nd–4th panels in (b) and (d)); 500 nm (top panel in (h)); and 150 nm (f; bottom panel in (h)). Source data are provided as a Source data file.
Fig. 9
Fig. 9. Tie2 inhibition prevents progression of pre-existing lesions.
a A diagram for the protocol. WT and P1 deletion Pdcd10BECKO mice were subcutaneously administrated with vehicle or Rebastinib daily at P16–P29 and brain tissues were harvested at P30. P16 KO mice were harvested as lesion baselines. b Images of fresh brain tissue and H&E staining of brain sections. c The numbers of total lesions were quantified as # of lesions per 10 coronal sections, which were 200 μm apart. n = 6 mice per group. P values are indicated, one-way ANOVA followed by Sidak’s multiple comparisons test. Data are means ± SEM. Scale bars: 1 mm (b top panel); 100 μm (b middle panel); 25 μm (b bottom panel). Source data are provided as a Source data file.
Fig. 10
Fig. 10. A model for Caveolae-mediated Tie2 signaling in CCM progression.
CCM3 in brain ECs normally suppresses caveolae by yet unknown mechanism. CCM3 loss in ECs causes enhanced caveolae-mediated Tie2 surface expression and endocytosis, leading to EC junctional disruption, EC-pericyte dissociation, BBB dysfunction, and lumen enlargement. Non-receptor kinase Abl cooperatively regulates Tie2 expression and activity. Cav1 deficiency or Tie2 inhibition, like neutralization of Angpt2 ligand, ameliorates CCM lesion progression in the mouse CCM models, with normalization of EC-pericyte interaction and vascular integrity.

References

    1. Otten, P., Pizzolato, G. P., Rilliet, B. & Berney, J. 131 cases of cavernous angioma (cavernomas) of the CNS, discovered by retrospective analysis of 24,535 autopsies. Neurochirurgie35(82-83), 128–131 (1989). - PubMed
    1. Rigamonti, D. et al. Cerebral cavernous malformations. N. Engl. J. Med.319, 343–347 (1988). - PubMed
    1. Revencu, N. & Vikkula, M. Cerebral cavernous malformation: new molecular and clinical insights. J. Med. Genet.43, 716–721 (2006). - PMC - PubMed
    1. Sahoo, T. et al. Mutations in the gene encoding KRIT1, a Krev-1/rap1a binding protein, cause cerebral cavernous malformations (CCM1). Hum. Mol. Genet.8, 2325–2333 (1999). - PubMed
    1. Liquori, C. L. et al. Mutations in a gene encoding a novel protein containing a phosphotyrosine-binding domain cause type 2 cerebral cavernous malformations. Am. J. Hum. Genet.73, 1459–1464 (2003). - PMC - PubMed

Publication types

MeSH terms