. 2021 Jan 25;12(1):567.
doi: 10.1038/s41467-020-20765-1.

Conserved regulatory logic at accessible and inaccessible chromatin during the acute inflammatory response in mammals

Affiliations

Conserved regulatory logic at accessible and inaccessible chromatin during the acute inflammatory response in mammals

Azad Alizada et al. Nat Commun. .

Abstract

The regulatory elements controlling gene expression during acute inflammation are not fully elucidated. Here we report the identification of a set of NF-κB-bound elements and common chromatin landscapes underlying the acute inflammatory response across cell-types and mammalian species. Using primary vascular endothelial cells (human/mouse/bovine) treated with the pro-inflammatory cytokine, Tumor Necrosis Factor-α, we identify extensive (~30%) conserved orthologous binding of NF-κB to accessible, as well as nucleosome-occluded chromatin. Regions with the highest NF-κB occupancy pre-stimulation show dramatic increases in NF-κB binding and chromatin accessibility post-stimulation. These 'pre-bound' regions are typically conserved (~56%), contain multiple NF-κB motifs, are utilized by diverse cell types, and overlap rare non-coding mutations and common genetic variation associated with both inflammatory and cardiovascular phenotypes. Genetic ablation of conserved, 'pre-bound' NF-κB regions within the super-enhancer associated with the chemokine-encoding CCL2 gene and elsewhere supports the functional relevance of these elements.


Conflict of interest statement

The authors declare no competing interests.

Figures
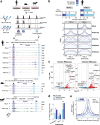
Fig. 1
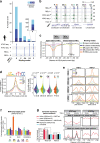
Fig. 1. Conserved RELA bound regions have strong enhancer features and are enriched near target genes.
a Workflow of the comparative genomic analyses performed with ChIP-seq and ATAC-seq in TNFα stimulated (45 min) primary aortic endothelial cells (ECs) isolated from human, mouse, and bovine aortas. The NUAK2 locus is used as a representative genomic region depicting 3-species conserved (dark blue) and human-specific (light blue) RELA peaks. b Stacked bar graphs (top) showing the number of 3-species conserved (dark blue), 2-species conserved (blue), and human-specific (light blue) RELA ChIP-seq and ATAC-seq peaks in human aortic ECs (HAECs), before and after TNFα stimulation. Profile plots (bottom) showing ChIP-seq and ATAC-seq signals in reads per million (RPM). The signals are centered on RELA peak summits in HAECs. The plot lines depict mean RPM ± SEM. c Volcano plots showing TNFα upregulated (red, log2FC > 0.6, FDR < 0.1) and downregulated (blue, log2FC < −0.6, FDR < 0.1) genes derived from intronic and exonic reads of total RNA-seq of HAECs (45-min TNFα vs. basal). Representative NF-κB target genes are labeled. FC fold change; FDR false discovery rate. d Percentages of conserved (combined 3-species and 2-species) and human-specific RELA peaks that reside within +/−10 kb of transcriptional start sites (TSS) of TNFα upregulated, TNFα downregulated, and constitutively expressed HAEC genes (p value: *<4.0 × 10−4, p value: **<1.0 × 10−18, two-sided Fisher’s exact test with Bonferroni correction for multiple testing). Source data and exact p values are provided in the Source Data file. e Profile plot showing ChRO-seq signals at distal RELA-bound regions (mean RPM × 10−2; >3 kb from the TSS). The signals are centered on RELA peak summits in HAECs, as indicated by color.
Fig. 2
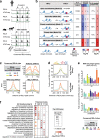
Fig. 2. Genomic regions prebound by RELA under basal conditions show the highest activity following TNFα stimulation.
a Stacked bar chart (top) indicating overlaps of RELA peaks with ATAC-seq peaks in unstimulated (−) and 45-min TNFα-stimulated (+) HAECs. Fractions representing 3-species conserved (dark blue), 2-species conserved (blue), and human-specific (light blue) RELA peaks are shown within each overlap. b Representative genomic regions (bottom) illustrating each mode of RELA binding. Mode O (open), RELA binding to accessible chromatin; Mode C (closed), to inaccessible chromatin; Mode OA (open after), to accessible chromatin after TNFα; Mode CA (closed after), to inaccessible chromatin after TNFα; and Mode P (prebound), binding prior to TNFα. Y-axis indicates reads per million (RPM). c TNFα-induced changes in nucleosome occupancy for each RELA binding mode from overlaps in a. Occupancy scores are indicated for basal (dashed line) and 45-min TNFα-stimulated (solid line) conditions. d Density plots (left) showing the fraction of RELA peaks harboring canonical RELA motif (JASPAR - MA0107.1) as a function of distance from RELA peak summit for each mode. Bean plots (right) comparing the number of canonical RELA motifs per peak (+/− 100 bp of RELA peak summits) between modes. p values were calculated using two-sided Mann–Whitney U test with Bonferroni correction. e Profile plots showing ChIP-seq (H3K27ac and RELA), ATAC-seq, and ChRO-seq (eRNA) signals (RPM). Signals are centered on RELA peak summits. Plot lines indicate mean RPM ± SEM. f Bar plots indicating fold enrichments of RELA binding modes within +/−10 kb of TSS of TNFα upregulated, downregulated, and constitutively expressed HAEC genes from RNA-seq analysis (p value: *<9.0 × 10−3 two-sided Fisher’s exact test with Bonferroni correction). g Bar charts showing fold enrichments for Mode OA peaks within chromatin marked with histone modifications as shown in Supplementary Fig. 2k (p value: *<2.5 × 10−04, Chi-squared test with Yates’s correction for continuity of independence, Bonferroni correction). Profile plots showing ATAC-seq and H3K27ac ChIP-seq signals centered on Mode C and OA subtypes classified in Supplementary Fig. 2k. Plot lines indicate mean RPM ± SEM. Source Data file is provided for Fig. 2f, g.
Fig. 3
Fig. 3. Conserved RELA-bound regions that also preserve their chromatin interaction mode across species show enhanced functional features.
a Schematic of conserved RELA peaks from a human genome perspective. Conserved RELA peaks with and without mode preservation are depicted. b Table indicating: (1) the number and the fold enrichment (FE) of conserved RELA peaks within each binding mode in HAECs (p value: *<7.0 × 10−5, Chi-squared test with Yates’s correction for continuity of independence and Bonferroni correction for multiple testing), (2) the percentage and fold enrichment of mode preservation at conserved RELA peaks (p value: *<4.0 × 10−3, two-sided exact binomial test with Bonferroni correction). c Profile plots showing ATAC-seq and ChIP-seq (H3K27ac and RELA) signals in reads per million (RPM) mapped reads centered on conserved RELA peaks in human aortic ECs (HAECs) that have their mode of binding preserved (solid) or not-preserved (dashed). The plot lines indicate mean RPM ± SEM. d Density plots showing the fraction of RELA peaks harboring the canonical RELA motif (JASPAR - MA0107.1) as a function of distance from the RELA peak summits for conserved/preserved (solid) and conserved/not-preserved (dashed) binding modes. e Bar plots indicating the fold enrichment of conserved/preserved (p) and conserved/not-preserved (n) RELA binding modes within +/−10 kb of transcriptional start sites (TSS) of TNFα upregulated, TNFα downregulated, and constitutively expressed HAEC genes from RNA-seq analysis (the p values were derived by comparing preserved and non-preserved peaks to the expected numbers using two-sided Fisher’s exact test with Bonferroni correction for multiple testing: *<0.04). f Dot plot showing GO term enrichments (biological process) for preserved modes (GREAT analysis). Gray circles indicate the GO terms that did not pass the GREAT cutoffs (minimum region-based fold enrichment: 2; minimum term annotation count: 1; FDR q value < 0.05; significant by both binomial and hypergeometric tests). The top five GO terms are ranked with binomial FDR q value (highlighted in gray). Source data are provided in the Source Data file for Fig. 3b, e.
Fig. 4
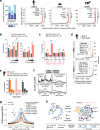
Fig. 4. Conserved NF-κB binding is shared between cell types near common immune response genes.
a Representative genomic regions showing the pan-cell (four-cell-type-shared: between human aortic ECs [HAECs], human umbilical vein ECs [HUVECs], lymphoblastoid cell lines [LCLs], and adipocytes), EC-specific (shared only between HAECs and HUVECs), LCL-specific, and adipocyte-specific RELA peaks. b Stacked bar charts showing the fractions of four-, three-, and two-cell-type-shared and HAEC-specific RELA peaks (one-cell type) that are three-species-conserved, two-species-conserved, or human-specific. c Table showing the top-scoring de novo motifs (MEME-ChIP e values, Supplementary Dataset 4), fold enrichments of RELA binding modes (p value: *<1.0 × 10−6, Chi-squared test with Yates’s correction for continuity of independence and Bonferroni correction for multiple testing), fold enrichments near TNFα target genes (HAEC RNA-seq, ±10 kb of transcriptional start sites, p value: * <1.0 × 10−5, two-sided Fisher’s exact test with Bonferroni correction), and the top GO terms (GREAT FDR q values, Biological Process Ontology, Supplementary Dataset 3) for the pan-cell (four-cell-type-shared), EC-specific, and HAEC-specific RELA peaks. ↑ = upregulated, ↓ = downregulated, NC no change (i.e., constitutively expressed). d Profile plots comparing ERG binding signal at pan-cell, EC-specific, and HAEC-specific RELA peaks in HAECs. ERG ChIP-seq signal was generated using published raw data from ref. . The plot lines indicate mean RPM ± SEM. Arrows and percentages indicate change in signal after TNFα stimulation. The p values were calculated using two-sided Welch Two Sample t-test (p value: *<0.05). e, Model of NF-κB-ERG dynamics and cofactor squelching showing redistribution of cofactors from EC-specific Mode O regions to pan-cell Mode P regions. Source data are provided in the Source Data file for Fig. 4c, d.
Fig. 5
Fig. 5. RELA signal strength and clustering in super-enhancers associates with conservation, pan-tissue activity, and pro-inflammatory functions.
a Stacked bars (left) showing fraction of RELA super-enhancers (SEs) that are conserved in TNFα-stimulated human, mouse, and bovine aortic ECs (HAEC, MAEC, BAEC) and plots (right) showing RELA SEs called by ROSE (red dots). b Fold enrichments of conserved (left) and cell-type-shared (right) RELA peaks within SEs (pink) and non-SEs (gray) in TNFα-stimulated HAECs (p value: *<2.0 × 10−35, Chi-squared test with Yates’s correction for continuity of independence, Bonferroni correction). c Fold enrichments of RELA binding modes within SEs (pink) and non-SEs (gray) (p value: *<1.0 × 10−03, Chi-squared test with Yates’s correction for continuity of independence, Bonferroni correction). Average percentage of RELA mode per SE is given. d HAEC RELA peaks ranked by normalized signal before and after TNFα stimulation. Mode P peaks are in orange. e Bar plots indicating fold enrichments of Mode P regions and the ranking of RELA peaks before (958 peaks) and after TNFα stimulation (4412 peaks) near TNFα target genes (+/−10 kb of TSS, HAEC RNA-seq; p value: *<1.0 × 10−8, two-sided Fisher’s exact test with Bonferroni correction). Up, upregulated; down, downregulated and NC, no change (i.e., constitutively expressed) f Glucocorticoid receptor (GR) occupancy signal at Mode P and the top-ranked RELA peaks compared to average signals at all RELA peaks in HeLa cells. GR ChIP-seq signal was from published raw data. Plot depicts mean RPM ± SEM. TA, triamcinolone acetonide. g Profile plot showing ChRO-seq signals (mean RPM) centered on the three-species conserved RELA peaks (n = 5027), and an equivalent number of top-ranked RELA peaks, the peaks with highest DNA constraint (average GERP score), and CTCF peaks. Average ChRO-seq signal for all RELA peaks is shown as a baseline reference. (p value: *<2.2 × 10−16, two-sided Mann–Whitney U test with Bonferroni correction). h Model of how NF-κB modes could function within the context of a super-enhancer taking into account co-activator squelching and phase transition dynamics. Connections between components represent potential physical interactions. Source data are provided in the Source Data file for Fig. 5b, c, e.
Fig. 6
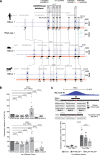
Fig. 6. CRISPR/Cas9-mediated genomic deletions of CCL2 super-enhancer components reveal principal roles of conserved RELA prebound regions in gene expression.
a Evolution of the individual RELA super-enhancer (SE) components at the CCL2 locus. The orthologous sequences in human, mouse, and cow ECs are connected with black vertical lines and highlighted in gray. RNA-seq tracks in human aortic ECs (HAEC) are shown. The SE regions are shown with pink bars, RELA peaks are indicated with black bars and modes of binding are indicated with their corresponding letters. The genomic regions deleted with CRISPR/Cas9 in telomerase-immortalized aortic ECs (TeloHAECs) are shown with horizontal lines at the top. The human phenotype-associated common genome-wide association study (GWAS) variants (green bars) and disease-linked human gene mutation database (HGMD) variants (red bars) are shown at the top. b Bar charts showing CCL2 expression (RT-qPCR, ΔΔCT) before and after TNFα induction (3 h, 10 ng/mL) in TeloHAEC clones that are homozygous for the RELA binding region deletions shown in a. The data are plotted relative to wild-type (WT/WT) TeloHAEC clones. Each data point shape (circle, square, rhombus) represents data from each of the three tested deletion clones (p values were derived using a two-sided ratio t-test). Error bars represent SEM. c Schematic (top) depicting the replacement of three conserved NF-κB motifs within the conserved RELA peak #6 of the CCL2 SE with a donor sequence harboring the scrambled motifs using CRISPR/Cas9-mediated homologous recombination (HR). Bar charts (bottom) comparing CCL2 expression (RT-qPCR, ΔΔCT) between wild-type TeloHAECs (WT/WT, dark gray), heterozygous (WT/RELA6mut, gray) and homozygous (RELA6mut/RELA6mut, light gray) TeloHAEC clones that harbor the scrambled motifs. Each data point shape (circle, square, rhombus) represents data from each of the three tested deletion clones. The data are plotted relative to the unstimulated wild-type (WT/WT 0 h) TeloHAECs (p values were derived using one-way ANOVA with Bonferroni correction). Error bars represent SEM. Source data are provided in the Source Data file for Fig. 6b, c.
Fig. 7
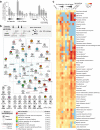
Fig. 7. Noncoding disease mutations associate with conserved and prebound regions in pathways and diseases related to inflammation.
a Bar charts showing fold enrichment of RELA peaks harboring noncoding disease variants (Human Gene Mutation Database [HMGD]) within different types of RELA peaks (+/−10 kb of transcriptional start sites (TSS). 2# = 2-cell-type-shared non-EC-specific RELA peaks, 2E = EC-specific RELA peaks, SE = super-enhancer. p value: *<9.0 × 10−3, Chi-squared test with Yates’s correction for continuity of independence, Bonferroni correction for multiple testing. Source data are provided in the Source Data file. b Network showing physical and pathway interactions (GeneMANIA) of genes that are linked to the noncoding disease mutations (HMGD) residing within the three-species conserved RELA peaks. The top-scoring nonredundant GO terms are shown (colors). c Enrichment of genome-wide association study (GWAS) variants for conserved, cell-type specific and top-ranked RELA peak classes. Results were filtered such that only phenotypes with significant results (adjusted p < 0.01, fold change ≥ 2) in at least one RELA dataset were included in the final matrix, which was visualized as a heatmap of enrichment (log2-fold change between observed and expected intersection counts is shown). Note that for certain identical or highly related phenotypes, we only show the results from the study reporting the highest number of single nucleotide polymorphisms (SNPs) (see “Methods” and Supplementary Dataset 8 for the complete list and data). This heatmap matrix was hierarchically clustered on the phenotype axis using average distance and the Canberra metric.

References

    1. Medzhitov R. Origin and physiological roles of inflammation. Nature. 2008;454:428–435. doi: 10.1038/nature07201. - DOI - PubMed
    1. Zhang Q, Lenardo MJ, Baltimore D. 30 Years of NF-kappaB: a blossoming of relevance to human pathobiology. Cell. 2017;168:37–57. doi: 10.1016/j.cell.2016.12.012. - DOI - PMC - PubMed
    1. Liu T, Zhang L, Joo D, Sun SC. NF-kappaB signaling in inflammation. Signal Transduct. Target. Ther. 2017;2:17023. doi: 10.1038/sigtrans.2017.23. - DOI - PMC - PubMed
    1. Adamson A, et al. Signal transduction controls heterogeneous NF-kappaB dynamics and target gene expression through cytokine-specific refractory states. Nat. Commun. 2016;7:12057. doi: 10.1038/ncomms12057. - DOI - PMC - PubMed
    1. Oeckinghaus A, Hayden MS, Ghosh S. Crosstalk in NF-kappaB signaling pathways. Nat. Immunol. 2011;12:695–708. doi: 10.1038/ni.2065. - DOI - PubMed

Publication types

MeSH terms