. 2021 Jan 25;11(1):2157.
doi: 10.1038/s41598-021-81075-0.

Bloom syndrome DNA helicase deficiency is associated with oxidative stress and mitochondrial network changes

Affiliations

Bloom syndrome DNA helicase deficiency is associated with oxidative stress and mitochondrial network changes

Veena Subramanian et al. Sci Rep. .

Abstract

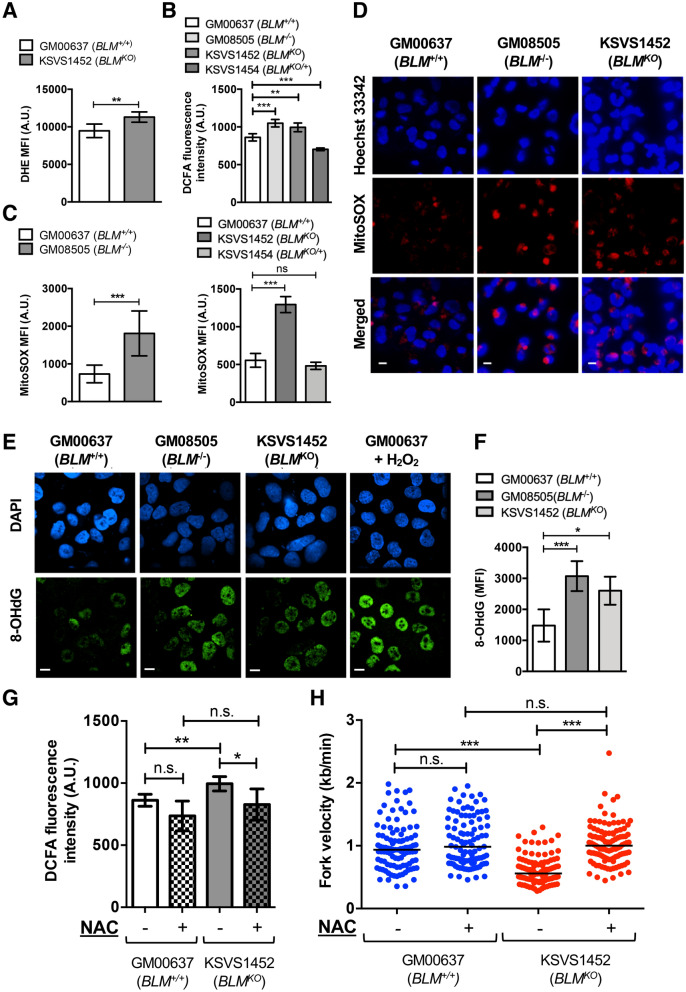
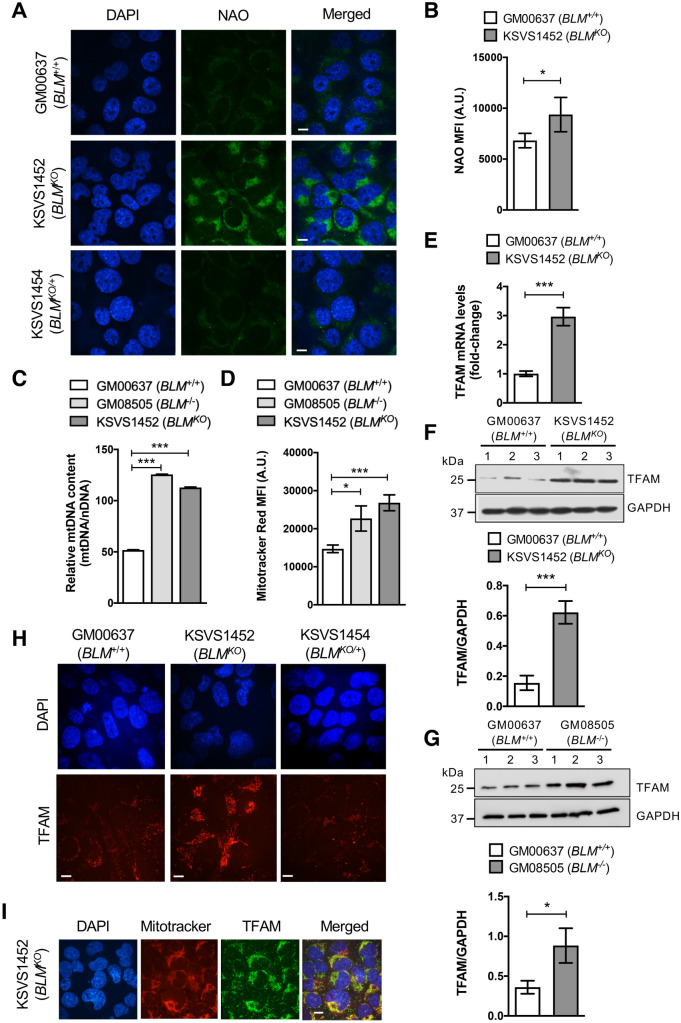
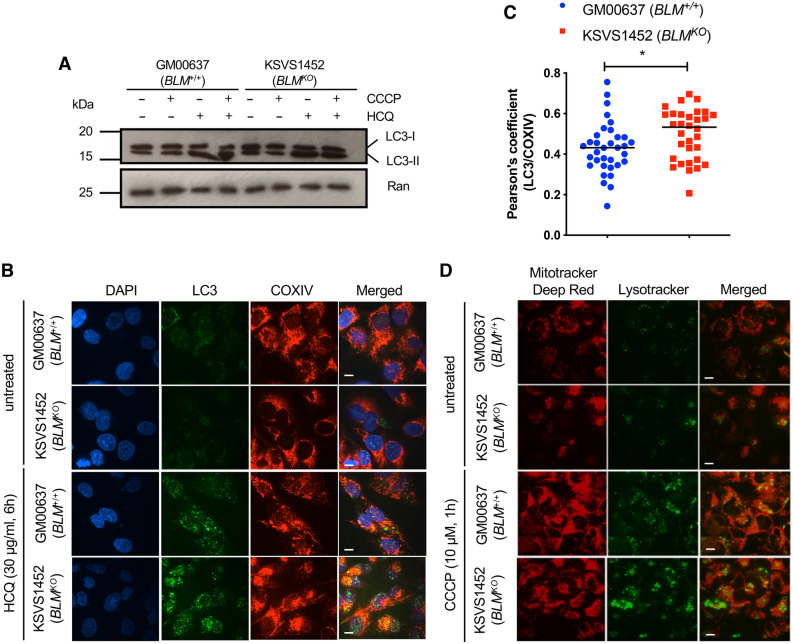
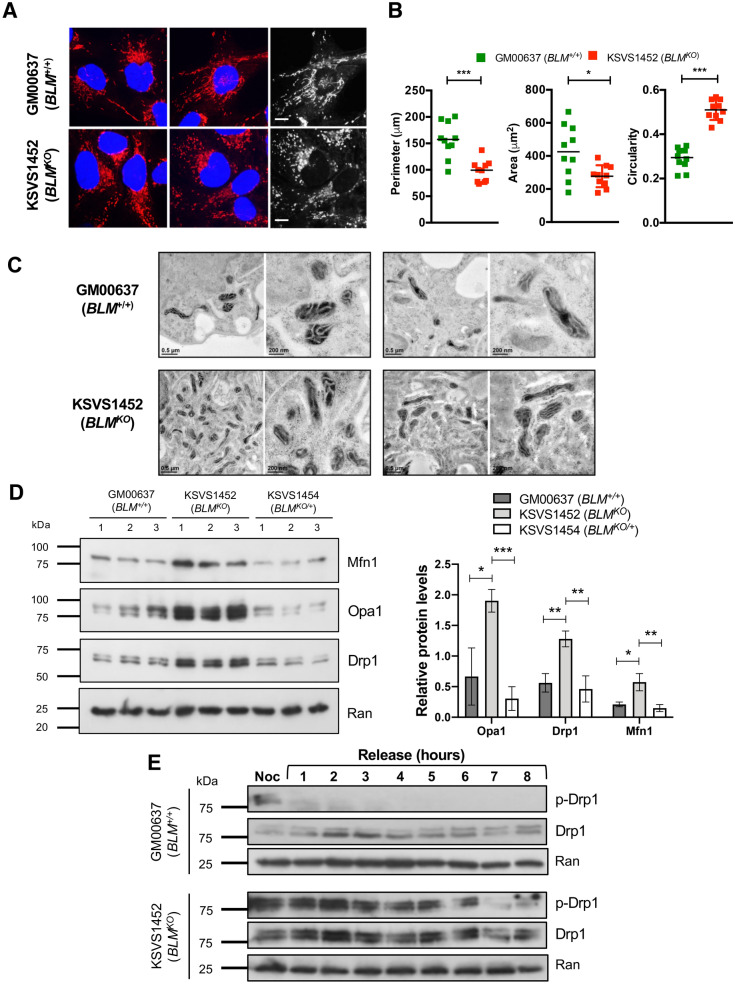
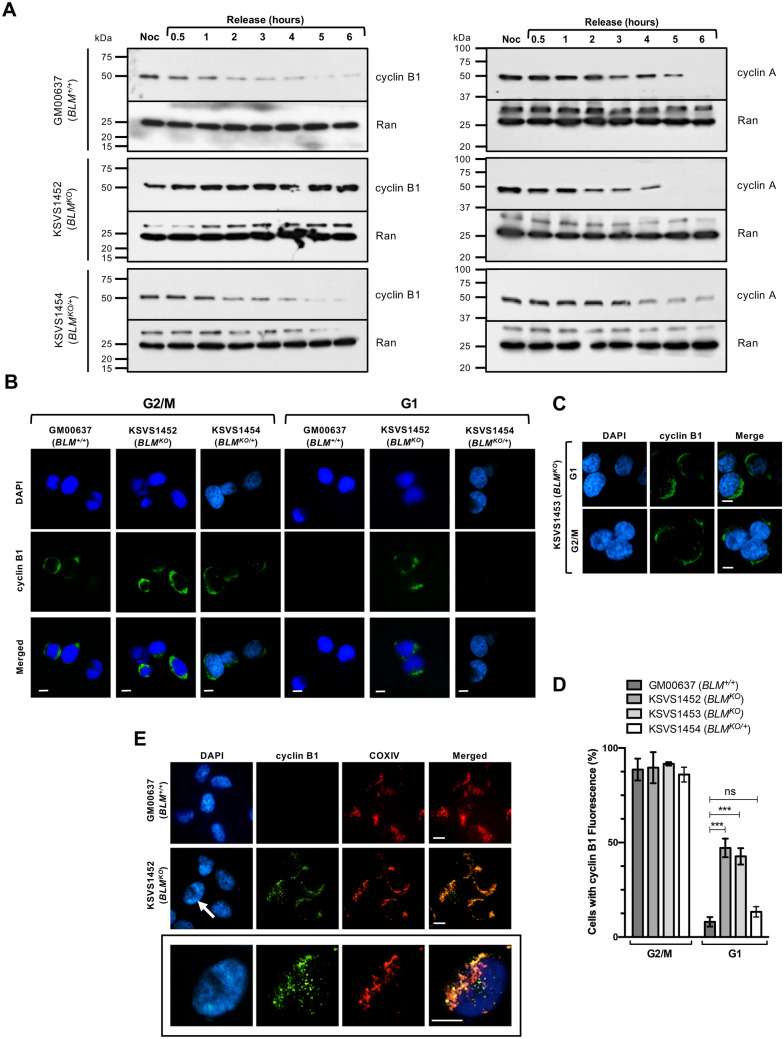
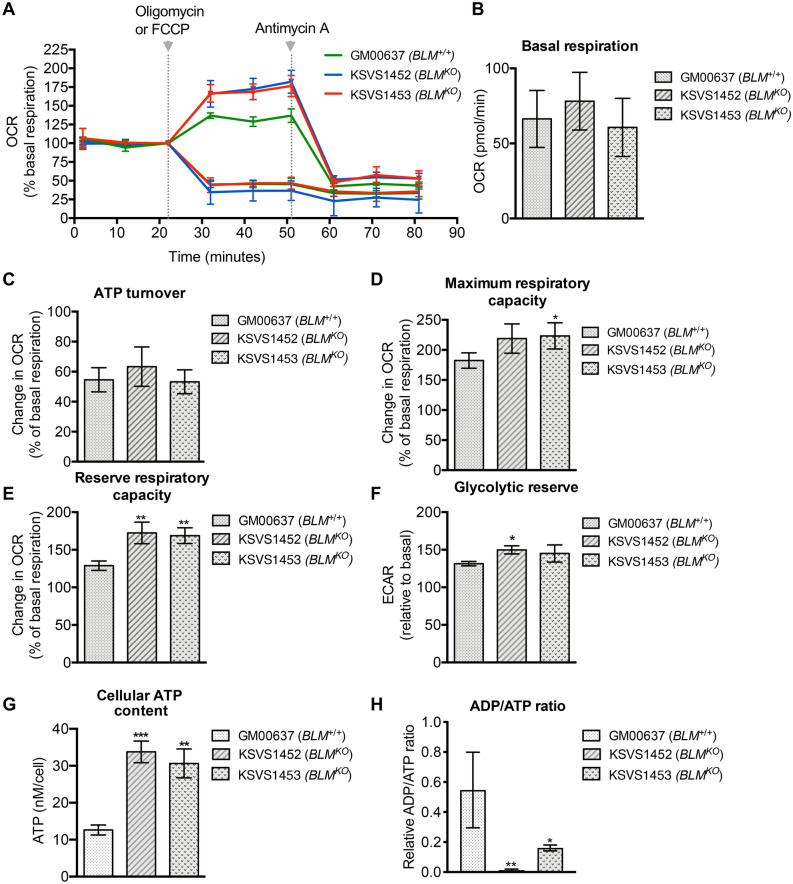
Bloom Syndrome (BS; OMIM #210900; ORPHA #125) is a rare genetic disorder that is associated with growth deficits, compromised immune system, insulin resistance, genome instability and extraordinary predisposition to cancer. Most efforts thus far have focused on understanding the role of the Bloom syndrome DNA helicase BLM as a recombination factor in maintaining genome stability and suppressing cancer. Here, we observed increased levels of reactive oxygen species (ROS) and DNA base damage in BLM-deficient cells, as well as oxidative-stress-dependent reduction in DNA replication speed. BLM-deficient cells exhibited increased mitochondrial mass, upregulation of mitochondrial transcription factor A (TFAM), higher ATP levels and increased respiratory reserve capacity. Cyclin B1, which acts in complex with cyclin-dependent kinase CDK1 to regulate mitotic entry and associated mitochondrial fission by phosphorylating mitochondrial fission protein Drp1, fails to be fully degraded in BLM-deficient cells and shows unscheduled expression in G1 phase cells. This failure to degrade cyclin B1 is accompanied by increased levels and persistent activation of Drp1 throughout mitosis and into G1 phase as well as mitochondrial fragmentation. This study identifies mitochondria-associated abnormalities in Bloom syndrome patient-derived and BLM-knockout cells and we discuss how these abnormalities may contribute to Bloom syndrome.


Conflict of interest statement

The authors declare no competing interests.

Figures

Figure 1
Figure 1
BLM-deficient cells exhibit high levels of ROS, oxidative DNA damage, and ROS-dependent reduction of DNA replication speed. (A) Flow cytometry measurement of cellular superoxide levels in GM00637 (BLM+/+) and KSVS1452 (BLMKO) cells stained with the super-oxide specific probe dihydroethidium (DHE). Analysis was performed in triplicate and mean ± SD is shown. (B) Fluorescence measurements of 2′,7′-dichlorofluorescin diacetate (DCFA)-stained BLM-proficient GM00637 (BLM+/+) cells, Bloom-syndrome-patient-derived GM08505 (BLM−/−) cells, BLM-knockout cells KSVS1452 (BLMKO) and BLM-complemented cells KSVS1454, indicating cellular ROS. Analysis was performed in triplicate and mean ± SD is shown. (C) Flow cytometry measurements of MitoSOX-stained (mitochondrial ROS) BLM-proficient GM00637 (BLM+/+) cells, Bloom-syndrome-patient-derived GM08505 (BLM−/−) cells, BLM-knockout cell line KSVS1452 (BLMKO) and BLM-complemented cell line KSVS1454. Analysis was performed in triplicate and mean ± SD is shown. (D) Representative fluorescence microscopy images of live GM00637 (BLM+/+), GM08505 (BLM−/−) and KSVS1452 (BLMKO) cells stained with MitoSOX (red foci), indicating mitochondrial ROS, and with Hoechst 33342 (blue). Scale bars 10 µm. (E) Confocal microscopy images of fixed GM00637 (BLM+/+), GM08505 (BLM−/−) and KSVS1452 (BLMKO) cells immunostained for oxidative damage to DNA (antibody 8-oxo-dG, 15A3, SCBT). GM00637 (BLM+/+) cells exposed to 100 µM H2O2 for 2 h served as a positive control for oxidative nucleotide damage. Scale bars 10 µm. (F) Median fluorescence intensity was determined by flow cytometry in fixed GM00637 (BLM+/+), GM08505 (BLM−/−) and KSVS1452 (BLMKO) cells immunostained with antibody 8-oxo-dG 15A3 (SCBT). Analysis was performed in triplicate and mean ± SD is shown. (G) Fluorescence measurements of 2′,7′-dichlorofluorescin diacetate (DCFA)-stained BLM-proficient GM00637 (BLM+/+) cells and BLM-knockout cells KSVS1452 (BLMKO) either treated with 5 mM antioxidant N-acetyl-cysteine (NAC) for 24 h, or untreated. Analysis was performed in triplicate and mean ± SD is shown. (H) Measurement of DNA replication speed in GM00637 (BLM+/+) cells and BLM-knockout cells KSVS1452 (BLMKO) either treated with 5 mM antioxidant N-acetyl-cysteine (NAC) for 24 h, or untreated, prior to DNA fiber analysis. Significance of differences was determined by a Student’s t-test and is reported as *p ≤ 0.05, **p ≤ 0.01, ***p ≤ 0.001; ns, not significant. Flow cytometry data were analyzed with FlowJo v. 10.7 software (BD Life Sciences, https://www.flowjo.com/solutions/flowjo/downloads).
Figure 2
Figure 2
TFAM and mitochondrial mass are upregulated in BLM-deficient cells. (A) Confocal microscopy images showing NAO stained BLM-proficient GM00637 (BLM+/+) and KSVS1454 (BLMKO/+) cells and BLM-deficient KSVS1452 (BLMKO) cells. KSVS1454 (BLMKO/+) was generated from KSVS1452 (BLMKO) by stable transfection with BLM cDNA (Supplemental Fig. S1G). Scale bars 10 µm. (B) Flow cytometry analysis of mitochondrial staining of GM00637 (BLM+/+) and BLM-deficient KSVS1452 (BLMKO) cells with NAO. Analysis was performed in triplicate and mean ± SD is shown. (C) Relative mitochondrial DNA content measured by qPCR using primers against mitochondrial gene COX1 and nuclear gene 18S. Analysis was performed in triplicate and mean ± SD is shown. (D) Flow cytometry analysis of mitochondrial staining of GM00637 (BLM+/+) and BLM-deficient KSVS1452 (BLMKO) and GM08505 (BLM−/−) cells by membrane-potential-dependent Mitotracker Red CMXRos. Analysis was performed in triplicate and mean ± SD is shown. (E) TFAM mRNA levels in BLM-proficient (GM00637) cells and BLM-deficient (KSVS1452) cells were determined by qRT-PCR. (FG) Western Blot analysis for TFAM expression levels in whole cell extracts from GM00637 (BLM+/+), the isogenic BLM-deficient cell line KSVS1452 (BLMKO) and in patient-derived GM08505 (BLM−/−) cell line. Whole cell extracts were prepared from three independent cultures and TFAM levels quantified from Western blots using Image J. GAPDH was used as a loading control. (H) Confocal microscopy images of fixed GM00637 (BLM+/+), KSVS1452 (BLMKO) and KSVS1454 (BLMKO/+) cells immunostained for endogenous TFAM. See also Fig. S3A for TFAM staining in GM08505 (BLM−/−) cells. Scale bars 10 µm. (I) Confocal microscopy images of KSVS1452 cells immunostained for TFAM and co-stained with Mitotracker and DAPI. Scale bars 10 µm. Significance of differences was determined by a Student’s t test and is reported as *p ≤ 0.05, **p ≤ 0.01, ***p ≤ 0.001. Flow cytometry data were analyzed with FlowJo v. 10.7 software (BD Life Sciences, https://www.flowjo.com/solutions/flowjo/downloads).
Figure 3
Figure 3
BLM-deficient cells are proficient in autophagy. (A) Western blot analysis of GM00637 (BLM+/+) and KSVS1452 (BLMKO) cells for levels of cytosolic LC3-I and autophagosomal marker LC3-II. Both, cytosolic LC3-I and membrane-bound LC3-II, were detected with LC3 antibody G-9 (SCBT). Cells were treated with 10 µM CCCP for 6 h to induce autophagy and/or with 30 µg/ml HQC for 6 h to interrupt autophagic flux. (B) Confocal microscopy images of fixed GM00637 (BLM+/+) and KSVS1452 (BLMKO) cells immunostained for LC3 (MAP LC3β-G-9 (SCBT) and COXIV (Cell Signaling), and stained with DAPI. Cells were treated with 30 µg/ml HCQ for 6 h to interrupt autophagic flux. Scale bars 10 µm. (C) Quantification of colocalization of antibody staining for LC3 and COXIV in HCQ-treated cells imaged as in panel B. 30 cells from BLM-proficient GM00637 cells and BLM-deficient KSVS1452 cells were analyzed. Significance of differences was determined by a Student’s t test and is reported as *p ≤ 0.05. (D) Confocal microscopy images of BLM-proficient GM00637 cells and isogenic BLM-knockout cells KSVS1452 stained with MitoTracker Deep Red and Lysotracker in the presence and absence of CCCP. Scale bars 10 µm.
Figure 4
Figure 4
BLM deficiency is associated with mitochondrial fragmentation and persistent activation of mitochondrial fission protein Drp1. (A) Confocal microscopy images showing mitochondrial morphology in fixed GM00637 (BLM+/+) and BLM-deficient KSVS1452 (BLMKO) cells stained with Mitotracker (red) and DAPI (blue). Scale bars 10 µm. (B) Measurements of mitochondrial network morphology parameters using the Mito-Morphology Macro in ImageJ (version 1.53a; freely available at http://imageJ.nih.gov/ij). (C) Mitochondria of cells prepared by high-pressure freezing/freeze substitution fixation (HPF/FS) were imaged by transmission electron microscopy. Sections of two representative cells of each cell line are shown at higher (scale bar 200 nm) and lower (scale bar 0.5 µm) magnification. Images were obtained with Digital Micrograph software v. 1.93.1362 (Gatan Microscopy Suite (GMS) software, https://www.gatan.com/installation-instructions#Step1) (D) Western blot analysis and quantification of expression levels from whole cell extracts of fission marker Drp1 ([6Z-82], SCBT) and fusion markers Mfn1 ([D-10], SCBT) and Opa1 ([612606], BD Biosciences) in BLM-proficient cell lines GM00637 (BLM+/+) and KSVS1454 (BLMKO/+) and in BLM-deficient KSVS1452 (BLMKO) cells. The three cell lines are isogenic; KSVS1454 (BLMKO/+) was generated from KSVS1452 (BLMKO) by stable transfection with BLM cDNA (Fig. S1G). Whole cell extracts were prepared from three independent cultures and quantification was performed using ImageJ (version 1.53a; freely available at http://imageJ.nih.gov/ij). Ran ([610340], BD Biosciences) was used as a loading control. (E) Western blot analysis of Drp1 phosphorylation status in the BLM-proficient GM00637 (BLM+/+) and BLM-deficient KSVS1452 (BLMKO) cell lines following G2/M arrest and release. Cells were blocked at G2/M with nocodazole, released for 8 h and expression levels and phosphorylation status of Drp1 analyzed by Western blot using Drp1 antibody 6Z-82 (SCBT) and phospho-Drp1-Ser616 antibody D9A1 (Cell Signaling). Ran ([610340], BD Biosciences) was used as a loading control. Significance of differences was determined by a Student’s t test and is reported as *p ≤ 0.05, **p ≤ 0.01, ***p ≤ 0.001.
Figure 5
Figure 5
BLM-deficient cells exhibit unscheduled cyclin B1 expression during G1 phase that localizes to mitochondria. (A) Western Blot analysis of expression levels of cyclin B1 ([GNS1], SCBT) and cyclin A ([BF683], SCBT) in whole cell extracts of BLM-proficient cell lines GM00637 (BLM+/+) and KSVS1454 (BLMKO/+) and BLM-deficient cell line KSVS1452 (BLMKO) following G2/M block and release. Ran ([610340], BD-Biosciences) was used as a loading control. Cells were arrested with nocodazole, released into drug-free media and processed for Western blotting at the indicated time points. (B) Immunofluorescence microscopy of sorted G1 and G2/M phase cells of GM00637 (BLM+/+), KSVS1452 (BLMKO) and KSVS1454 (BLMKO/+). KSVS1454 is the BLM-complemented KSVS1452 cell line. Sorted cells were immunostained for cyclin B1 ([GNS1], SCBT) and counterstained with DAPI. Scale bars 10 µm. (C) Immunofluorescence microscopy for cyclin B1 staining was repeated for G1 and G2/M sorted cells of KSVS1453, an independent second clone of the biallelic BLM-knockout cell line. (D) Percentage of sorted G1 and G2/M cells of BLM-proficient cell lines [GM00637 (BLM+/+), KSVS1454 (BLMKO/+)] and BLM-deficient cell lines [KSVS1452 (BLMKO), KSVS1453 (BLMKO)] cells exhibiting cyclin B1 fluorescence. A minimum of 300 cells from three independent cultures of each cell line was analyzed by confocal microscopy. Mean ± SD is reported. (E) Confocal microscopy images of fixed sorted G1 phase cells of GM00637 (BLM+/+) and KSVS1452 (BLMKO) immunostained for cyclin B1 ([GNS1], SCBT) and COXIV ([3E11], Cell Signaling) and counterstained with DAPI. Bottom panel shows an enlargement of the nucleus indicated by a white arrow. Scale bars 10 µm. Significance of differences in (D) was determined by a Student’s t-test and is reported as ***p ≤ 0.001; ns, not significant.
Figure 6
Figure 6
Bioenergetic profile of BLM-deficient cells. (A) Oxygen consumption rates (OCR) of BLM-proficient cell line GM00637 and BLM-deficient cell lines KSVS1452 and KSVS1453 were measured on a XF-96 Extracellular Flux Analyzer (Seahorse Bioscience) after addition of oligomycin or FCCP at 22 min and after addition of antimycin A after 51 min. From measurements in (A) basal respiration, (B), ATP turnover rate (C), maximum respiratory rate (D) reserve respiratory capacity (E) and glycolytic reserve (F) were calculated. All measurements were normalized to basal rate (data point at 22 min). (G) Total cellular ATP content was measured in whole cell extracts of BLM-proficient cell (GM00637) and BLM-deficient cells (KSVS1452, KSVS1543) using a luciferase-based assay. (H) ADP/ATP ratio was measured in whole cell extracts of BLM-proficient cells (GM00637) and BLM-deficient cells (KSVS1452, KSVS1453) using a bioluminescent method based on the conversion of ATP by luciferase.

Similar articles

Cited by

References

    1. Cunniff C, Bassetti JA, Ellis NA. Bloom's syndrome: clinical spectrum, molecular pathogenesis, and cancer predisposition. Mol. Syndromol. 2017;8:4–23. doi: 10.1159/000452082. - DOI - PMC - PubMed
    1. Ellis NA, et al. The Bloom's syndrome gene product is homologous to RecQ helicases. Cell. 1995;83:655–666. doi: 10.1016/0092-8674(95)90105-1. - DOI - PubMed
    1. Chu WK, Hickson ID. RecQ helicases: multifunctional genome caretakers. Nat. Rev. Cancer. 2009;9:644–654. doi: 10.1038/nrc2682. - DOI - PubMed
    1. Wu WQ, Hou XM, Li M, Dou SX, Xi XG. BLM unfolds G-quadruplexes in different structural environments through different mechanisms. Nucleic Acids Res. 2015;43:4614–4626. doi: 10.1093/nar/gkv361. - DOI - PMC - PubMed
    1. Sun H, Karow JK, Hickson ID, Maizels N. The Bloom's syndrome helicase unwinds G4 DNA. J. Biol. Chem. 1998;273:27587–27592. doi: 10.1074/jbc.273.42.27587. - DOI - PubMed

Publication types

MeSH terms

LinkOut - more resources