. 2021 Jan 25;4(1):107.
doi: 10.1038/s42003-020-01604-x.

Restoration of breathing after opioid overdose and spinal cord injury using temporal interference stimulation

Affiliations

Restoration of breathing after opioid overdose and spinal cord injury using temporal interference stimulation

Michael D Sunshine et al. Commun Biol. .

Abstract

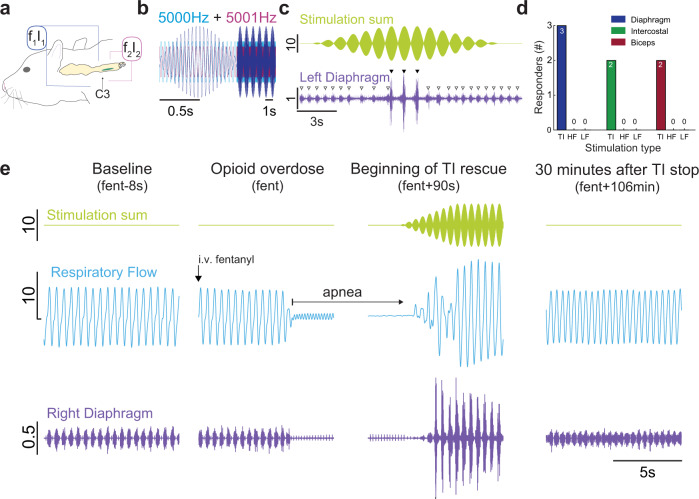
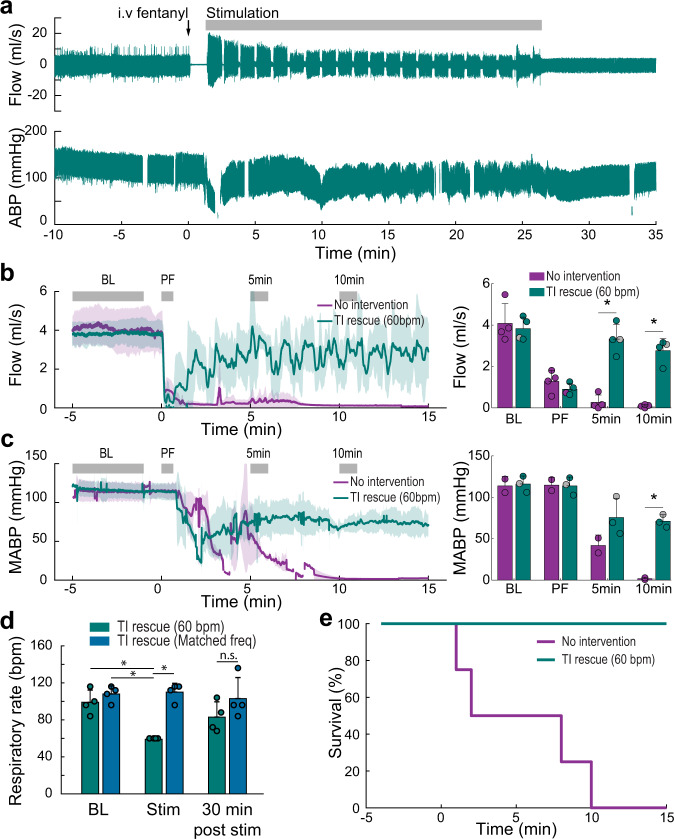
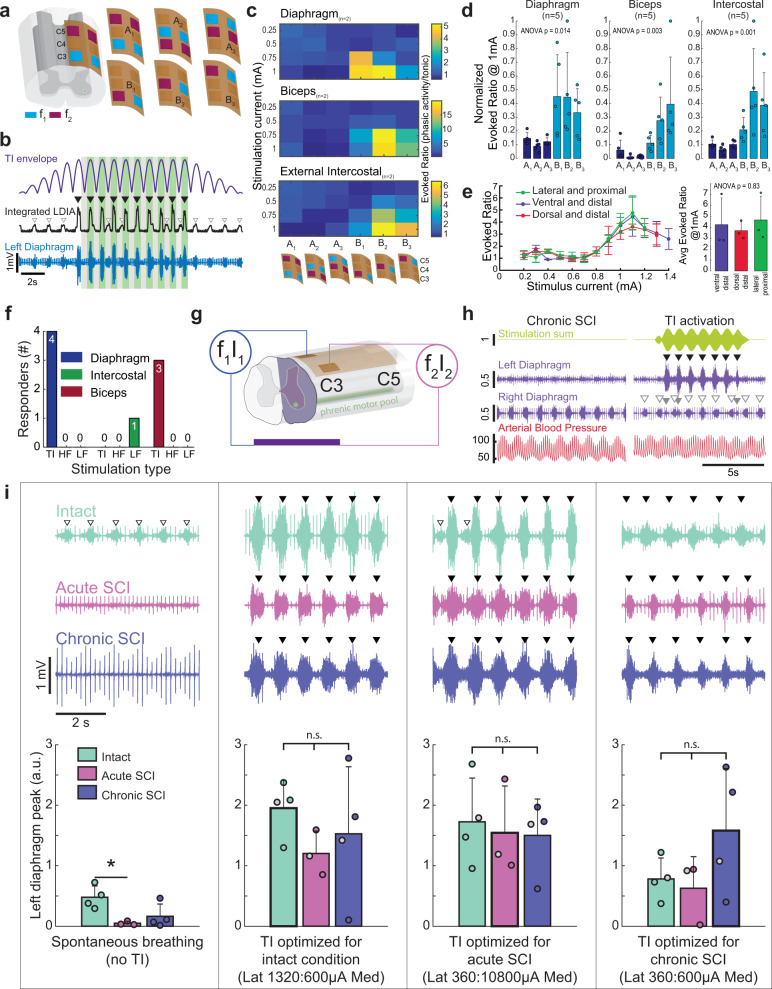
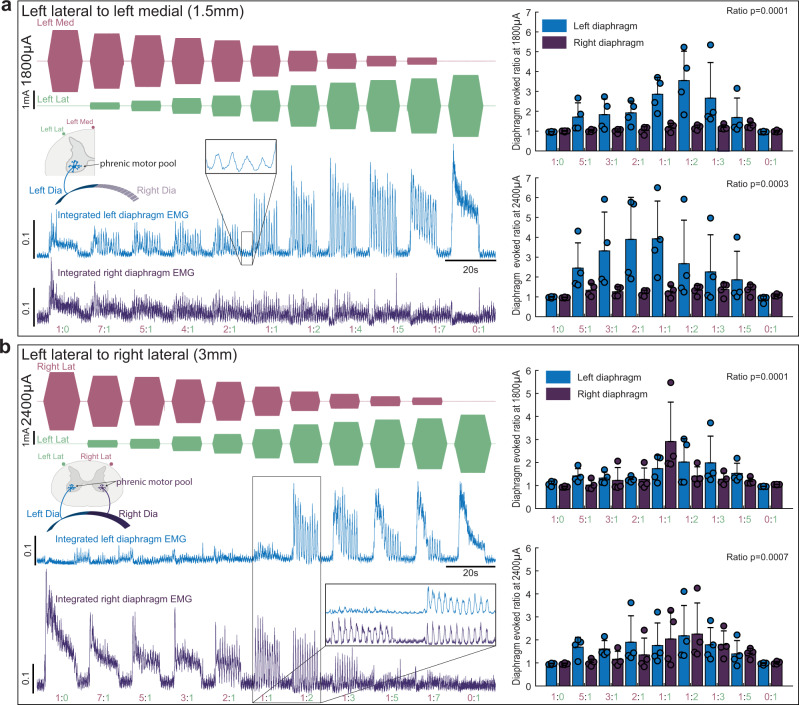
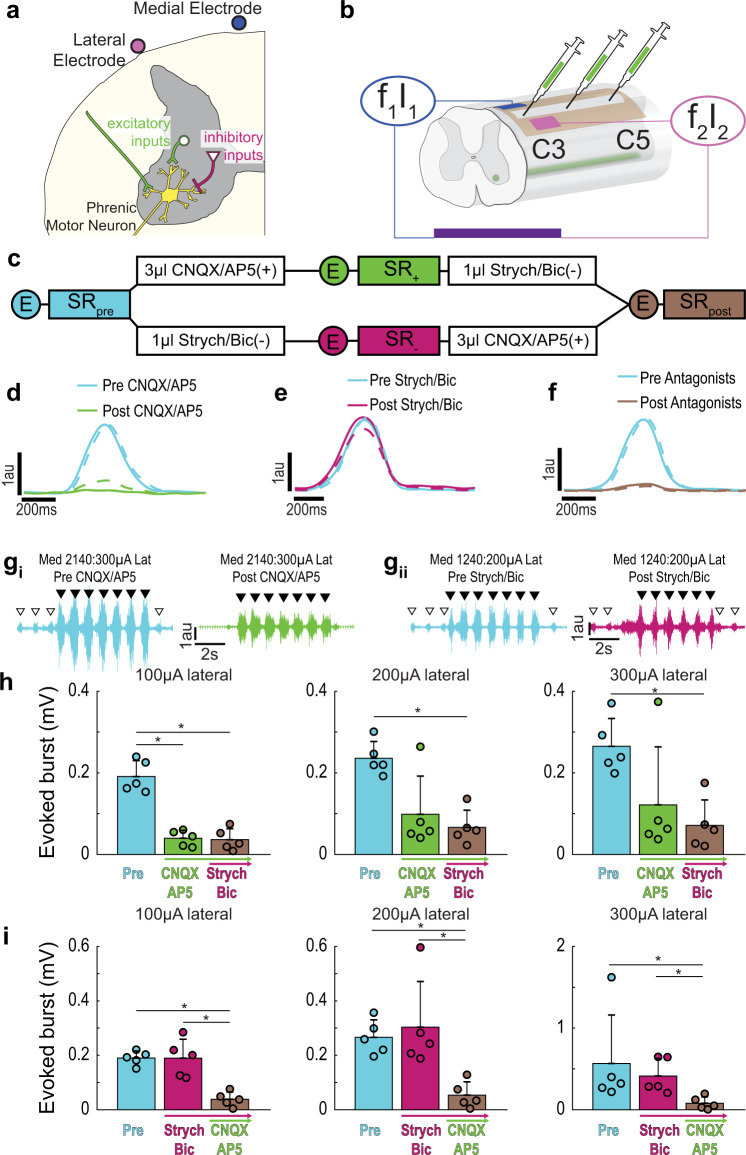
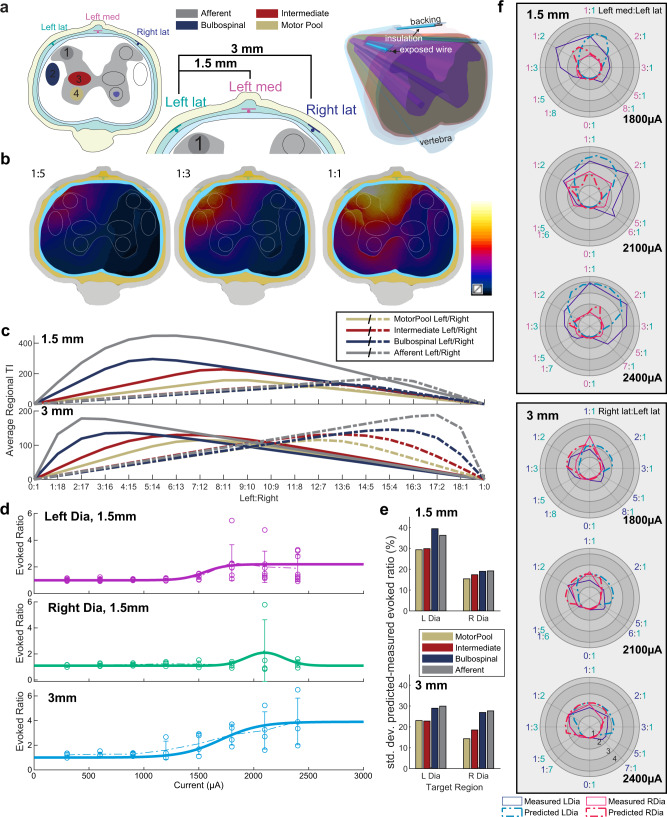
Respiratory insufficiency is a leading cause of death due to drug overdose or neuromuscular disease. We hypothesized that a stimulation paradigm using temporal interference (TI) could restore breathing in such conditions. Following opioid overdose in rats, two high frequency (5000 Hz and 5001 Hz), low amplitude waveforms delivered via intramuscular wires in the neck immediately activated the diaphragm and restored ventilation in phase with waveform offset (1 Hz or 60 breaths/min). Following cervical spinal cord injury (SCI), TI stimulation via dorsally placed epidural electrodes uni- or bilaterally activated the diaphragm depending on current and electrode position. In silico modeling indicated that an interferential signal in the ventral spinal cord predicted the evoked response (left versus right diaphragm) and current-ratio-based steering. We conclude that TI stimulation can activate spinal motor neurons after SCI and prevent fatal apnea during drug overdose by restoring ventilation with minimally invasive electrodes.


Conflict of interest statement

N.G. and E.S.B. have a patent on TI technology, assigned to MIT. E.N. is a board member and shareholder of TI Solutions AG, which develops stimulation devices and treatment-planning tools for temporal interference research. M.D.S., K.J.O., and D.D.F. have submitted a patent application related to use of TI for stimulating breathing. T.H.M. and A.M.C. declare no competing interests.

Figures

Fig. 1
Fig. 1. Representative traces show that intramuscular TI stimulation restores diaphragm EMG activity and inspiratory airflow after opioid overdose.
a Schematic of wire placement targeting C3 to activate the phrenic motor pool (green column). Stimulation was delivered via a pair of wires on each side of the neck. One wire per side was inserted into the neck musculature with intent to target the ventral and dorsal aspect of the spinal column near C3. The left electrode pair (blue) was stimulated with current-1 (I1) and frequency-1 (f1), and the right pair (pink) was stimulated with current-2 (I2) and frequency-2 (f2). b Stimulation paradigm. f1 = 5000 Hz (blue), f2 = 5001 Hz (pink), produces a TI field with a modulation envelope or beat frequency of 1 Hz (purple), which produced a respiratory rate of 60 breaths per minute. c TI stimulation causes robust diaphragm EMG activation in phase with the TI beat frequency (shown in green). TI-induced stimulation (black triangles) was able to activate the diaphragm well above levels seen during the spontaneously breathing baseline period (white triangles). d Temporal interference (TI) stimulation results in robust phasic activation of the diaphragm in n = 3/3 animals, while control high frequency (HF), and low frequency (LF) waveforms do not activate the diaphragm (Fisher’s exact test, diaphragm: p = 0.0119, intercostal: p = 0.083, bicep: p = 0.083). e Representative data from a single animal showing right hemi-diaphragm activity and respiratory airflow during spontaneous breathing (baseline, left panel), cessation of diaphragm inspiratory EMG activity following opioid overdose (apnea, middle-left panel), restoration of EMG activity and respiratory airflow via TI stimulation (middle-right panel), and resumption of spontaneous EMG activity and respiratory airflow lasting 30 min beyond the TI stimulation period (right panel). Respiratory airflow at baseline occurs in phase with spontaneous diaphragm EMG bursts. Intravenous fentanyl stopped respiratory airflow (remaining oscillations reflect cardiac pressures). TI rescue activated the left diaphragm in phase with the TI beat frequency (illustrated by the green trace). In this example, TI stimulation activated the left diaphragm well above baseline values but did not activate the right diaphragm. Left diaphragm activation was sufficient to sustain life until opioid-induced respiratory depression was no longer present. Scale bar units: stimulation (mA), diaphragm (mV), and respiratory flow (ml/s).
Fig. 2
Fig. 2. Intramuscular TI stimulation (TI rescue) prevents fatal apnea by restoring diaphragm activation after opioid overdose.
Spontaneously breathing rats under urethane anesthesia received an intravenous injection of fentanyl (30 mcg/kg) sufficient to cause lasting respiratory suppression. Following fentanyl dosing, animals received intramuscular TI stimulation or no intervention. Panel a shows an example of sustained restoration of respiratory airflow when the stimulation was initiated shortly after opioid overdose-induced apnea, and was delivered with a pattern of 60 s on and 3 s off until spontaneous breathing resumed. Note: The gaps in the blood pressure traces indicate when arterial blood samples were taken. b Average respiratory airflow (two-way ANOVA: group F(1) = 40.84, p < 0.0001; time F(3) = 41.86, p < 0.0001; interaction F(3) = 21.4, p < 0.0001) and (c) mean arterial blood pressure (MABP) (n = 4 animals/group, two-way ANOVA: group F(1) = 19.81, p = 0.0008; time F(3) = 45.95, p < 0.0001; interaction F(3) = 7.82 p = 0.0037). The gray bars indicate time periods selected for quantitative comparison (Baseline–BL, immediately Post Fentanyl–PF, five minutes–5 min, and ten minutes–10 min after fentanyl). The gray dots indicate data points from the animals used for the example traces in panel a, (mean + 1 standard deviation; asterisk (*) indicates p < 0.05). d TI stimulation restored ventilation and prevented fatal apnea in all animals (TI rescue). TI stimulation with a 1 Hz beat frequency produced a respiratory rate of 60 breaths per minute (bpm) during stimulation. When the beat frequency was targeted to the endogenous respiratory rate, there was no difference in the evoked vs. spontaneous respiratory rate (n = 4 animals, two-way ANOVA: group F(1) = 22.64, p = 0.0002; time F(3) = 3.85, p = 0.0407; interaction F(3) = 5.03, p = 0.0183). e Survival curve for no-intervention (n = 4 animals) and TI rescue (60 bpm) conditions (n = 4 animals).
Fig. 3
Fig. 3. Effect of electrode configuration on diaphragm activation and diaphragm response to epidural TI stimulation.
a Initial testing to determine left diaphragm (LDIA), bicep, and external intercostal activation utilized an epidural electrode grid spanning C3–C5 and with three bipolar (A1, A2, and A3) and three monopolar configurations (B1, B2, and B3); note: electrode size is exaggerated for schematic, actual wire width is 25 µm. b The ratio of TI stimulation-evoked EMG output to spontaneous EMG activity was used to quantify the response. The EMG activity during the peak of the TI envelope (green shaded boxes) was divided by the activity in the trough of the envelope (gray shaded boxes) for the period of stable stimulation (i.e., excluding the ramp and damp phases). c Heat maps which display the activation of the diaphragm, biceps, and external intercostal muscles as a function of stimulus amplitude and electrode configuration (waveform current ratio 1:1 in these examples). The particular electrode configuration is shown on the bottom of the panel. d The average evoked diaphragm EMG activity (mean + 1 standard deviation) during TI stimulation using 1 mA in both waveforms (asterisk (*) indicates p < 0.05 tukey’s post-hoc). Electrode configuration B1 (C3 monopolar stimulation) activated the diaphragm with minimal off-target biceps activation (n = 5 animals, Kruskal–Wallis one-way ANOVA on ranks: diaphragm H(5) = 20.73, p < 0.001; biceps H(5) = 22.83, p < 0.001; intercostal H(5) = 23.09, p < 0.001). e Effect of varying the location of the current return on diaphragm activation during C3 monopolar TI stimulation. Three different current return electrode locations were used (RM two-way ANOVA current F(26) = 8.79, p < 0.001; return location F(2) = 2.51, p = 0.092; n = 3 animals). f Temporal interference (TI) stimulation phasically activated the diaphragm in n = 4/4 animals, while high frequency (HF), and low frequency (LF) waveforms did not phasically activate the diaphragm (Fisher exact test; diaphragm, p = 0.002; intercostal, p = 0.333; bicep, p = 0.018). g Schematic of the mid-cervical spinal cord injury (purple indicates spinal hemilesion) and electrode locations. h Example data from a rat with chronic (10 months) cervical spinal cord injury. At baseline (without stimulation, left panels), the left hemi-diaphragm is inactive while the right hemi-diaphragm shows rhythmic bursting. Electrocardiogram (ECG) activity is present in both traces. TI stimulation (right panel) immediately activates the left hemi-diaphragm (black arrowheads) and produces small bursts in the right diaphragm (gray arrowheads). Spontaneous activity in the right hemi-diaphragm (white arrowheads) is uninterrupted. Units: stimulation (mA), diaphragm (mV), arterial blood pressure (mmHg). Panel i provides additional examples of diaphragm EMG output and mean responses. The left panel shows diaphragm EMG during spontaneous breathing in spinal intact, acute, and chronic spinally injured rats (mean diaphragm bursting is shown in the plots at the bottom of the panel). Proceeding left to right across the figure, evoked EMG responses are shown using stimulus current ratios optimized for each condition (i.e., spinal intact, acute and chronic injury). Spontaneous bursts (white arrowheads) are present in the spinal intact animal but are absent after acute and chronic SCI. TI stimulation effectively activates the diaphragm (black arrowheads) in all three conditions. Plots: one way ANOVA spontaneous breathing F(2) = 6.186, p = 0.024; optimized for intact F(2) = 0.863, p = 0.458; optimized for acute SCI F(2) = 0.115, p = 0.893; optimized for chronic SCI F(2) = 1.914, p = 0.209; asterisk (*) indicates p < 0.05 tukey’s post-hoc; gray filled dots indicate animals used in example traces (intact, n = 4 animals; acute SCI, n = 3 animals; chronic SCI, n = 4 animals).
Fig. 4
Fig. 4. Current steering during epidural TI stimulation.
Using diaphragm EMG as the outcome measure, the steerability of the TI focal point was examined by varying the ratio of the two stimulus currents using two inter-electrode distance. Stimulating electrodes were placed on the left side of the spinal cord (a, 1.5 mm apart) or spanning the dorsal surface (b; 3 mm apart). The left side of panel a shows an example of rectified and integrated diaphragm activity when TI was delivered with lateral electrode placement and a current sum of 1800 µA. In this example it can be appreciated that varying the TI current ratio dramatically alters the magnitude of phasic diaphragm activation, and tonic diaphragm activation occurs at current ratios of 1:0 and 0:1. The mean data (right panels) show a statistical effect of current ratio at currents sums of 1800 µA (Friedman’s two-way ANOVA controlling for diaphragm side effect of current ratio Chi-squared(8) = 33, p < 0.0001) and 2400 µA (Friedman’s two-way ANOVA controlling for diaphragm side effect of current ratio Chi-squared(8) = 23.96, p = 0.0023). The left side of panel b shows an example of diaphragm activity evoked by stimulating the spinal cord using an inter-electrode distance of 3 mm and a current sum of 2400 µA. In this example, TI stimulation induced a robust bilateral and phasic diaphragm EMG activation at a current ratio of 1:2. The mean data show an effect of current ratio at sum current of 1800 µA (Friedman’s two-way ANOVA controlling for diaphragm side effect of current ratio Chi-squared(8) = 29.33, p = 0.00003) and at 2400 µA (Chi-squared(8) = 26.99, p = 0.00007). Note we lowered inspired CO2 to reduce endogenous diaphragm activity during these trials, small bursts are still present (inset panel a), but at much lower amplitude than the TI-evoked bursts (n = 4 animals).
Fig. 5
Fig. 5. Pharmacologically probing the contribution of synaptic input to phrenic motor neurons in TI stimulation-induced diaphragm activation.
To determine if TI stimulation activates the diaphragm due to direct depolarization of phrenic motor neurons or through activation of synaptic inputs to these cells, we utilized focal injections of glutamate, glycine, and GABAA receptor antagonists. a Diagram of the phrenic motor neuron pool illustrating excitatory (green) and inhibitory (pink) presynaptic inputs. b Schematic of the epidural stimulation grid and unilateral (left) intraspinal drug injection. c Summary of the experimental paradigm. In one cohort (n = 5 animals), excitatory presynaptic inputs were antagonized first, followed by inhibitory antagonists. In another cohort (n = 5 animals) the order was reversed. Circles with E indicate when endogenous activity was measured, SR indicate when stimulus response curves were performed. Panels df provide cycle triggered averages of endogenous diaphragm EMG activity (using the activity in the right (unblocked) hemi-diaphragm as the trigger). d Before (blue) and after (green) intraspinal injection of CNQX/AP5 (n = 5 animals). e Before (blue) and after (pink) intraspinal injection of strychnine/bicuculline (n = 5 animals). f Before (blue) and after (brown) both sets of drugs were injected (n = 10 animals). The solid line is average of breaths over the first 30 s post-injection and the dashed line is the average of the breaths over the last 30 s. gi Example diaphragm EMG illustrating the magnitude of TI stimulation-evoked responses before (blue, pre CNQX/AP5) and after glutamate receptor antagonism (green, post CNQX/AP5). Endogenous bursts (white arrowheads) were eliminated after CNQX/AP5 indicating that excitatory drive to the phrenic motor pool was effectively blocked. Black arrowheads indicate the peak TI envelope, marking evoked bursts. gii Example diaphragm EMG illustrating the magnitude of evoked responses before (blue, pre-strychnine/bicuculline) and after glycinergic and GABAergic receptor antagonism (pink, post strychnine/bicuculline). Stimulus current on the medial:lateral wires are shown above the traces. h Impact of CNQX/AP5 followed by strychnine/bicuculline on the TI-evoked diaphragm EMG burst. (n = 5 animals). i Impact of strychnine/bicuculline followed by CNQX/AP5 on the TI-evoked diaphragm EMG burst (n = 5 animals). In panels h and i, data are shown for 100, 200, and 300 µA lateral currents with medial current standardized at the value which evoked diaphragm EMG activity 25% above endogenous (pre-drug) baseline bursting. All data presented as mean +1 SD (*p < 0.05 post hoc, panel h at 100 µA: one-way ANOVA F(2) = 44.77, p < 0.001; all other panels: Kruskal–Wallis one-way ANOVA on ranks; panel h at 200 µA H(2) = 6.860, p = 0.032; panel h at 300 µA H(2) = 6.720, p = 0.035; panel i at 100 µA H(2) = 9.380, p = 0.009; panel i at 200 µA H(2) = 9.420, p = 0.009; panel i at 300 µA H(2) = 9.380, p = 0.009).
Fig. 6
Fig. 6. Computational prediction of TI stimulation-induced evoked response and current steering.
a Simulation setup reproducing the experimental setup. Three electrodes are placed dorsally in the epidural space of the spine (left lateral, right lateral, and ‘Left’ medial), while a shared return electrode is placed ventrally. TI modulation amplitude maps are generated using two different configurations of channel pairs: the ‘1.5 mm’ configuration using the left lateral and the medial electrodes, as well as the ‘3 mm’ configuration using the left and the right lateral electrodes (naming reflects the electrode spacing). Four candidate target regions have been defined (shown as colored ellipses). b By changing the current ratio, the distribution of the TI modulation amplitude can be steered laterally. c shows for both configurations, how changing the ratio affects the averaged TI field of the left (continuous) and right (dashed) target regions for a given total current (graphs are normalized to 2 mA). d To translate TI modulation amplitude field to evoked left and right diaphragm responses (evoked ratio) sigmoid/Gaussian curves are fitted to the measured current strength-dependent responses (1:1 current ratio). The data points are the experimental data that the model (thick solid line) is derived from. e The deviation (relative standard deviation) between measurements and simulation predictions of the evoked left and right diaphragm responses have been quantified for predictions based on the simulated TI exposure of the four candidate target regions. Motor Pool-based predictions provide the best results. Panel f shows, as a function of the current ratio, polar plots comparing the experimentally measured (solid line) left (blue) and right (red) diaphragm evoked ratio to the simulation predictions (dashed line) for a range of total currents and for the two exposure configurations—here only the superior predictions based on ‘Motor Pool’ exposure are shown.

Similar articles

Cited by

References

    1. Soelberg CD, Brown RE, Jr., Du Vivier D, Meyer JE, Ramachandran BK. The US opioid crisis: current federal and state legal issues. Anesth. Analg. 2017;125:1675–1681. doi: 10.1213/ANE.0000000000002403. - DOI - PubMed
    1. Rzasa Lynn R, Galinkin JL. Naloxone dosage for opioid reversal: current evidence and clinical implications. Ther. Adv. Drug Saf. 2018;9:63–88. doi: 10.1177/2042098617744161. - DOI - PMC - PubMed
    1. Buajordet I, Naess AC, Jacobsen D, Brørs O. Adverse events after naloxone treatment of episodes of suspected acute opioid overdose. Eur. J. Emerg. Med. 2004;11:19–23. doi: 10.1097/00063110-200402000-00004. - DOI - PubMed
    1. Torralva R, Janowsky A. Noradrenergic mechanisms in fentanyl-mediated rapid death explain failure of naloxone in the opioid crisis. J. Pharm. Exp. Ther. 2019;371:453–475. doi: 10.1124/jpet.119.258566. - DOI - PMC - PubMed
    1. Moss RB, Carlo DJ. Higher doses of naloxone are needed in the synthetic opiod era. Subst. Abus. Treat. Prev. Policy. 2019;14:6. doi: 10.1186/s13011-019-0195-4. - DOI - PMC - PubMed

Publication types