. 2021 Mar;5(3):295-303.
doi: 10.1038/s41559-020-01379-8. Epub 2021 Jan 25.

Pandanus nutshell generates a palaeoprecipitation record for human occupation at Madjedbebe, northern Australia

Affiliations

Pandanus nutshell generates a palaeoprecipitation record for human occupation at Madjedbebe, northern Australia

S Anna Florin et al. Nat Ecol Evol. 2021 Mar.

Abstract

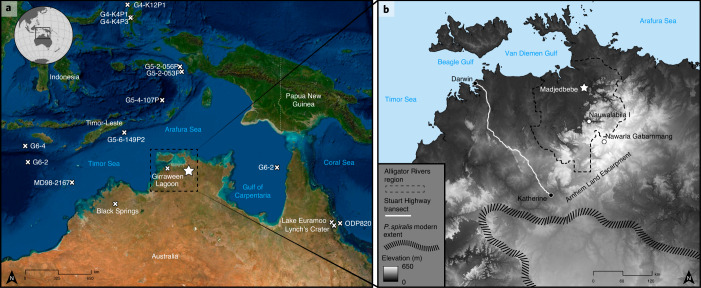
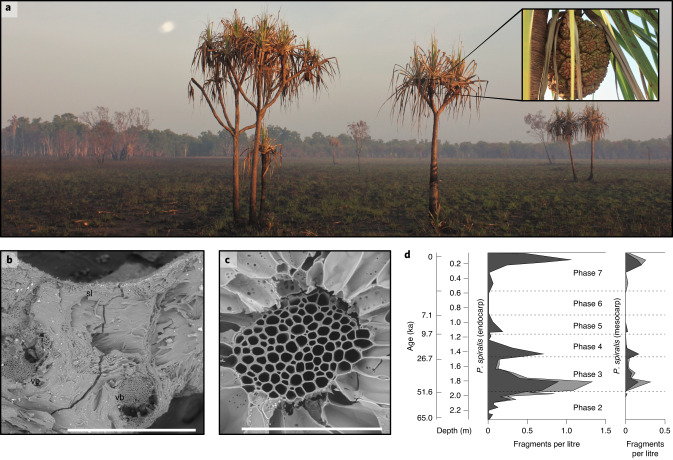
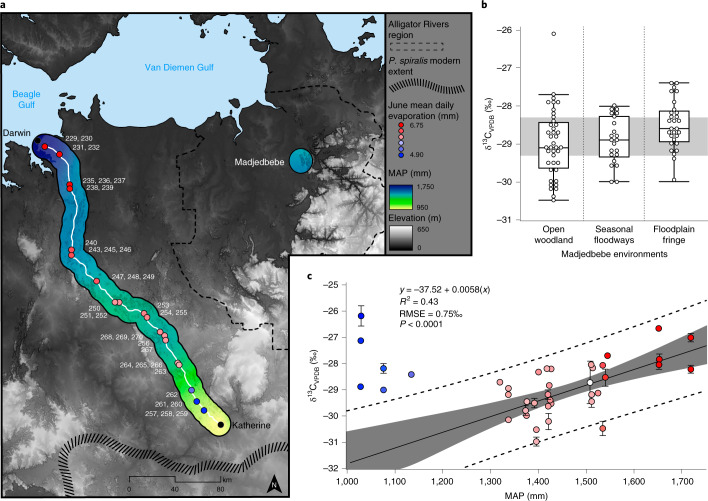
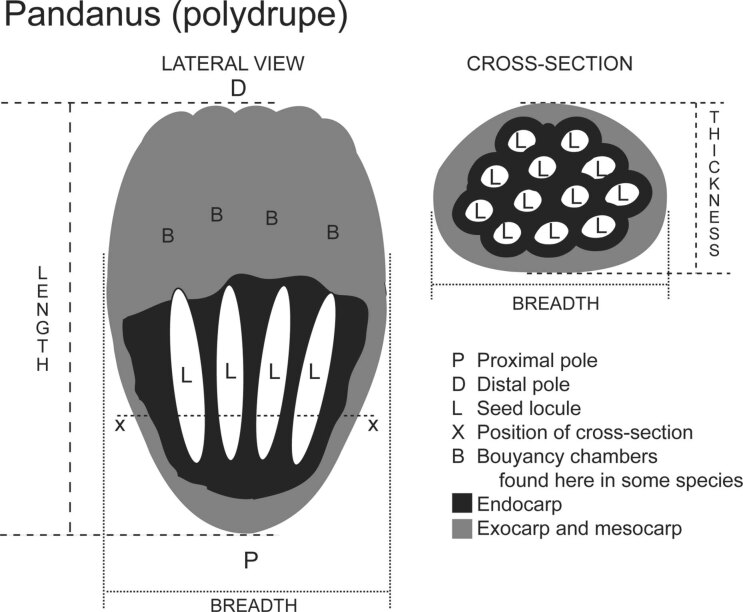
Little is known about the Pleistocene climatic context of northern Australia at the time of early human settlement. Here we generate a palaeoprecipitation proxy using stable carbon isotope analysis of modern and archaeological pandanus nutshell from Madjedbebe, Australia's oldest known archaeological site. We document fluctuations in precipitation over the last 65,000 years and identify periods of lower precipitation during the penultimate and last glacial stages, Marine Isotope Stages 4 and 2. However, the lowest effective annual precipitation is recorded at the present time. Periods of lower precipitation, including the earliest phase of occupation, correspond with peaks in exotic stone raw materials and artefact discard at the site. This pattern is interpreted as suggesting increased group mobility and intensified use of the region during drier periods.


Conflict of interest statement

The authors declare no competing interests.

Figures

Fig. 1
Fig. 1. The geographical location of the study area.
a, A map showing the location of Madjedbebe (star) and all Pleistocene-age environmental records for the monsoonal tropics of northern Sahul (crosses),–. b, The location of the modern and archaeological study sites, including Madjedbebe and other early (≥45ka) archaeological sites (white dots), within and near the Alligator Rivers region (dashed line),,; the Stuart Highway transect from Darwin to Katherine (white line); and the modern extent of the southern distribution of P. spiralis (slashed line). Esri, DigitalGlobe, GeoEye, Earthstar, Geographics, CNES/Airbus DS, USDA, USGS, AeroGRID, IGN, and the GIS User Community (a); panel b adapted with permission from ref. , Geoscience Australia
Fig. 2
Fig. 2. Modern and archaeological P. spiralis.
a, P. spiralis trees on the Magela Creek floodplain near Madjedbebe in October 2017, with an inset displaying the cephalium, or aggregate fruit of the tree, comprising ~20 polydrupes (see Supplementary Section 1). b, A scanning electron micrograph of an archaeological fragment of P. spiralis endocarp from Phase 7 (C3/5). sl, seed locule; vb, vascular bundle. Scale bar, 1 mm. c, A scanning electron micrograph of an archaeological fragment of P. spiralis mesocarp from Phase 7 (C3/6). Scale bar, 200 µm. See Florin et al. for a detailed identification proof. d, The numbers of fragments of P. spiralis endocarp and P. spiralis mesocarp recovered per litre of soil floated from Madjedbebe, versus increasing depth (m) and decreasing archaeological phase. The dark grey area indicates the numbers of P. spiralis endocarp and mesocarp by litres floated, respectively, and the light grey area indicates the numbers of cf. P. spiralis endocarp and mesocarp by litres floated, respectively. The age estimates are based on the modelled mid-point value of the 95% confidence interval for the start date of each phase.
Fig. 3
Fig. 3. Results of the modern stable carbon isotope analysis.
a, Samples of P. spiralis collected from different locations along the Stuart Highway, between Darwin and Katherine. MAP is calculated from 24 meteorological sites (see Supplementary Section 2) and displayed as a 10-km buffer surrounding the sampling transect, with blue and yellow indicating higher and lower precipitation, respectively. Additionally, we indicate the mean daily evaporation for June by the fill colour of each dot, which reflects the first month of fruiting of the P. spiralis drupe. Individual P. spiralis trees are indicated by their specimen number (white numbers; Supplementary Table 3). b, δ13C values of P. spiralis collected from different growth environments (floodplain fringe, seasonal floodways, and open forest and woodland vegetation communities) with the same MAP (~1,510 mm yr−1), near Madjedbebe in the Alligator Rivers region. The grey horizontal band demarcates the interquartile range of the δ13C values of modern P. spiralis from the Alligator Rivers region. Boxes show the interquartile range, the midline shows the median value, and the whiskers extend vertically 1.5 times the interquartile range from the end of the box to the furthest datum within that distance. Data beyond that distance are represented individually as points (‘outliers’). c, A linear relationship is observed between precipitation and δ13C values of P. spiralis with 95% confidence intervals (grey area) and 95% prediction intervals (dashed lines) when removing all sites affected by microclimate effects (blue dots with mean evaporation <5 mm per day). Error bars on data points indicate one standard deviation. Note that the modern δ13C value for P. spiralis collected near Madjedbebe (white dot) falls directly on our best-fit line (sample not used to generate this regression). RMSE, root-mean-square error. The data and R code for this figure are available from ref. . Panel a adapted with permission from ref. , Geoscience Australia.
Fig. 4
Fig. 4. Results of the archaeological isotope analysis.
a, δ13C values of archaeological P. spiralis endocarp, describing fluctuations in climate at Madjedbebe over the last 65,000 years. The vertical dotted lines demarcate the temporal boundaries of the different archaeological phases, based on the modelled mid-point value of the 95% confidence interval for the start and end date of each phase. The exception is Phase 7, where AMS radiocarbon mid-point ages for the analysed contexts are used (Supplementary Table 10). The grey horizontal band demarcates the interquartile range of the δ13C values of modern P. spiralis from near Madjedbebe. b, A close-up of δ13C values of archaeological and modern P. spiralis from Madjedbebe and its close surrounds over the last 700 years. The vertical dotted lines demarcate the temporal boundaries of the archaeological P. spiralis samples. The grey horizontal band demarcates the interquartile range of the δ13C values of modern P. spiralis from near Madjedbebe. Boxes show the interquartile range, the midline shows the median value, and the whiskers extend vertically 1.5 times the interquartile range from the end of the box to the furthest datum within that distance. Data beyond that distance are represented individually as points (‘outliers’). The data and R code for this figure are available from ref. .
Fig. 5
Fig. 5. Results of the isotope analysis of P. spiralis endocarp, compared to isotope analysis of soil, and stone artefact and exotic raw material discard by depth.
From left to right: soil profile; δ13C values of archaeological P. spiralis endocarp from Square C3 grouped by phase and displayed by mean depth of contexts; predicted MAP at Madjedbebe, based on the mean δ13C values of archaeological P. spiralis endocarp and the modern relationship between δ13C and MAP (Fig. 3c), with 95% confidence interval (grey area) and 95% prediction intervals (dashed lines); δ13C of archaeological soil organic matter samples from Square B2, taken at ~5-cm intervals and grouped by phase; number of lithic artefacts per litres floated for Squares E1 to B3 by depth; number of lithic artefacts produced from exotic raw materials per litres floated for Squares E1 to B3 by depth. Dashed lines on the second, fifth and sixth panels are locally estimated scatterplot smoothing (loess) curves. The data and R code for this figure are available from ref. . Soil profile in the left panel adapted with permission from ref. , Springer Nature Ltd.
Extended Data Fig. 1
Extended Data Fig. 1. Schematic of a drupe from a polydrupe or syncarpous Pandanus spp.
Note that portions of both the endocarp and the mesocarp are found archaeologically. Figure adapted from ref. , Springer Nature Ltd.
Extended Data Fig. 2
Extended Data Fig. 2. Results of the modern Pandanus spiralis charring experiment.
Compares the δ13C values of endocarp from the same trees prepared with different physical pre-treatment methods. There is a significant difference between the dried and charred δ13C values (One-way ANOVA, F = 2.81, df = 111, p = 0.043). This may be caused by the variation in chemical pre-treatment methods used (soxhlet extraction pre-treatment, rather than ABA pre-treatment, was used for the dried specimens; see Methods) or by the process of charring itself. However, there is little difference between the δ13C values of the charred specimens (One-way ANOVA, F = 0.12, df = 83, p = 0.883). This is despite the fact that one charring method occurred on an open fire, which reached temperatures > 1300 °C. Therefore, as the archaeological specimens are also charred and have been chemically pre-treated using the same method as the modern specimens, any change in δ13C through charring is not expected to affect the results.
Extended Data Fig. 3
Extended Data Fig. 3. Modern precipitation and evaporation data from Darwin, Pine Creek and Katherine.
a) Map of the Stuart Highway transect from Darwin to Katherine (white line), showing proximity to Madjedbebe; b) and c) Mean annual precipitation and daily evaporation data, respectively, from Darwin, Pine Creek and Katherine. Panel a adapted with permission from ref. , Geosciences Australia, and panel b and c adapted with permission from ref. , Bureau of Meteorology.

References

    1. Clarkson C, et al. Human occupation of northern Australia by 65,000 years ago. Nature. 2017;547:306–310. - PubMed
    1. Florin, S. A. et al. The first Australian plant foods at Madjedbebe, 65,000–53,000 years ago. Nat. Commun.10.1038/s41467-020-14723-0 (2020). - PMC - PubMed
    1. Nanson GC, Price DM, Short SA. Wetting and drying of Australia over the past 300 ka. Geology. 1992;20:791–794.
    1. Clark RL, Guppy JC. A transition from mangrove forest to freshwater wetland in the monsoon tropics of Australia. J. Biogeogr. 1988;15:665–684.
    1. Woodroffe CD, Thom BG, Chappell J. Development of widespread mangrove swamps in mid-Holocene times in northern Australia. Nature. 1985;317:711–713.

Publication types

LinkOut - more resources