. 2021 Mar;27(3):463-470.
doi: 10.1038/s41591-020-01214-4. Epub 2021 Jan 25.

Life expectancy and mortality in 363 cities of Latin America

Collaborators, Affiliations

Life expectancy and mortality in 363 cities of Latin America

Usama Bilal et al. Nat Med. 2021 Mar.

Abstract

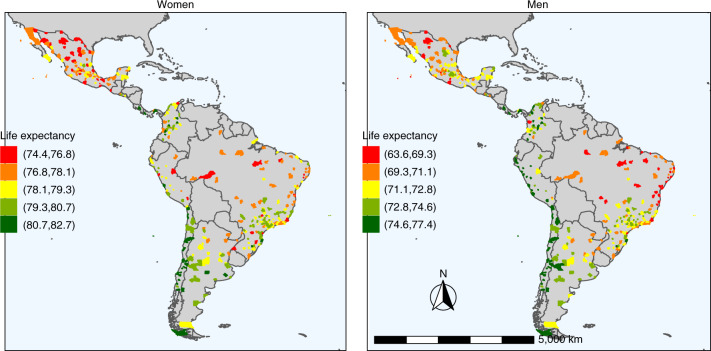
The concept of a so-called urban advantage in health ignores the possibility of heterogeneity in health outcomes across cities. Using a harmonized dataset from the SALURBAL project, we describe variability and predictors of life expectancy and proportionate mortality in 363 cities across nine Latin American countries. Life expectancy differed substantially across cities within the same country. Cause-specific mortality also varied across cities, with some causes of death (unintentional and violent injuries and deaths) showing large variation within countries, whereas other causes of death (communicable, maternal, neonatal and nutritional, cancer, cardiovascular disease and other noncommunicable diseases) varied substantially between countries. In multivariable mixed models, higher levels of education, water access and sanitation and less overcrowding were associated with longer life expectancy, a relatively lower proportion of communicable, maternal, neonatal and nutritional deaths and a higher proportion of deaths from cancer, cardiovascular disease and other noncommunicable diseases. These results highlight considerable heterogeneity in life expectancy and causes of death across cities of Latin America, revealing modifiable factors that could be amenable to urban policies aimed toward improving urban health in Latin America and more generally in other urban environments.


Conflict of interest statement

The authors declare no competing interests.

Figures

Fig. 1
Fig. 1. Variability in life expectancy at birth in 363 Latin American cities by country.
Central line represents the median (50th percentile) city life expectancy, box limits represent the 25th and 75th percentiles and whiskers represent 1.5× the extent of the interquartile range. AR, Argentina; BR, Brazil; CL, Chile; CO, Colombia; CR, Costa Rica; MX, Mexico; PA, Panama; PE, Peru; SV, El Salvador. Source data
Fig. 2
Fig. 2. Spatial distribution of life expectancy at birth by city in 363 Latin American cities.
The maps show life expectancy at birth for women (left) and men (right) in each city. The ranges (keys) are different for women and men. Source data
Fig. 3
Fig. 3. Variability in proportionate mortality in 363 Latin American cities by country.
Each column is a city, with each color representing the proportion of deaths due to each cause. Cities are grouped into countries. Countries are sorted by the overall proportion of violent deaths in the country and cities are sorted within country by the proportion of violent deaths in each city. Source data
Fig. 4
Fig. 4. Social environment index and proportionate mortality by five causes in 363 Latin American cities.
The range of the horizontal axis goes from the minimum to the maximum observed value of the social environment index. Ticks at the bottom of each plot represent observations (cities) with that value of the index. The white labels show proportionate mortality by each of the five causes by values of the social environment index (in five equal intervals).
Extended Data Fig. 1
Extended Data Fig. 1. Variability in Life Expectancy at Birth, Ages 20, 40 and 60, in 363 Latin American cities by Country.
Solid triangles represent the life expectancy at the country level for 2012–2016 (2010–2014 for El Salvador), as obtained from UNDP’s World Population Prospects (2019 version). The boxplot’s central line represents the median (50th percentile) city life expectancy, box limits represent the 25th and 75th percentiles, and whiskers represent 1.5 times the extent of the interquartile range. AR: Argentina, BR: Brazil, CL: Chile, CO: Colombia, CR: Costa Rica, MX: Mexico, PA: Panama, PE: Peru, SV: El Salvador. Source data
Extended Data Fig. 2
Extended Data Fig. 2. Life expectancy at birth in 363 Latin American cities and reference lines for 2012–2016 life expectancy by income group.
Dashed lines represent life expectancy for World Bank income groups for 2012–2016, obtained from UNDP’s World Population Prospects (2019 version). Points represent life expectancy at birth in each city and error bars represent the 95% credible intervals of life expectancy at birth in each city. Source data
Extended Data Fig. 3
Extended Data Fig. 3. Results of the multivariable model with life expectancy at birth, 20, 40 and 60 years of age in 363 Latin American cities.
Shown are regression coefficients and 95% confidence intervals. Horizontal dashed line represents the null effect. Source data
Extended Data Fig. 4
Extended Data Fig. 4. Results of secondary analysis using city growth in the 5 years previous to study period (instead of concurrent), in 363 Latin American cities.
Shown are regression coefficients and 95% confidence intervals. Horizontal dashed line represents the null effect. Source data
Extended Data Fig. 5
Extended Data Fig. 5. Variability in Proportionate Mortality in 363 Latin American Cities.
Each dot represents a city. Source data
Extended Data Fig. 6
Extended Data Fig. 6. Age-adjusted proportionate mortality by city in 363 cities of 9 Latin American countries.
Each column is a city, with each color representing the proportion of deaths due to each cause. Cities are grouped in countries. Countries are sorted by the overall proportion of violent deaths in the country, and cities are sorted within country by the proportion of violent deaths in each city. CVD and other NCDs: cardiovascular diseases and other non-communicable diseases. Source data
Extended Data Fig. 7
Spatial distribution of proportionate mortality in 363 Latin American cities. Source data
Extended Data Fig. 8
Extended Data Fig. 8. Predictors Proportionate Mortality by 5 causes in 363 Latin American Cities.
The range of the horizontal axis goes from the minimum to the maximum observed value of each indicator. Ticks at the bottom of each plot represent observations (cities) with that value of each indicator. The white labels show proportionate mortality by each of the 5 causes by values of each indicator in 5 equal intervals. CVD and other NCDs: cardiovascular diseases and other non-communicable diseases.
Extended Data Fig. 9
Extended Data Fig. 9. Predictors of Age-Adjusted Proportionate Mortality by 5 causes in 363 Latin American Cities.
The range of the horizontal axis goes from the minimum to the maximum observed value of each indicator. Ticks at the bottom of each plot represent observations (cities) with that value of each indicator. The white labels show proportionate mortality by each of the 5 causes by values of each indicator in 5 equal intervals. CVD and other NCDs: cardiovascular diseases and other non-communicable diseases.
Extended Data Fig. 10
Extended Data Fig. 10. Rate Ratio for each group of causes of death (compared to CVD/Other NCDs) associated with a 1SD increase in city-level factors for six different levels of adjustment in 363 Latin American cities.
Coefficients are Rate Ratios (As compared to CVD/NCDs), and error bars are their corresponding and 95% CIs, per standard deviation increase in each variable (except for city size, where they correspond to a 50% larger city). Univariable model contains each variable in a different model, adjusted for % built-up (see methods). Univariable models adjusted for age contain a covariable for % under 15 and % above 65, and univariable models adjusted for mortality contain a covariable for all-cause age-adjusted mortality rate. Multivariable models contain all predictors in the same model. The model restricted by % ill-defined deaths restricts the analysis to cities with <13% ill-defined deaths (90th percentile). Source data

Comment in

References

    1. UNDP Population Division. World Urbanization Prospects: The 2018 Revisionhttps://population.un.org/wup/ (2018).
    1. UN-HABITAT. Urbanization and Development: Emerging Futures; World Cities Report 2016 (UN-HABITAT, 2016).
    1. Fagliano JA, Diez-Roux AV. Climate change, urban health, and the promotion of health equity. PLoS Med. 2018;15:e1002621. doi: 10.1371/journal.pmed.1002621. - DOI - PMC - PubMed
    1. Whitmee S, et al. Safeguarding human health in the Anthropocene epoch: report of the Rockefeller Foundation–Lancet commission on planetary health. Lancet. 2015;386:1973–2028. doi: 10.1016/S0140-6736(15)60901-1. - DOI - PubMed
    1. Rydin Y, et al. Shaping cities for health: complexity and the planning of urban environments in the 21st century. Lancet. 2012;379:2079–2108. doi: 10.1016/S0140-6736(12)60435-8. - DOI - PMC - PubMed

Publication types