. 2021 Feb;27(2):289-300.
doi: 10.1038/s41591-020-01212-6. Epub 2021 Jan 25.

Opposing immune and genetic mechanisms shape oncogenic programs in synovial sarcoma

Affiliations

Opposing immune and genetic mechanisms shape oncogenic programs in synovial sarcoma

Livnat Jerby-Arnon et al. Nat Med. 2021 Feb.

Abstract

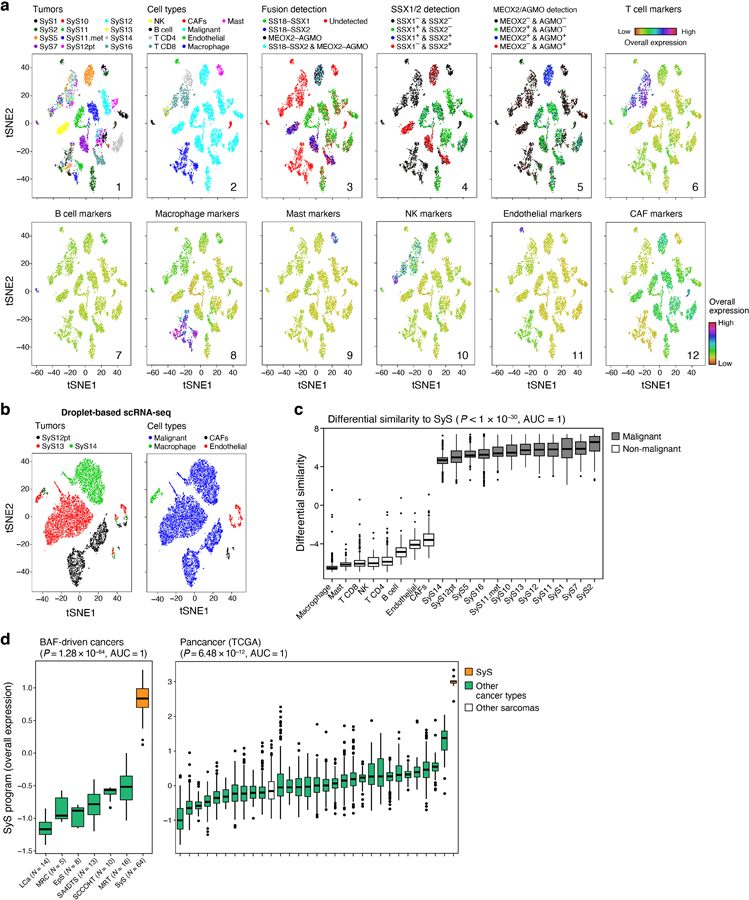
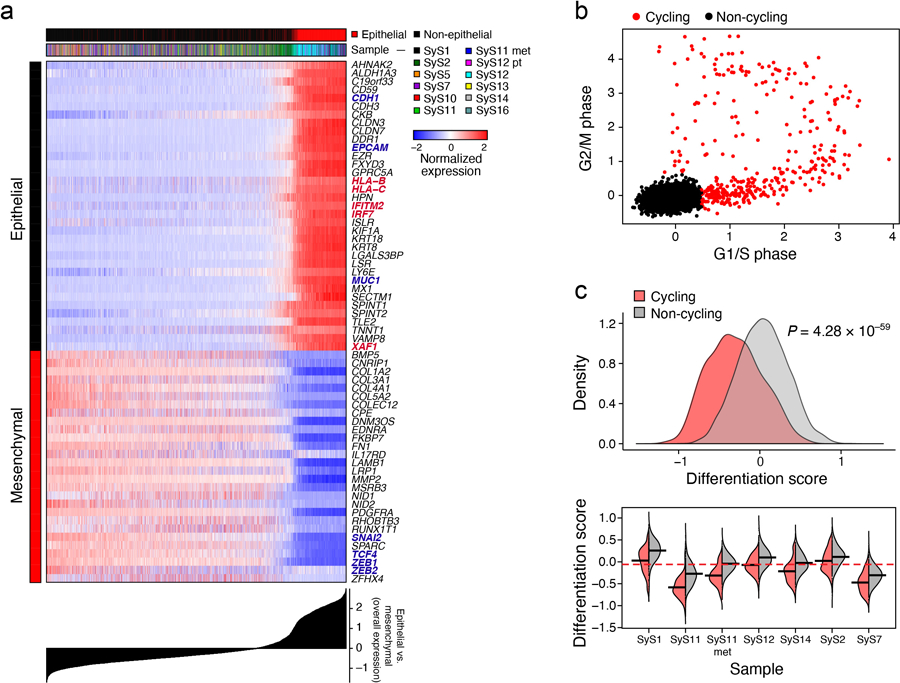
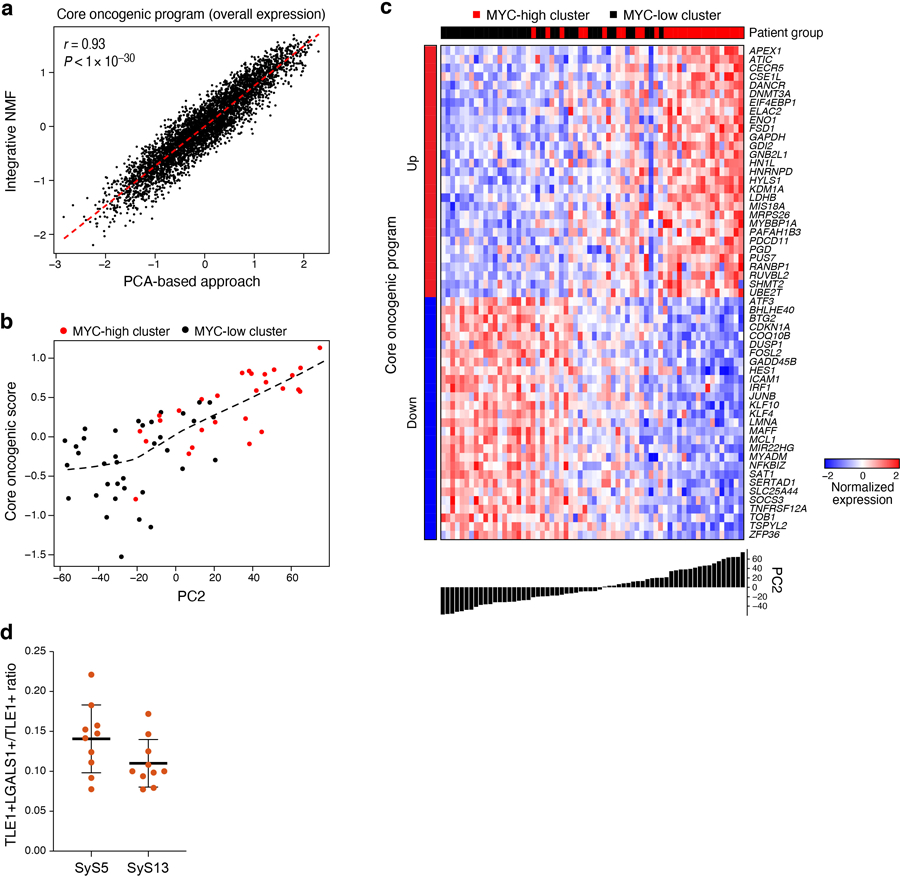
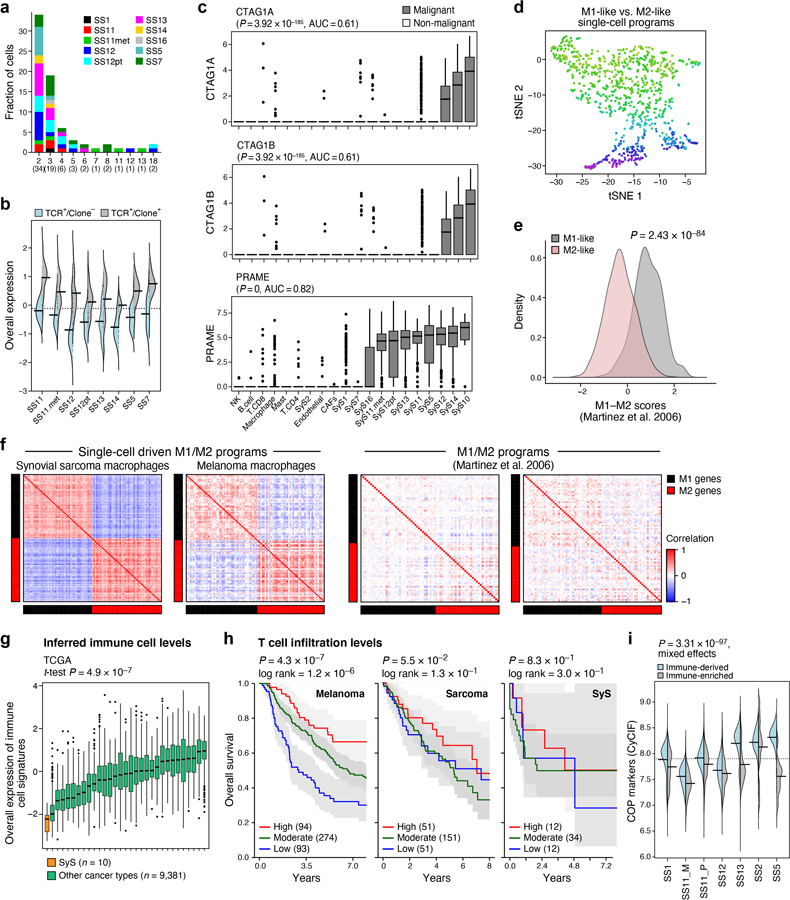
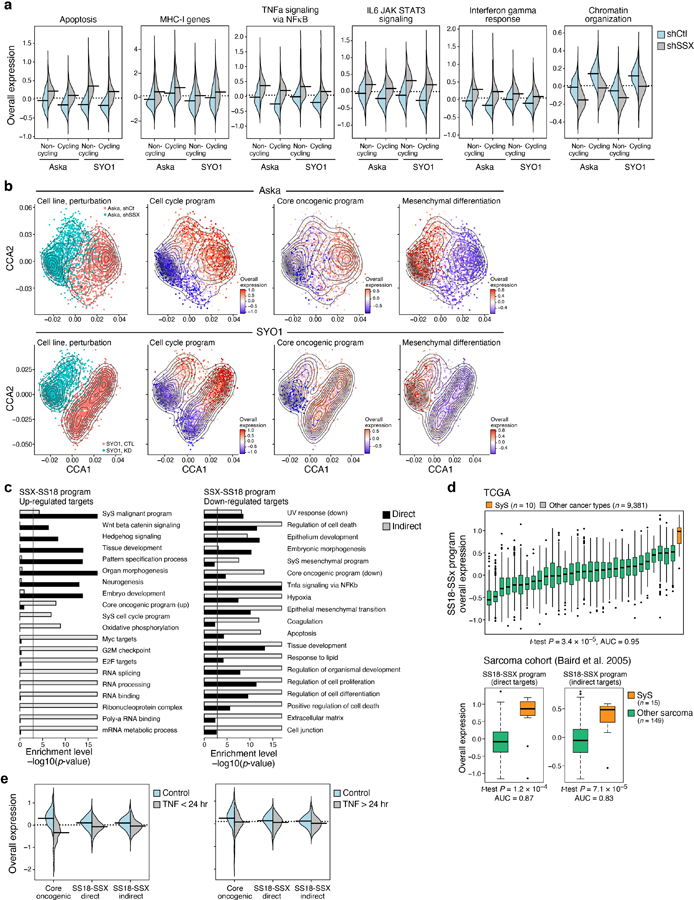
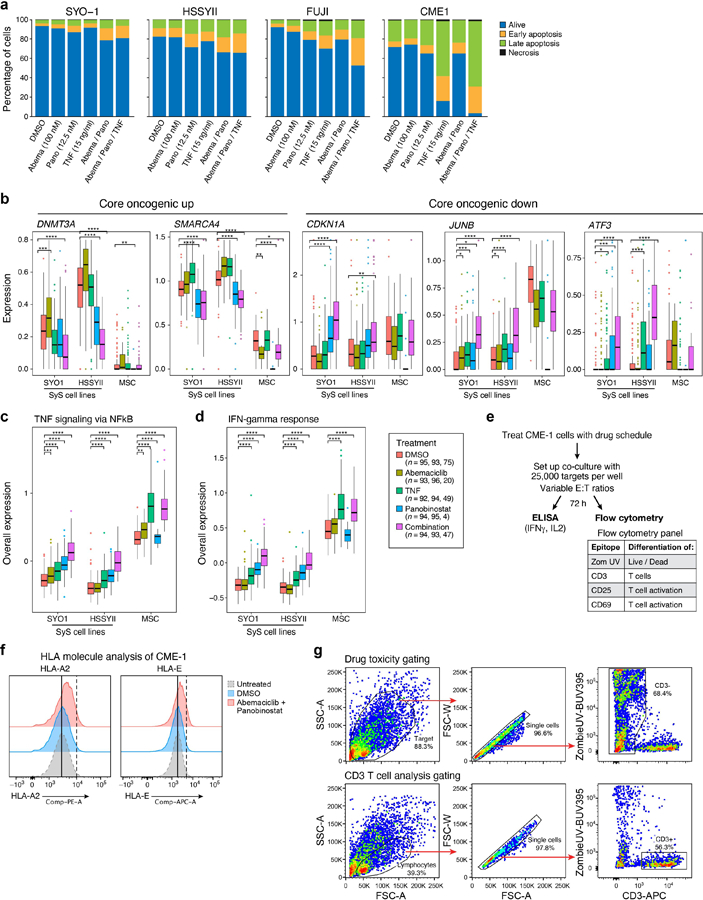
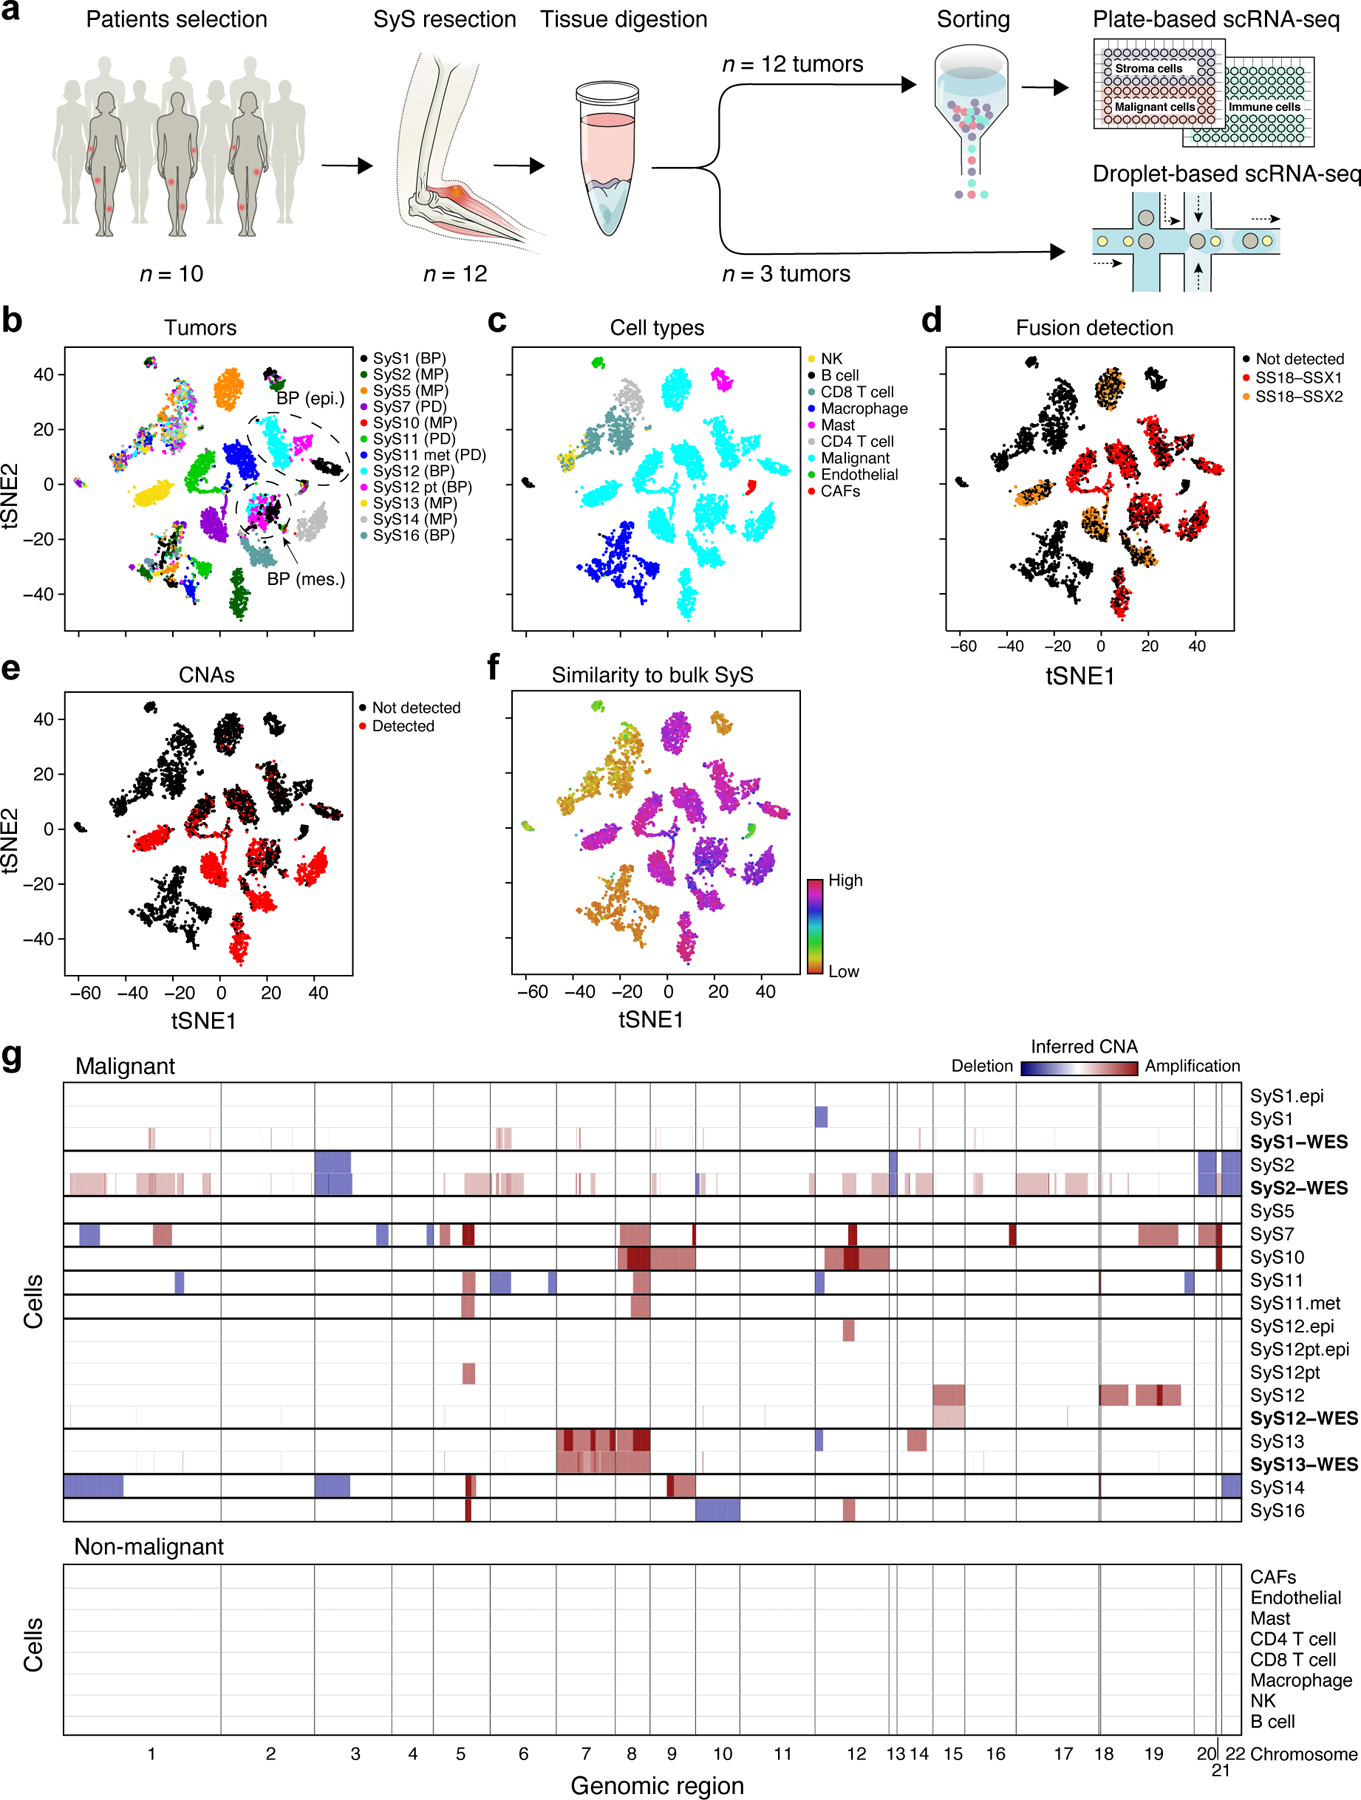
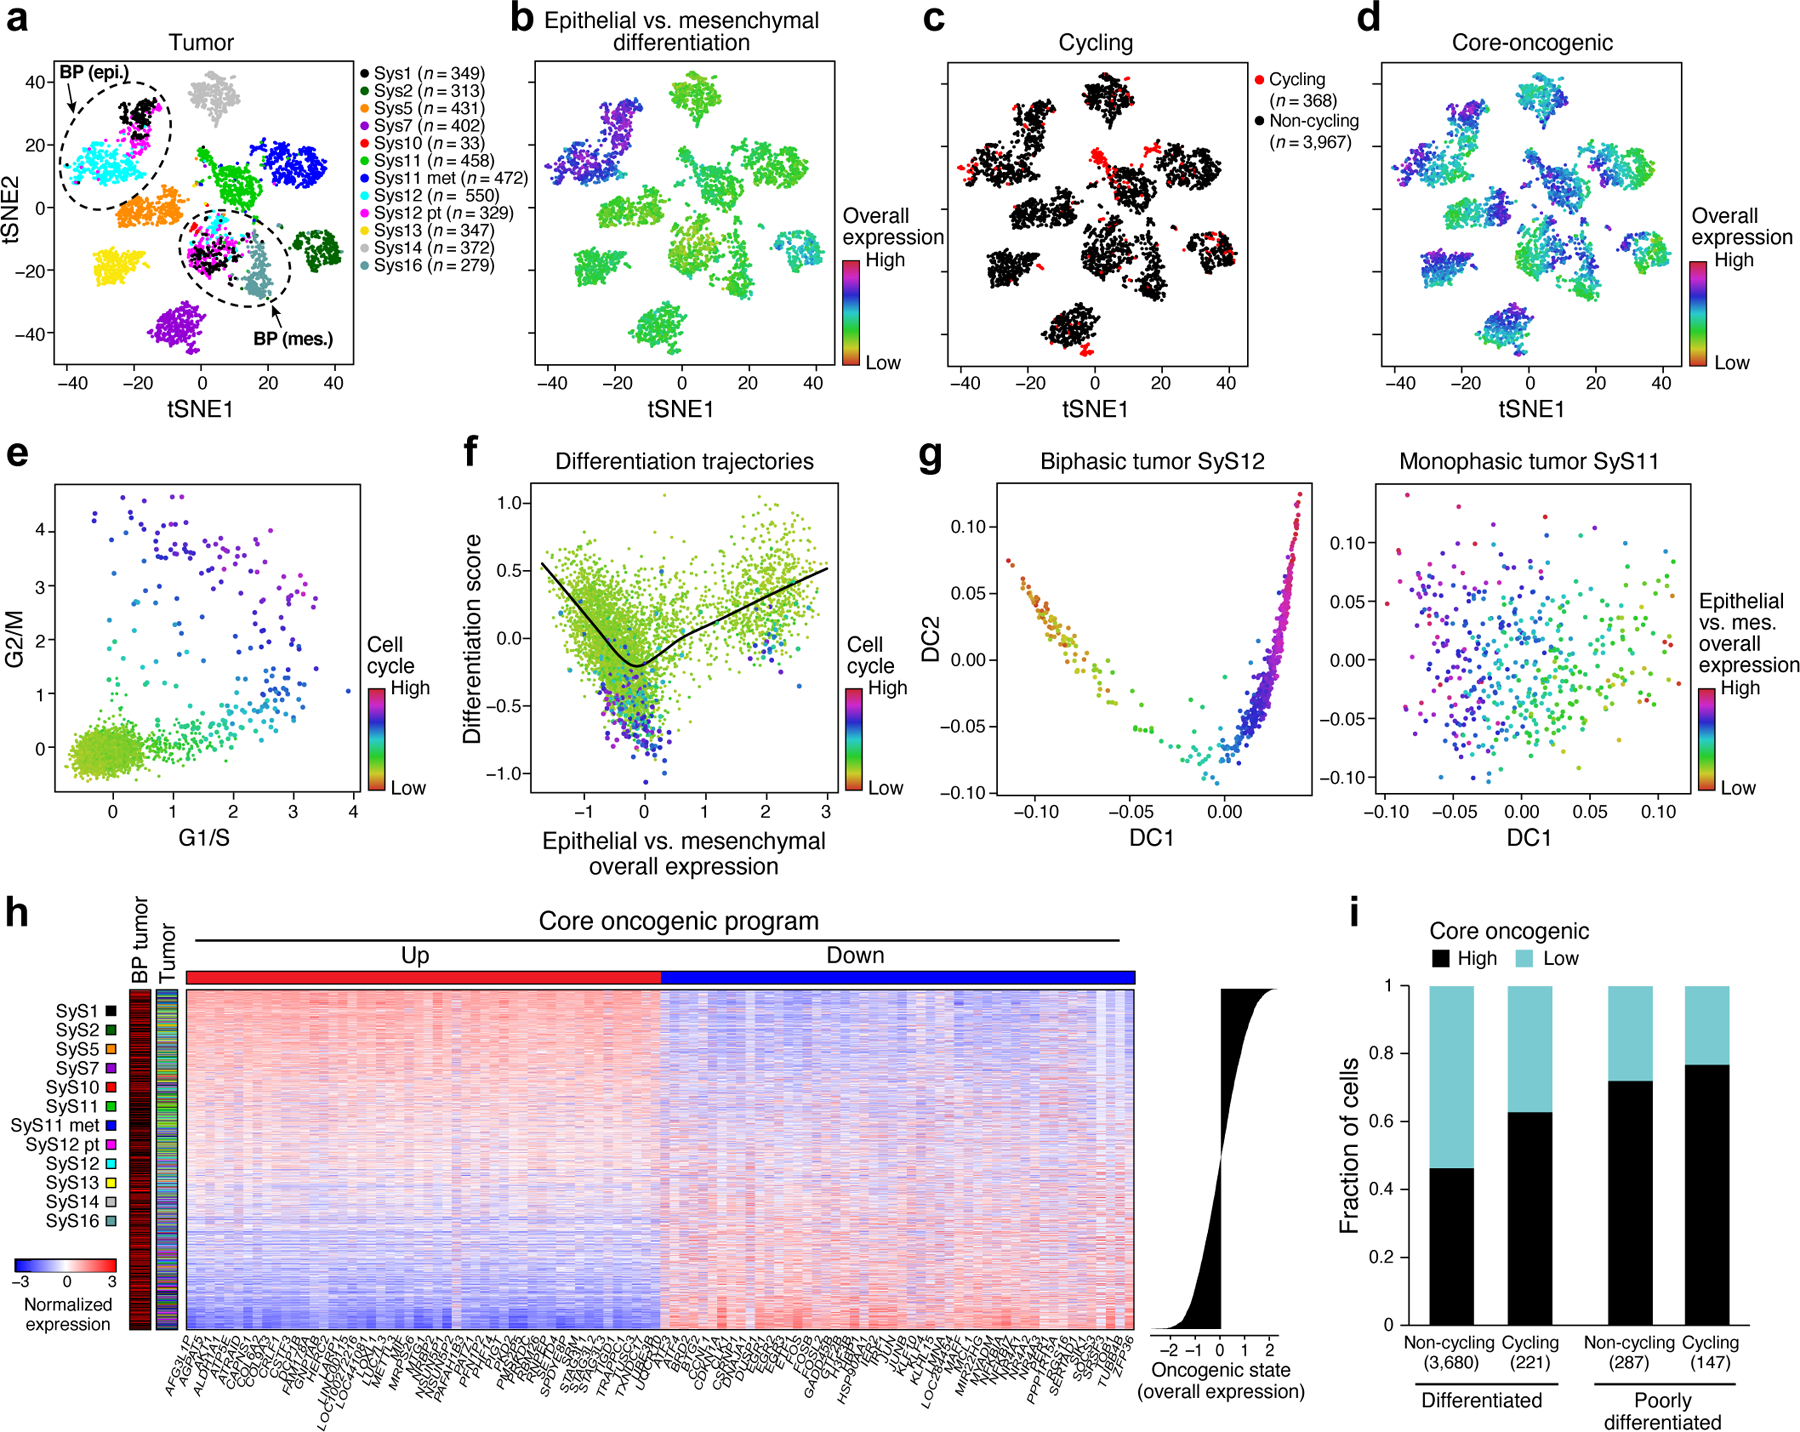
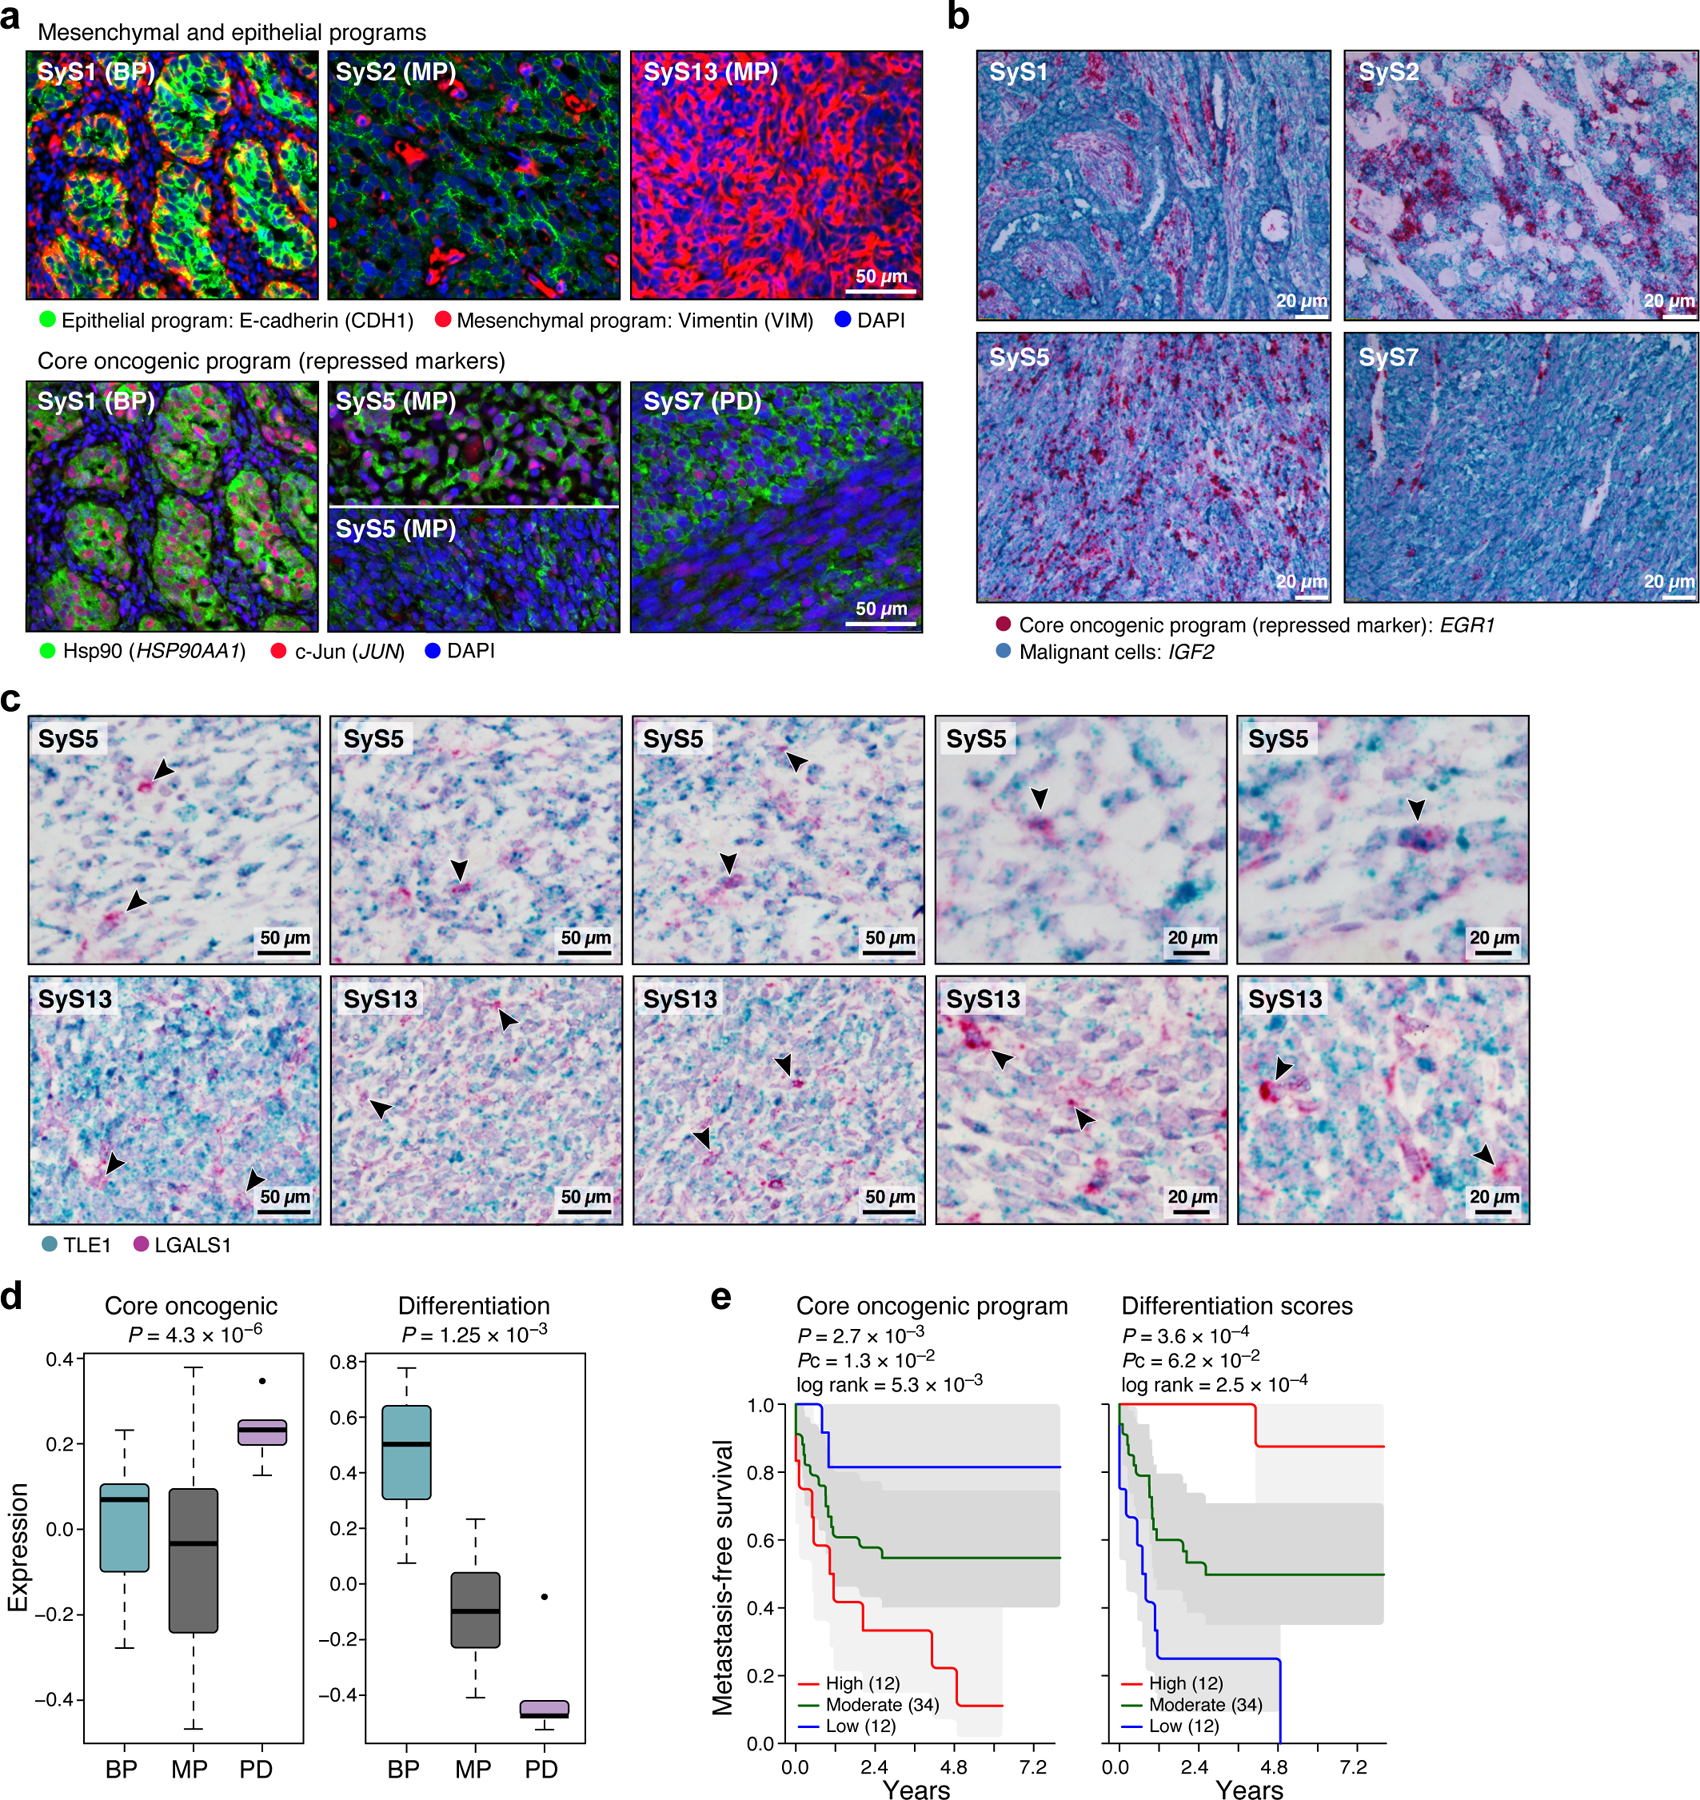
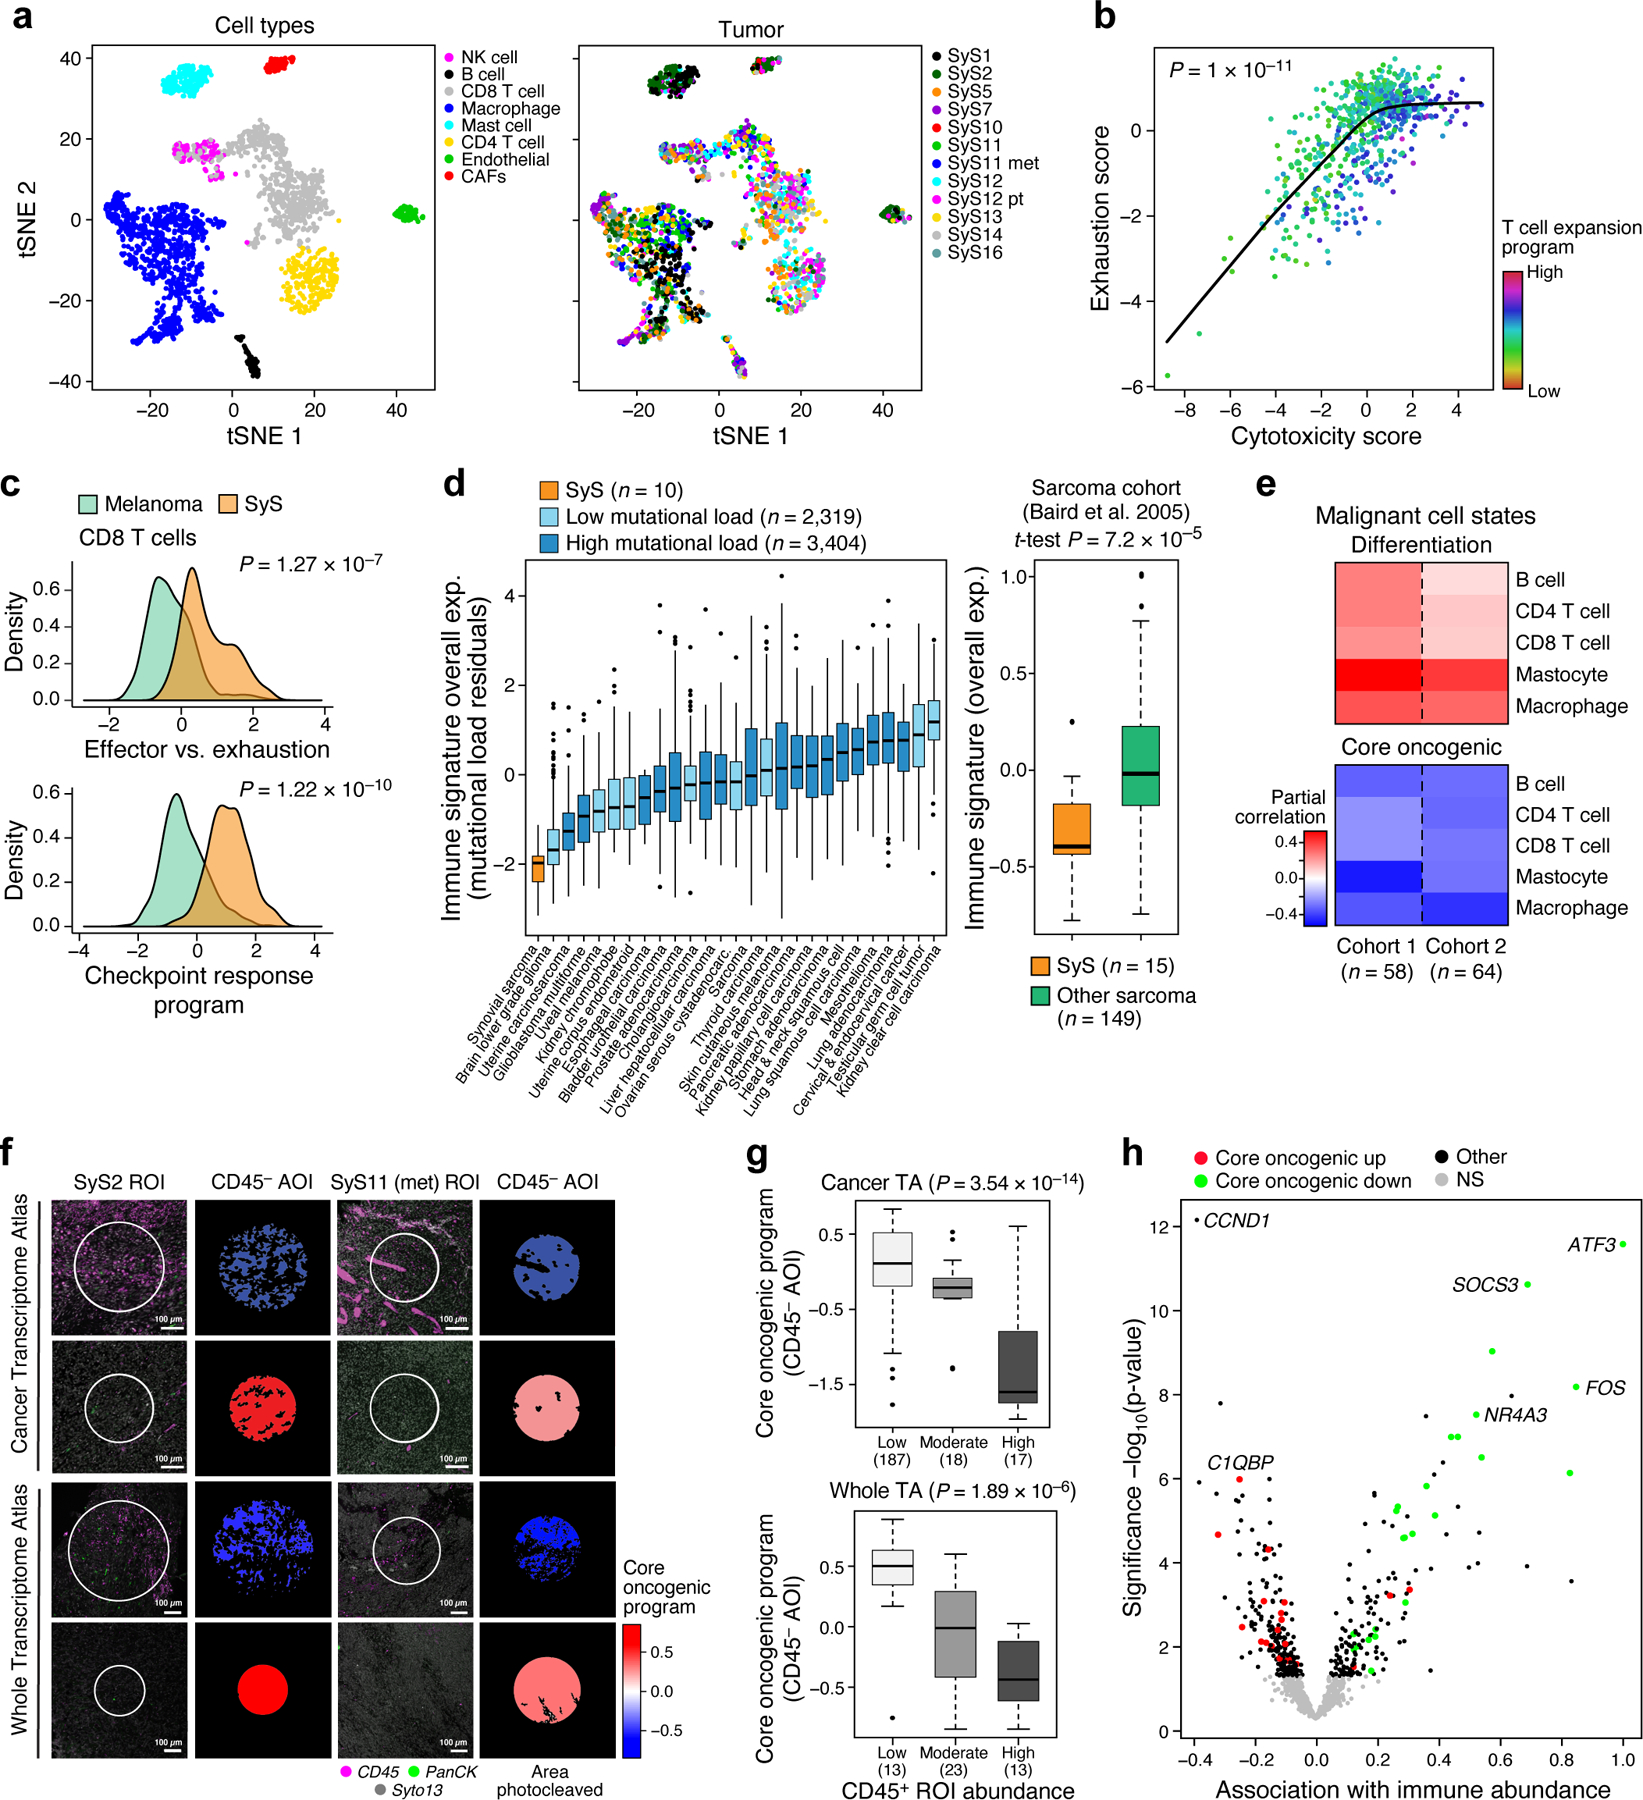
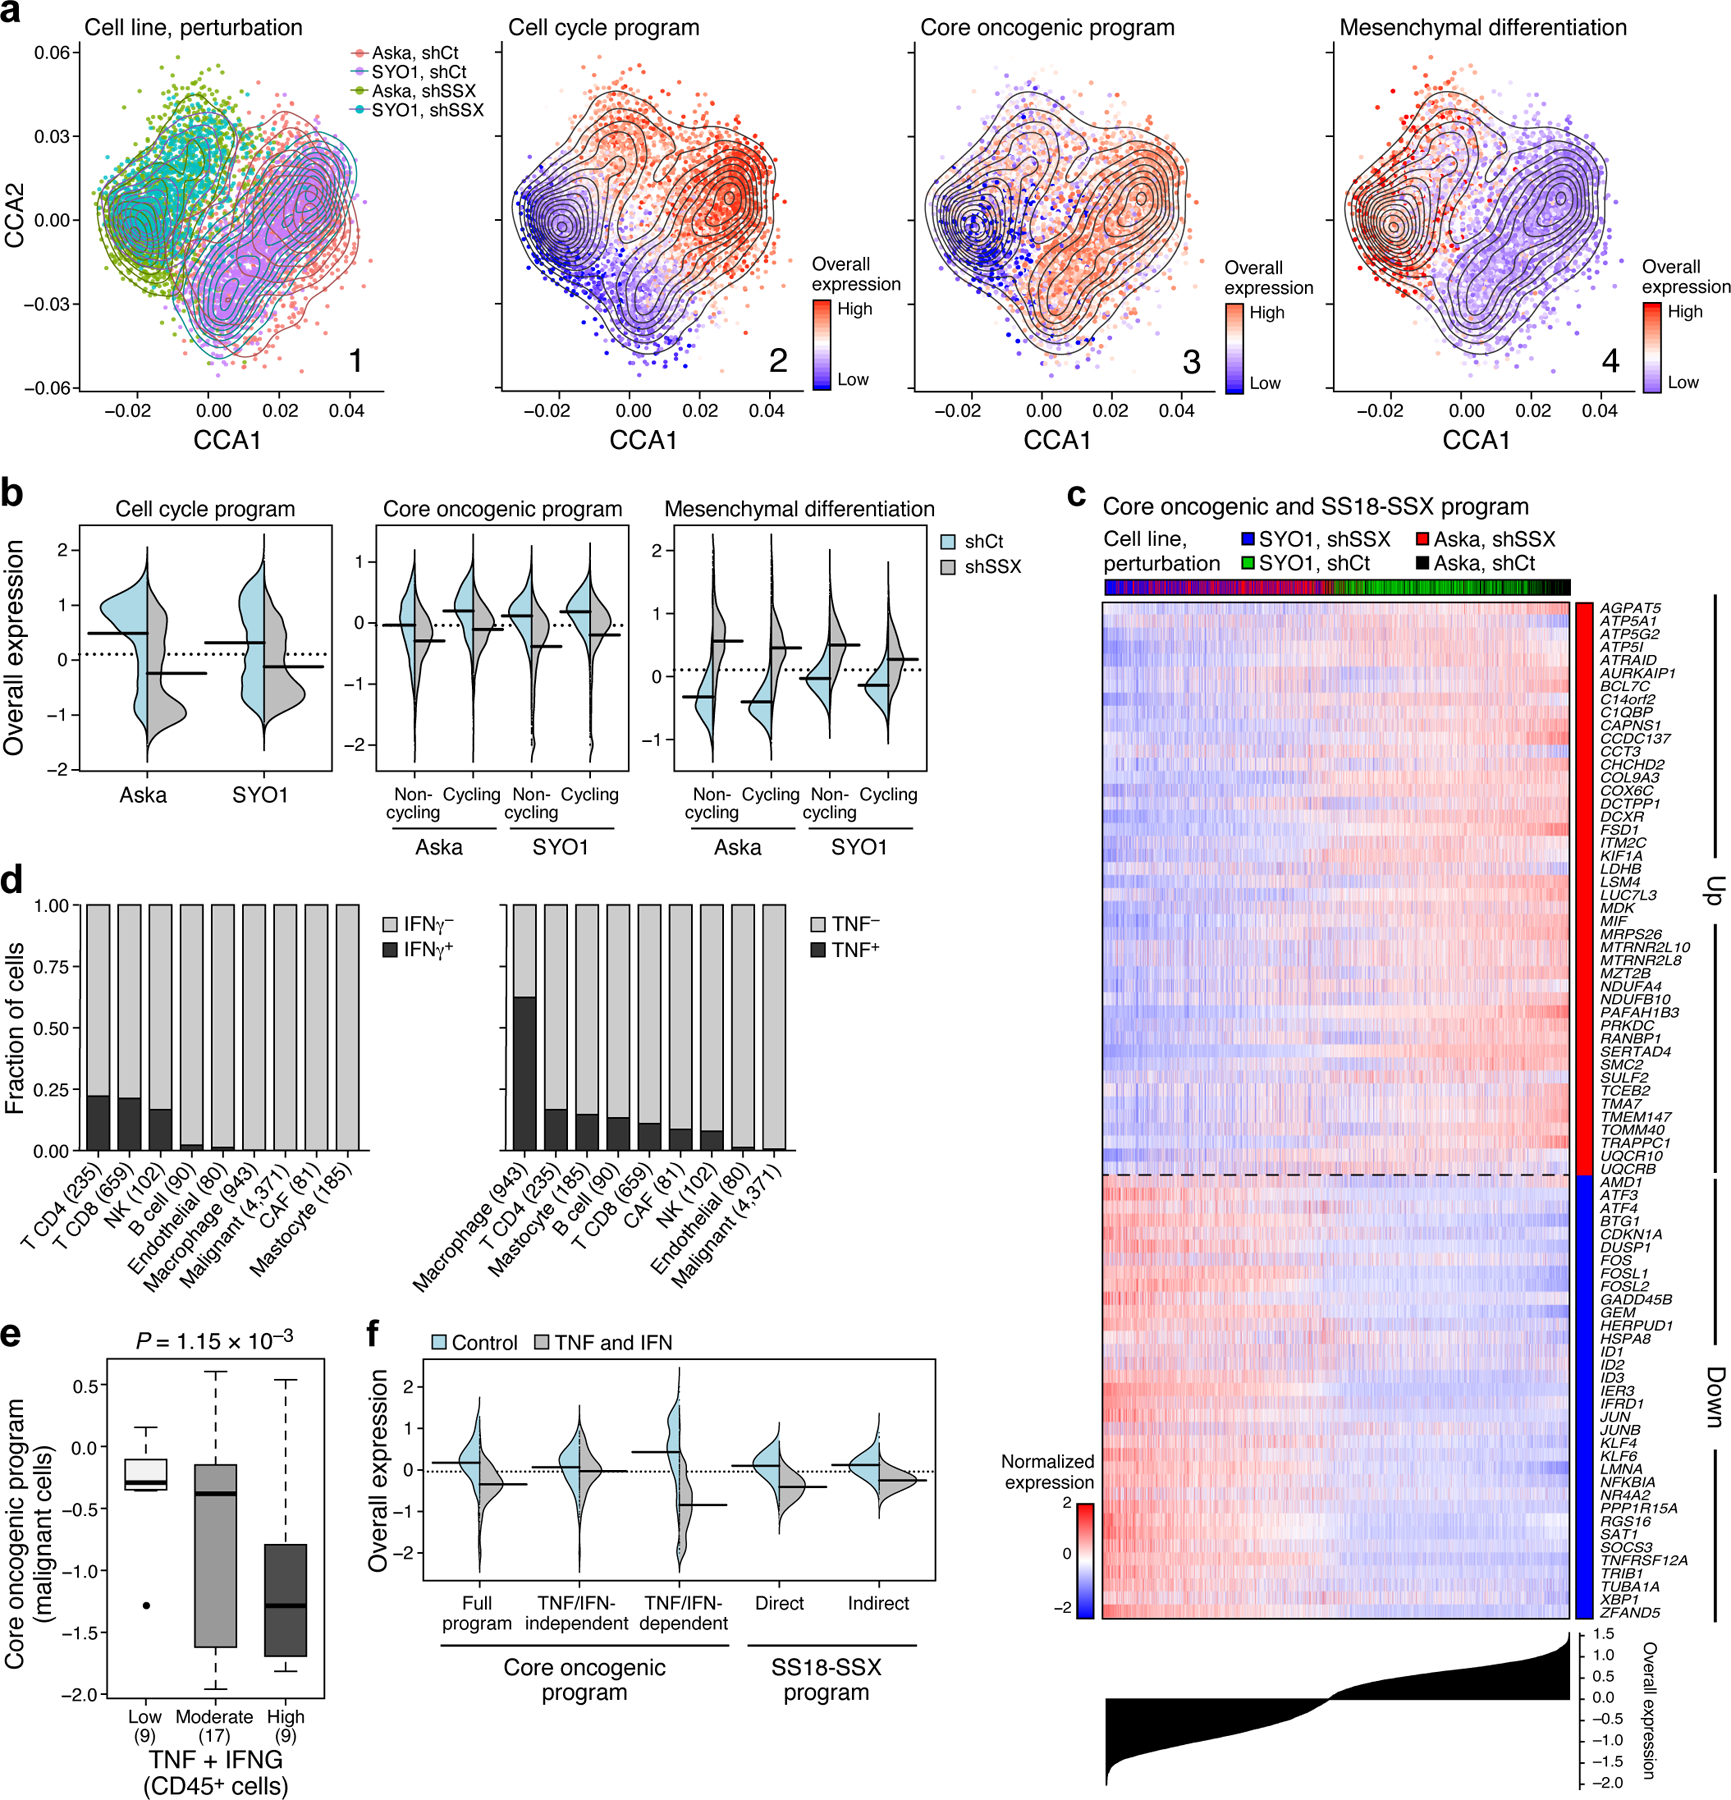
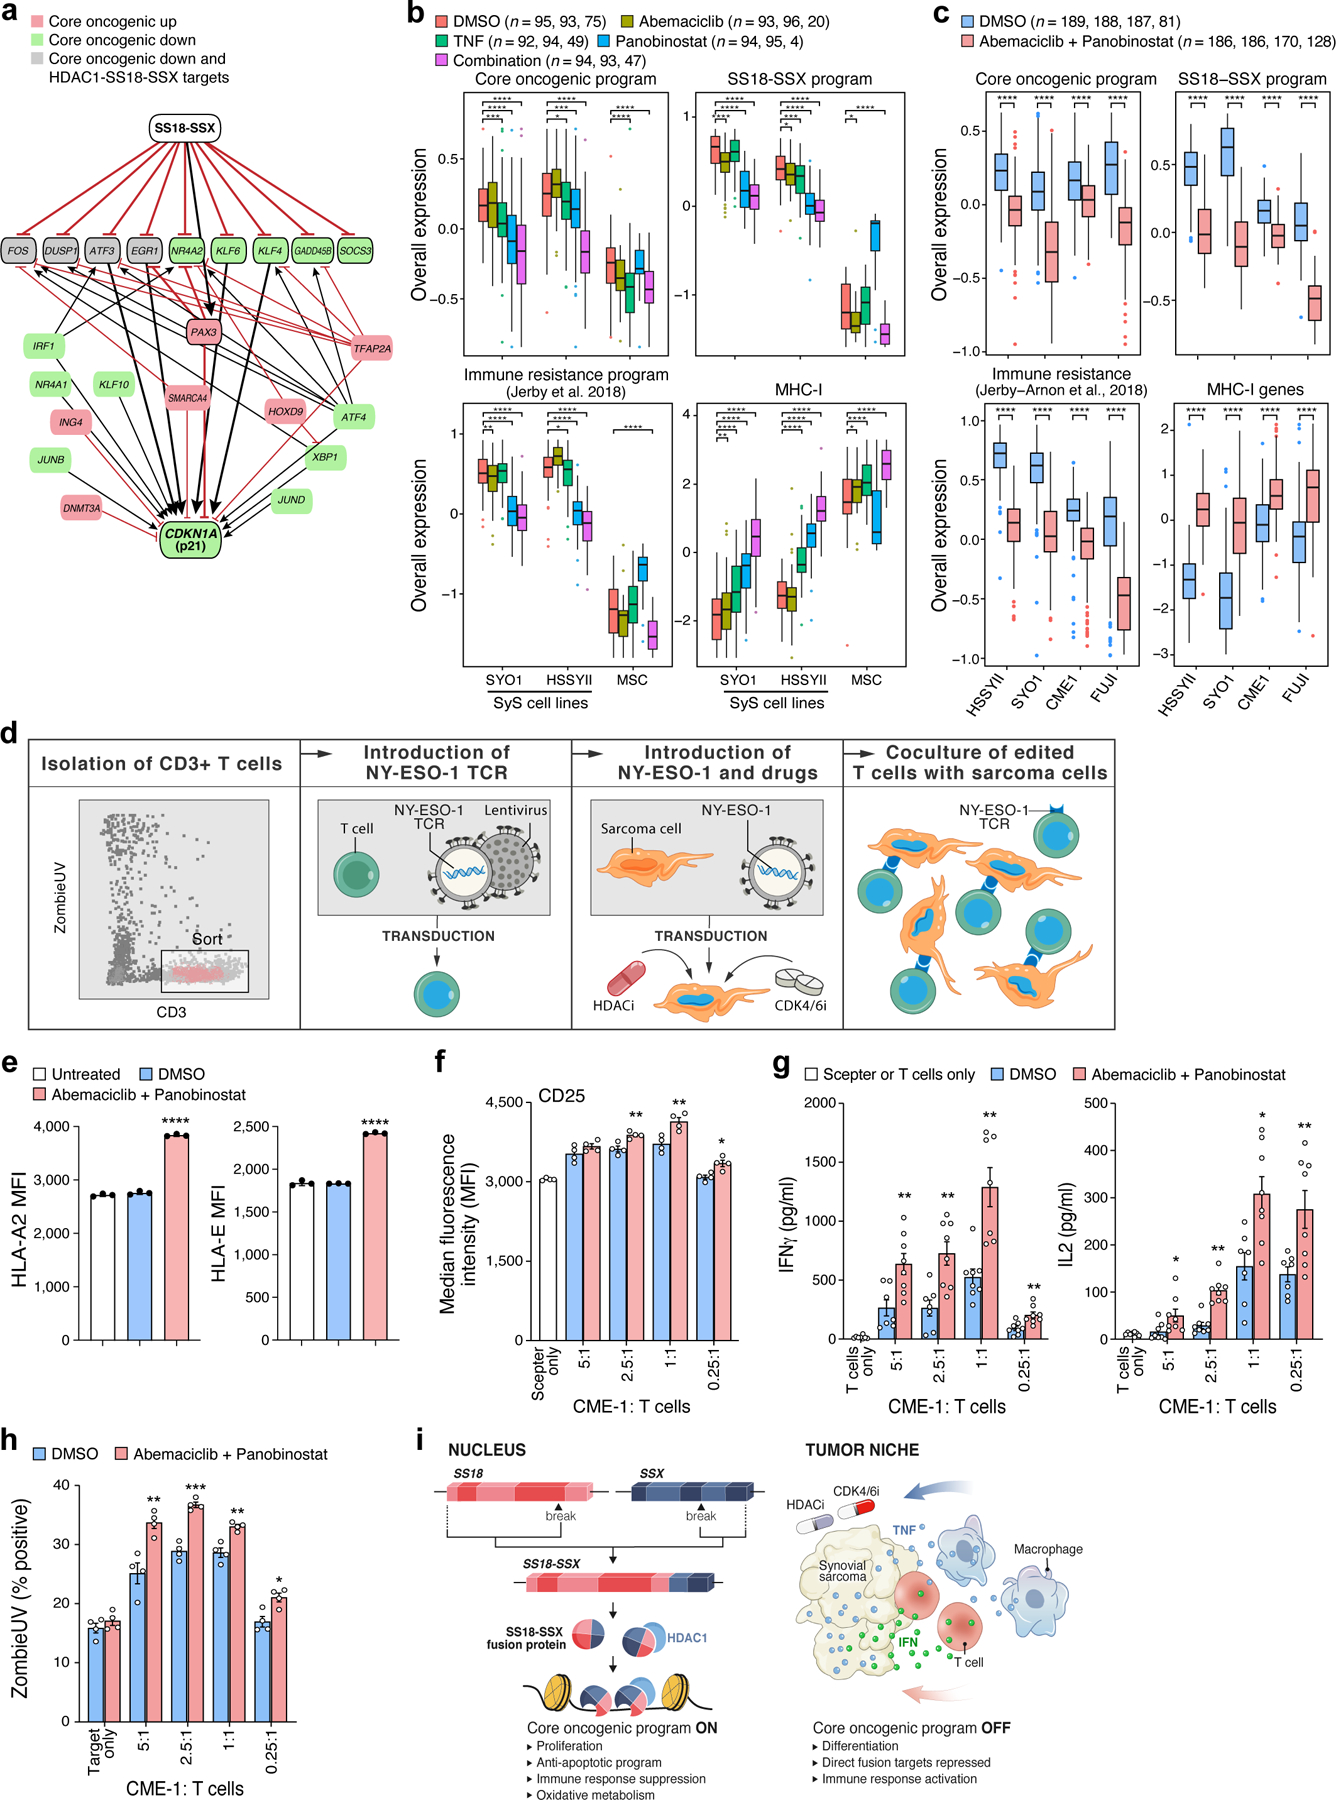
Synovial sarcoma (SyS) is an aggressive neoplasm driven by the SS18-SSX fusion, and is characterized by low T cell infiltration. Here, we studied the cancer-immune interplay in SyS using an integrative approach that combines single-cell RNA sequencing (scRNA-seq), spatial profiling and genetic and pharmacological perturbations. scRNA-seq of 16,872 cells from 12 human SyS tumors uncovered a malignant subpopulation that marks immune-deprived niches in situ and is predictive of poor clinical outcomes in two independent cohorts. Functional analyses revealed that this malignant cell state is controlled by the SS18-SSX fusion, is repressed by cytokines secreted by macrophages and T cells, and can be synergistically targeted with a combination of HDAC and CDK4/CDK6 inhibitors. This drug combination enhanced malignant-cell immunogenicity in SyS models, leading to induced T cell reactivity and T cell-mediated killing. Our study provides a blueprint for investigating heterogeneity in fusion-driven malignancies and demonstrates an interplay between immune evasion and oncogenic processes that can be co-targeted in SyS and potentially in other malignancies.


Conflict of interest statement

COMPETING INTERESTS STATEMENT

Av.R. is a founder of and equity holder in Celsius Therapeutics, an equity holder in Immunitas Therapeutics, and was a scientific advisory board member for ThermoFisher Scientific, Syros Pharmaceuticals and Neogene Therapeutics until August 1, 2020. From August 1, 2020, Av.R. is an employee of Genentech. M.L.S. is an equity holder, scientific co-founder and advisory board member of Immunitas Therapeutics. K.W.W. serves on the scientific advisory board of TCR2 Therapeutics, T-Scan Therapeutics, SQZ Biotech, Nextechinvest and receives sponsored research funding from Novartis. He is a co-founder of Immunitas Therapeutics. L.J.A, N.R., M.L.S. and Av.R. are co-inventors on US patent application filed by the Broad Institute relating to synovial sarcoma. O.R.-R. is an employee of Genentech and a co-inventor on patent applications filed by the Broad Institute for inventions relating to single cell genomics, such as in PCT/US2018/060860 and US provisional application no. 62/745,259. D.R.Z., N.O., and J.M.B. are employees of Nanostring which developed GeoMx. C.K. is the scientific founder, fiduciary Board of Directors member, Scientific Advisory Board member, shareholder, and consultant for Foghorn Therapeutics. E.C. reports support paid to his institution for the conduct of clinical trials from Amgen, Astra Zeneca, Novartis, Bayer, Merck, Exelixis, GSK, Adaptimmune, and Iterion. G.M.C. reports Advisory Board fees and support paid to his institution for the conduct of clinical trials from Agios, Epizyme, PharmaMar, Eisai; support paid to his institution for the conduct of clinical trials from Macrogenics, Boston Biomedical, Plexxicon, Merck KGaA / EMD Serono Research and Development Institute, CBA, SpringWorks Therapeutics, Bavarian-Nordic; compound for preclinical research and support paid to his institution for the conduct of clinical trials from Bayer. P.K.S. is a member of the SAB or Board of Directors of Applied Biomath, Glencoe Software and RareCyte and has equity in these companies. In the last five years the Sorger lab has received research funding from Novartis and Merck. The authors declare that these activities are not related to the research reported in this publication and have not influenced the conclusions in this manuscript. B.I. is a consultant for Merck and Volastra Therapeutics. N.W. is an equity holder and scientific advisory board member of Relay Therapeutics, a paid advisor to Eli Lilly and Co, and receives grant support from Puma Biotechnology. N.D.M. serves as a scientific advisor to Immunitas Therapeutics. C.N., M.E.S., H.R.W, M.J.M, B.H., B.I, A.V, G.B., L.C., A.R.Ri, L.C.B., J.M.G., C.C.L, R.M., L.N., S.M., J.C.M., C.G., O.C., J.E.B., A.S., M.S., M.S.C, D.L., S.G., G. P.N., I.C., T.N.N, M.M., E.C., I.L., S.C., A.B.H., J.T.M., I.S., and M.N.R declare no competing interests.

Figures

Extended Data Fig. 1.
Extended Data Fig. 1.. Consistent classification of cells based on expression and genetic features.
(a) Converging assignments of cell identity. tSNE of single-cell profiles (dots), colored by (1) tumor sample, (2) inferred cell type, (3) SS18-SSX1/2 and MEOX2-AGMO fusion detection, (4) SSX1/2 gene detection (mRNA level > 0), (5) MEOX2 and AGMO gene detection (mRNA level > 0), (6–12) overall expression of well-established cell type markers (Supplementary Table 2). (b) Droplet based scRNA-Seq of SyS. tSNE of single cells (dots), profiled with droplet-based scRNA-seq, colored according to tumor sample (left) and inferred cell type (right). (c) Differential similarity to SyS compared to other sarcomas (Online Methods) distinguishes malignant (n = 4,371) from non-malignant (n = 2,375) cells. Differential similarity (y axis) to SyS shown for cells in each cell subset (x axis). (d) The SyS program distinguishes between SyS and non-SyS cancer types. Distribution of the SyS program Overall Expression (y axis) across BAF driven tumors (left, x axis) and in TCGA (right, x axis; n = 9,128; 253; and 10, for other, sarcoma, and SyS tumors). In (c-d) middle line: median; box edges: 25th and 75th percentiles, whiskers: most extreme points that do not exceed ±IQR*1.5; further outliers are marked individually; P-values: one-sided Wilcoxon-ranksum test; AUC: Area Under the receiver operating characteristic Curve.
Extended Data Fig. 2.
Extended Data Fig. 2.. Characterizing mesenchymal, epithelial and poorly differentiates malignant cells.
(a) Epithelial and mesenchymal program genes. The expression of the top epithelial and mesenchymal program genes (rows) across the malignant cells (columns), with cells sorted according to the difference in epithelial vs. mesenchymal OE scores (bottom plot). Topmost Color bar: epithelial vs. non-epithelial cell status, and sample. Canonical markers and immune-related genes are in red and blue, respectively. (b) Cell cycle signature. Overall Expression of the G2/M (y axis) and G1/S (x axis) phase signatures in each malignant cell, colored by their cycling status. (c) Cycling cells are less differentiated. The distribution of differentiation scores of cycling (red) and non-cycling (grey) malignant cells, across all tumors (top) and within each tumor (bottom; only tumors with at least 10 cycling cells are shown); p-value: mixed-effects test.
Extended Data Fig. 3.
Extended Data Fig. 3.. The core oncogenic program is detected using different approaches and datasets.
(a) Agreement between the core oncogenic program detected by a PCA and an iNMF approach. Overall Expression (OE) of the core oncogenic program across malignant SyS cells, as identified in the PCA-based approach (x axis) and in the integrative-NMF approach (y axis) (Online Methods). (b-c) Program Overall Expression captures inter-tumor variation and the MYC-high cluster in 64 SyS tumors from an independent RNA-Seq cohort. The tumors were previously classified into two transcriptionally distinct clusters, denoted here as MYC-high and MYC-low. (b) For each tumor (dots), shown is the Overall Expression (OE) of the core oncogenic program (y axis) vs. the projection on the second Principle Component (PC2) of the data. (c) Normalized expression (centered log-transformed RPKM) of the core oncogenic program genes (columns) most correlated with PC2 across the tumors (columns). Tumors are sorted by their PC2 projection (bottom bar). (d) The fraction of TLE1+LGALS1+ cells out of TLE1+ ones based on ISH of tumors SyS5 and SyS13; Data are presented as mean values +/− SD, such that each dot corresponds to one high power field (HPF), with a total of 10 HPF per sample; TLE1 is a SyS cell marker and LGALS1 is a positive marker of the core oncogenic program.
Extended Data Fig. 4.
Extended Data Fig. 4.. Antitumor immunity and immune evasion in SyS.
(a) CD8 T cell clones, stratified based on clone size (x axis) and tumor (color). (b) Overall expression of the T cell expansion program in CD8 T cells with a reconstructed TCR (TCR+), when stratified based on clonality (Clone+ and Clone, denoting clone size greater or equal to 1, respectively). (c) The cancer testis antigens CTAG1A, CTAG1B (encoding for NY-ESO-1), and PRAME are exclusively expressed by SyS malignant (n = 4,371) cells compared to non-malignant ones (n = 2,375). Log-transformed TPM (y axis) in different cell subsets (x axis); p-values: one-sided Mann-Whitney test. (d) tSNE of macrophage profiles, colored by M1/M2 polarization scores, according to signatures defined here (Supplementary Table 4). (e) M1/M2 polarization scores (y axis) according to previously defined signatures in macrophages in our datasets partitioned to M1-like and M2-like subgroups (p-value: two-sided t-test). (f) Spearman correlation coefficient (color bar) between each pair of genes from M1 and M2 signatures defined here (top, Supplementary Table 4) or previously (bottom) across macrophages in SyS (left) and melanoma (right). (g) Overall Expression of the immune cell signatures (y axis, Online Methods) in SyS tumors (orange) and other cancer types (green); p-value: one-sided t-test. (c) and (g) middle line: median; box edges: 25th and 75th percentiles, whiskers: most extreme points that do not exceed ±IQR*1.5; further outliers are marked individually. (h) Prognostic value of T cell levels in different tumor types. Kaplan-Meier (KM) curves of survival in melanoma (left; TCGA), sarcoma (middle), and SyS (8) (right), stratified by high (top 25%, red), low (bottom 25%, blue), or intermediate (remainder, green) levels of inferred T cell infiltration levels; P: COX regression. (i) Protein expression (CyCIF) of core oncogenic program markers in immune-enriched and deprived niches.
Extended Data Fig. 5.
Extended Data Fig. 5.. Characterizing the transcriptional impact of SS18-SSX inhibition and tumor microenvironment cytokines on synovial sarcoma cells.
(a) The fusion KD induces innate immune programs. Distribution of Overall Expression scores (y axis) in the pathways most differentially expressed between SyS cells with SS18-SSX (shSSX, grey) vs. control (shCt, blue) shRNA, shown separately for non-cycling and cycling cells (x axis). (b) Co-embedding (using PCA and canonical correlation analyses, Online Methods) of Aska (top) and SYO1 (bottom) cell profiles (dots), colored by: (1) perturbation; or the Overall Expression (colorbar) of the (2) cell cycle, (3) core oncogenic, or (4) mesenchymal differentiation, programs. (c) Biological processes regulated in the SS18-SSX program. Gene sets (rows) most enriched (-log10(P-value), hypergeometric test, x axis) in induced (left) and repressed (right) SS18-SSX program genes, which are either direct (black bars) or indirect (grey bars) targets of SS18-SSX based on ChIP-Seq data, and genetic perturbation. Vertical line denotes statistical significance following multiple hypotheses correction. (d) The SS18-SSX program distinguishes SyS from other cancer types and other sarcomas. Overall Expression of the SS18-SSX program (y axis) in either TCGA samples (n = 9,391, top), stratified by cancer types (x axis), or in another independent cohort of sarcoma tumors (n = 164, bottom) (48). Middle line: median; box edges: 25th and 75th percentiles, whiskers: most extreme points that do not exceed ±IQR*1.5; further outliers are marked individually. **P<0.01, ***P<1*10−3, ****P<1*10−4, one-sided t-test. (e) Repression of the core oncogenic and SS18-SSX programs by short term TNF treatment is not sustained long term. Distribution of Overall Expression scores (y axis) of the core oncogenic program and the direct and indirect SS18-SSX programs (x axis) in control cells (blue) and cells treated with TNF for 4–6 hours (left) or more than 24 hours (right).
Extended Data Fig. 6.
Extended Data Fig. 6.. HDAC and CDK4/6 inhibitors synergistically repress the core oncogenic program and induce cell autonomous immune responses.
(a) The fraction of viable, necrotic, and apoptotic cells, showing four different SyS cell lines. (b-d) Distribution of the expression (y axis) of core oncogenic genes (b), as well as the Overall Expression of TNF (c) and IFN (d) signaling pathways in SyS cells and MSCs (x axis) under different treatments (color legend; n = no. of SYO1, HSSYII, and MSC cells). Middle line: median; box edges: 25th and 75th percentiles, whiskers: most extreme points that do not exceed ±IQR*1.5; further outliers are marked individually. **P<0.01, ***P<1*10−3, ****P<1*10−4, onesided t-test. (e) Workflow of the co-culture CME-1-T-cell experiment. (f) HLA-A2 and HLA-E protein levels on the cell surface of CME-1 cells under different treatments. (g) Standard, FSC vs. SSC gating was performed followed by strict FSC-width vs. FSC-area criteria to discriminate doublets and gate only single cells. Top: Singlets were gated upon the CD3- population to clearly identify the tumor cell population. The percentage of Zombie-UV+ cells were determined on the CD3- population. Bottom: Singlets were gated upon the Zombie-UV- (live) CD3+ population to clearly identify the viable T cell population.
Fig. 1.
Fig. 1.. Single-cell map of the cellular ecosystem of synovial sarcoma tumors.
(a) Study workflow. (b-e) Consistent assignment of cell identity. t-SNE plots of scRNA-Seq profiles (dots), colored by either (b) tumor sample, (c) inferred cell type, (d) SS18-SSX1/2 fusion detection, (e) CNA detection, and (f) differential similarity to SyS compared to other sarcomas (Online Methods). Dashed ovals (b): mesenchymal and epithelial malignant subpopulations of biphasic (BP) tumors. (g) Inferred large-scale CNAs distinguish malignant (top) from non-malignant (bottom) cells, and are concordant with WES data (bold). The CNAs (red: amplifications, blue: deletions) are shown along the chromosomes (x axis) for each cell (y axis).
Fig. 2.
Fig. 2.. Cellular plasticity and a core oncogenic program characterize synovial sarcoma cells.
(a-d) De-differentiation, cell cycle, and the core oncogenic programs across malignant cells. t-SNE plots of malignant cell profiles (dots), colored by: (a) sample, (b) Overall Expression of the epithelial vs. mesenchymal differentiation program, (c) cell cycle status, or (d) Overall Expression of the core oncogenic program. Dashed ovals (A): mesenchymal and epithelial malignant subpopulations of biphasic (BP) tumors or poorly differentiated (PD) tumor. (e, f) Association between cell cycle and poor differentiation. (e) G1/S (x axis) and G2/M (y axis) phase signature scores for each cell. (f) Epithelial and mesenchymal-like differentiation. Scatter plots of the malignant cells’ (dots) scores for the epithelial vs. mesenchymal program (x axis) and for overall differentiation (y axis). Color: expression of cell cycle program (see also Extended Data Fig. 2b, c). (g) Distinct differentiation pattern in biphasic tumors. Single cell profiles dots arranged by the first two diffusion-map components (DCs) for representative examples of a biphasic (SyS12, left) and monophasic (SyS11, right) tumors, and colored by the Overall Expression of the epithelial vs. mesenchymal programs (colorbar). (h) Core oncogenic program genes. Normalized expression (centered TPM values, colorbar) of the top 100 genes in the core oncogenic program (columns) across the malignant cells (rows), sorted according to the Overall Expression of the program (bar plot, right). Leftmost color bars: biphasic tumor and sample ID. (i) The program is expressed in a higher proportion of cycling and poorly differentiated cells. Fraction of malignant cells (y axis) with a high (above median, black) and low (below median, blue) Overall Expression of the core oncogenic program, in cells stratified by cycling and differentiation status (x axis).
Fig. 3.
Fig. 3.. The core oncogenic program is associated with poor prognosis and aggressive disease.
(a-c) In situ validation of programs. Detection of core oncogenic (induced: Hsp90, c-Jun and EGR1; repressed: LGALS1), epithelial (E-cadherin) and mesenchymal (Vimentin) markers, using immunofluorescence (t-CyCIF) (a) and in situ hybridization (ISH) (b,c). Arrows (c): LGALS1+ SyS cells. These patterns repeatedly appeared across tens of different fields of view (see also Extended Data Fig. 3d). (d) The core-oncogenic program and de-differentiation mark the aggressive poorly differentiated (PD) subtype. Overall expression of the core oncogenic or differentiation (both mesenchymal and epithelial) programs scores (y axis) across 34 SyS tumors, including 7 biphasic (BP), 21 monophasic (MP), and 6 poorly differentiated (PD) (x axis). Middle line: median; box edges: 25th and 75th percentiles, whiskers: most extreme points that do not exceed ±IQR*1.5; further outliers are marked individually; one-sided t-test. (e) The core oncogenic program and differentiation scores (overall expression of both differentiation programs) are predictive of metastatic disease in an independent cohort of 58 SyS patients. Kaplan-Meier (KM) curves of metastasis free survival (x axis, years), when stratifying the patients by high (top 25%), low (bottom 25%), or intermediate (remainder) expression of the respective program. P: COX regression p-value; Pc: COX regression p-value when controlling for fusion type and patient age group.
Fig. 4.
Fig. 4.. Limited immune infiltration and features of anti-tumor immunity in SyS tumors.
(a) t-SNE of immune and stroma cell profiles (dots), colored by inferred cell type (left) or sample (right). (b) Cytotoxicity (x axis) and exhaustion (y axis) scores of SyS CD8 T cells, colored by the T cell expansion program score. The latter is associated with high cytotoxicity and lower than expected exhaustion (P < 1*10−11, mixed-effects). (c) Distribution of effector vs. exhaustion scores (top) or an immune checkpoint blockade responsiveness program (bottom) in CD8 T cells from SyS (orange) and melanoma (green); p-value: mixed-effects test. (d) Overall Expression of the immune signatures (y axis) in SyS tumors (orange) and other cancer types (controlling for variation in the mutational load, left panel) or other sarcomas (right panel). (e) Inferred level of immune cell types is associated with the malignant programs in bulk SyS tumors, when controlling for tumor purity. Partial correlation (colorbar) between the inferred level of each immune subset (rows) and the core oncogenic and differentiation levels (columns). (f-h) GeoMx Cancer Transcriptome Atlas (TA) and Whole Transcriptome Atlas in situ profiling reveals that the core oncogenic program (COP) is associated with reduced immune infiltrates. (f) Representative CD45+ staining in COP-high and COP-low tumor niches; the trend was observed across 244 ROIs in 9 SyS tumors, as shown in (g) and (h); (g) the expression of the COP in malignant CD45 AOIs stratified according to the immune cell abundance in the pertaining ROI, with no. of ROIs in parenthesis; p-values: mixed-effects test. (h) association gene expression in malignant CD45 AOIs with immune abundance in the pertaining ROI. (d) and (g) middle line: median; box edges: 25th and 75th percentiles, whiskers: most extreme points that do not exceed ±IQR*1.5; further outliers are marked individually.
Fig. 5.
Fig. 5.. Impact of the genetic driver and immune cells on SyS malignant cells.
(a) scRNA-Seq following KD of SS18-SSX. Co-embedding of Aska and SYO1 cell profiles (dots), colored by: (1) cell line and perturbation; or the Overall Expression (colorbar) of the (2) cell cycle, (3) core oncogenic, or (4) mesenchymal differentiation, programs. (b) SS18-SSX KD represses the core oncogenic program and induces the mesenchymal differentiation program irrespective of its repression of the cell cycle program. Distribution of Overall Expression scores (y axis) for each program in control (blue) and shSSX (grey) cells, for each cell line, where core oncogenic and mesenchymal program scores are shown separately for cycling and non-cycling cells. (c) Expression (centered TPM) of genes (rows) shared between the fusion and core oncogenic programs across the Aska and SYO1 cells (columns), with a control (shCt) or SSX (shSSX) shRNA. Cells are ordered by the Overall Expression of the SS18-SSX program (bottom plot) and labeled by type and condition (Color bar, top). (d) TNF and IFNγ are detected primarily in macrophages and T cells, respectively. Fraction of cell (y axis) of each subset in the tumor (x axis) that express (black) IFNγ (left) or TNF (right) by scRNA-seq. (e) The expression of TNF and IFNG in CD45+ cells is associated with the expression of the core oncogenic program in malignant cells according to the high-plex in situ RNA sequencing (P = 1.15*10−3, mixed-effects). Middle line: median; box edges: 25th and 75th percentiles, whiskers: most extreme points that do not exceed ±IQR*1.5; further outliers are marked individually. (f) TNF and IFNγ repress the core oncogenic and SS18-SSX programs. Distribution of Overall Expression score (y axis) of the core oncogenic (also stratified to its predicted and TNF/IFNγ-dependent and -independent components) and SS18-SSX programs (x axis) in control (blue) and TNF + IFNγ treated cells.
Fig. 6.
Fig. 6.. HDAC and CDK4/6 inhibitors repress the core oncogenic program in SyS cells.
(a) Gene regulatory model links the core oncogenic program to SS18-SSX. Red/green: genes that are induced/repressed in the core oncogenic program. Grey: genes that are repressed in the core oncogenic program and directly repressed by HDAC1-SS18-SSX. Red blunt arrows: repression; black pointy arrows: activation. Thick edges represent paths from SS18-SSX to p21. (b-c) TNF, abemaciclib and panobinostat suppress the core oncogenic program (n = no. of cells from each cell line, according to the order on the x axis). Overall Expression of the core oncogenic program, SS18-SSX program, an immune resistance program identified in melanoma, and MHC-1 genes in SyS cells and MSCs (x axis) treated with different treatment regimens. *P<0.1,**P<0.01, ***P<1*10−3, ****P<1*10−4, one-sided t-test; middle line: median; box edges: 25th and 75th percentiles, whiskers: most extreme points that do not exceed ±IQR*1.5; further outliers are marked individually. (d) NY-ESO-1-based T-cell-sarcoma co-culture system. (e-h) Prior treatment of CME-1 cells with abemaciclib and panobinostat (e) increased HLA-A and HLA-E protein levels on the cell surface (P < 1*10−4, two-sided Mann-Whitney U test); (f) CD25 (activation marker) expression on the T cell surface (2.5:1 P = 0.0061, 1:1 P = 0.0082, 0.25:1 P = 0.0118, two-sided Mann-Whitney U test), (g) induces IFNγ and IL-2 secretion, and (h) improves T cell mediated killing (P = 0.0053, 2.5:1 P = 0.0009, 1:1 P = 0.0025, 0.25:1 P = 0.0122, two-sided Mann-Whitney U test). (e-h) Data are presented as mean values +/− SEM; each dot denotes one of 3 biologically independent experiments. (f-h) the results are shown for different malignant to T cell ratios. (i) Model of multifactorial SyS cell states. Left: The SS18-SSX oncoprotein sustains de-differentiation, proliferation and the core oncogenic program. Right: immune cells repress the core oncogenic and SS18-SSX programs through TNF and IFNγ secretion. Combined inhibition of HDAC and CDK4/6 mimics these effects in SyS cells.

Comment in

References

    1. Trujillo JA, Sweis RF, Bao R & Luke JJ T Cell–Inflamed versus Non-T Cell–Inflamed Tumors: A Conceptual Framework for Cancer Immunotherapy Drug Development and Combination Therapy Selection. Cancer Immunol. Res 6, 990 (2018). - PMC - PubMed
    1. Fridman WH, Pagès F, Sautès-Fridman C & Galon J The immune contexture in human tumours: impact on clinical outcome. Nat. Rev. Cancer 12, 298–306 (2012). - PubMed
    1. Pollack SM et al. T-cell infiltration and clonality correlate with programmed cell death protein 1 and programmed death-ligand 1 expression in patients with soft tissue sarcomas. Cancer 123, 3291–3304 (2017). - PMC - PubMed
    1. Nielsen TO, Poulin NM & Ladanyi M Synovial sarcoma: recent discoveries as a roadmap to new avenues for therapy. Cancer Discov 5, 124–134 (2015). - PMC - PubMed
    1. Pollack SM The potential of the CMB305 vaccine regimen to target NY-ESO-1 and improve outcomes for synovial sarcoma and myxoid/round cell liposarcoma patients. Expert Rev. Vaccines 17, 107–114 (2018). - PMC - PubMed

METHOD REFERENCES

    1. Fisher S et al. A scalable, fully automated process for construction of sequence-ready human exome targeted capture libraries. Genome Biol 12, R1 (2011). - PMC - PubMed
    1. Merritt CR et al. Multiplex digital spatial profiling of proteins and RNA in fixed tissue. Nat. Biotechnol 38, 586–599 (2020). - PubMed
    1. Langmead B, Trapnell C, Pop M & Salzberg SL Ultrafast and memory-efficient alignment of short DNA sequences to the human genome. Genome Biol 10, R25 (2009). - PMC - PubMed
    1. Li B & Dewey CN RSEM: accurate transcript quantification from RNA-Seq data with or without a reference genome. BMC Bioinformatics 12, 323 (2011). - PMC - PubMed
    1. Dobin A et al. STAR: ultrafast universal RNA-seq aligner. Bioinforma. Oxf. Engl 29, 15–21 (2013). - PMC - PubMed

Publication types

MeSH terms

Substances