. 2021 Feb;23(2):136-146.
doi: 10.1038/s41556-020-00627-0. Epub 2021 Jan 25.

Proteotoxic stress is a driver of the loser status and cell competition

Affiliations

Proteotoxic stress is a driver of the loser status and cell competition

Michael E Baumgartner et al. Nat Cell Biol. 2021 Feb.

Abstract

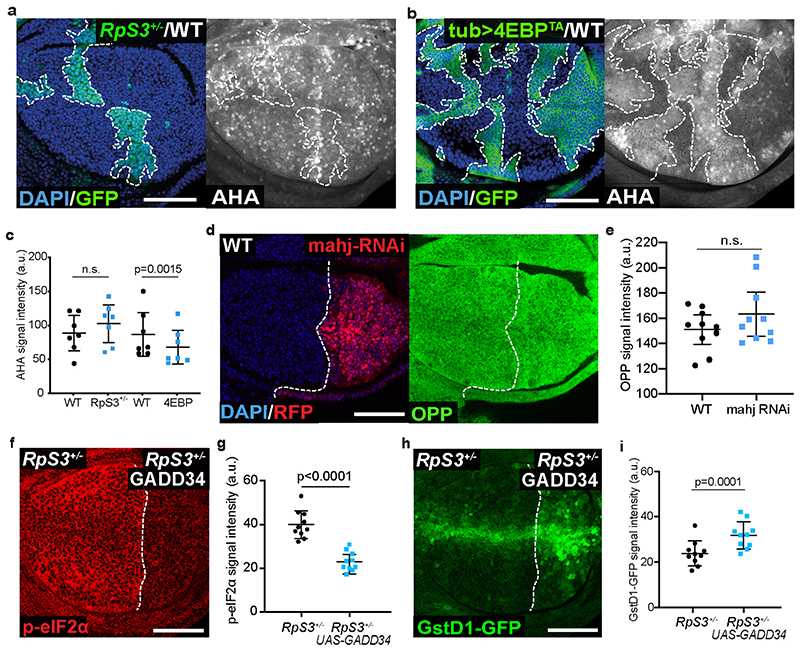
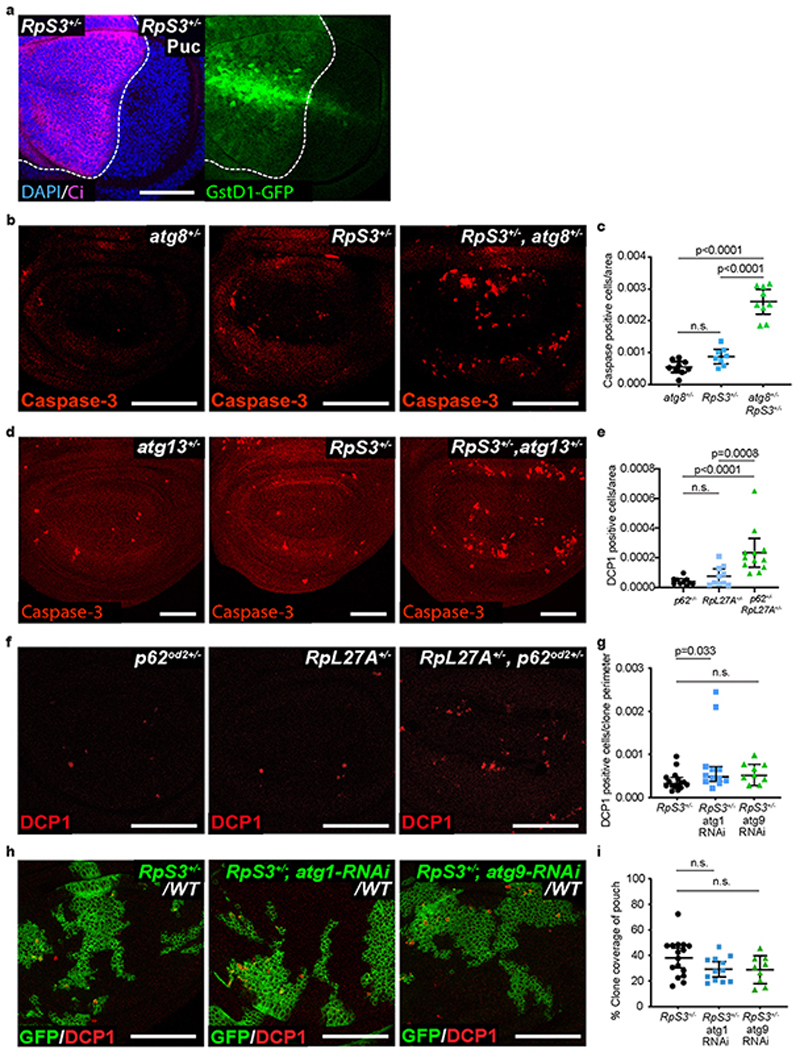
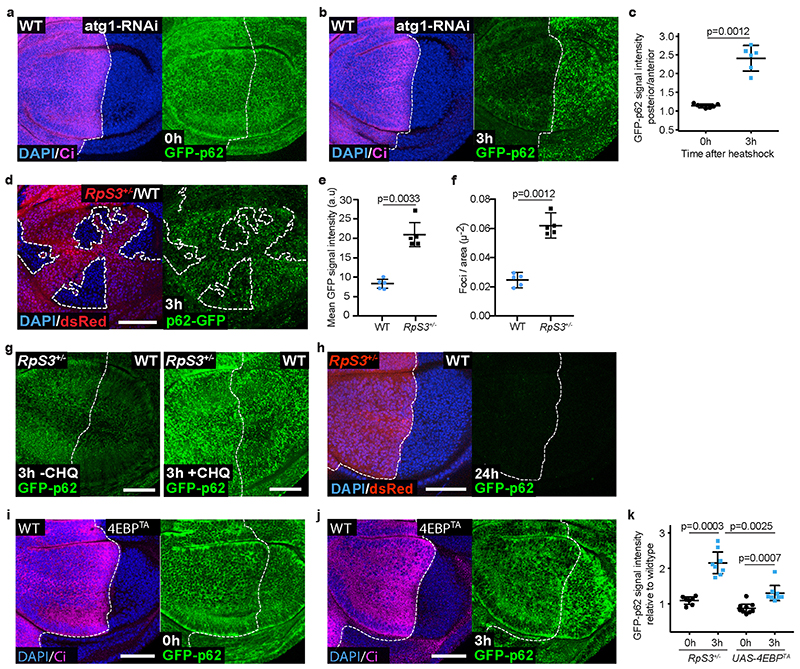
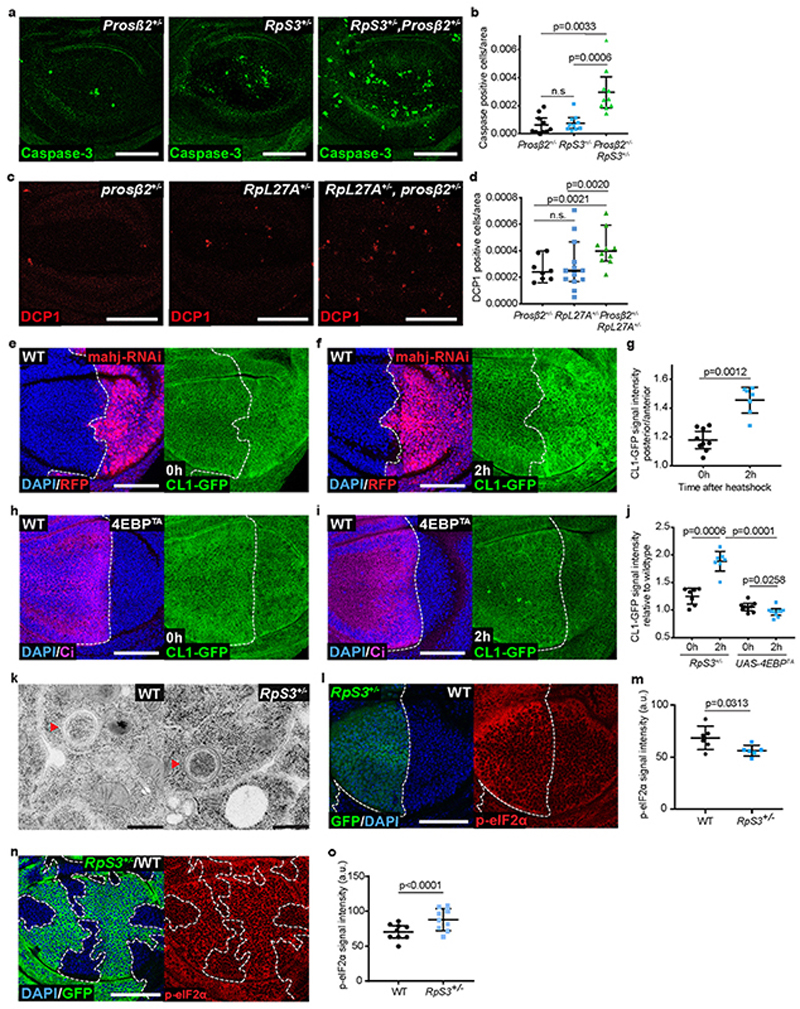
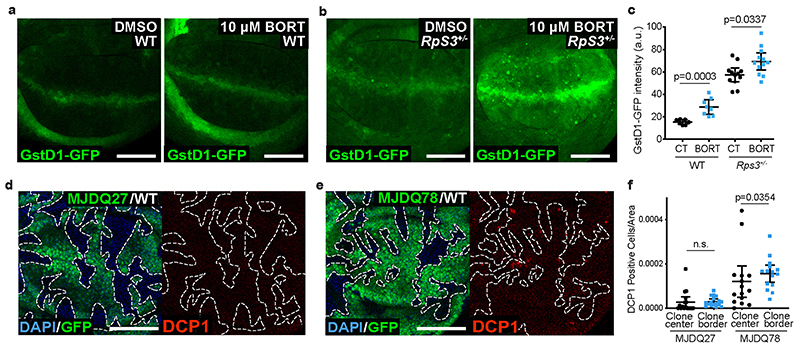
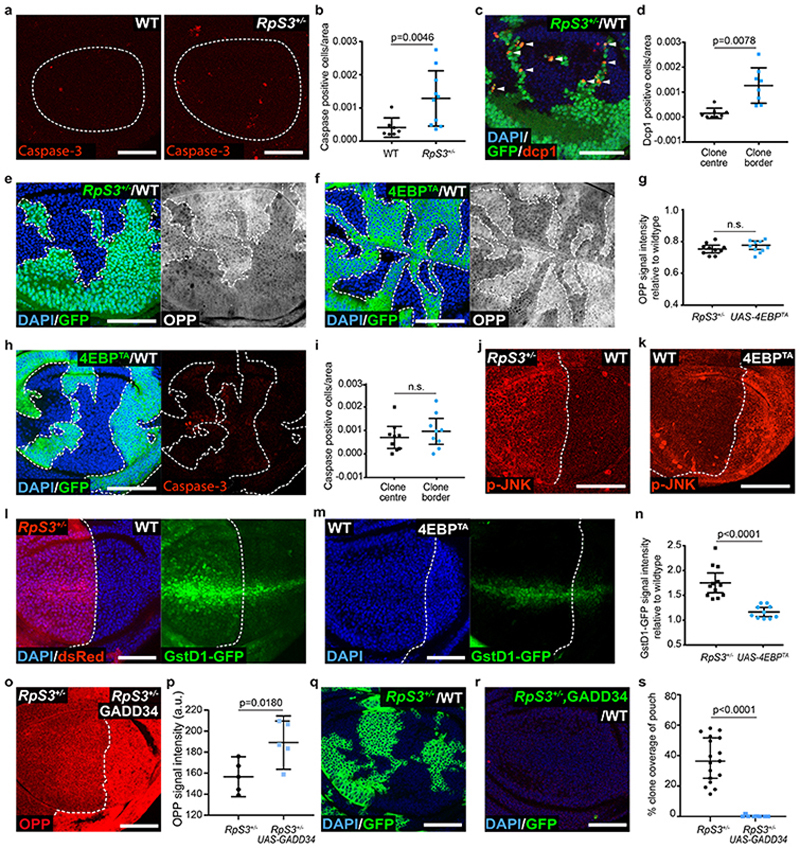
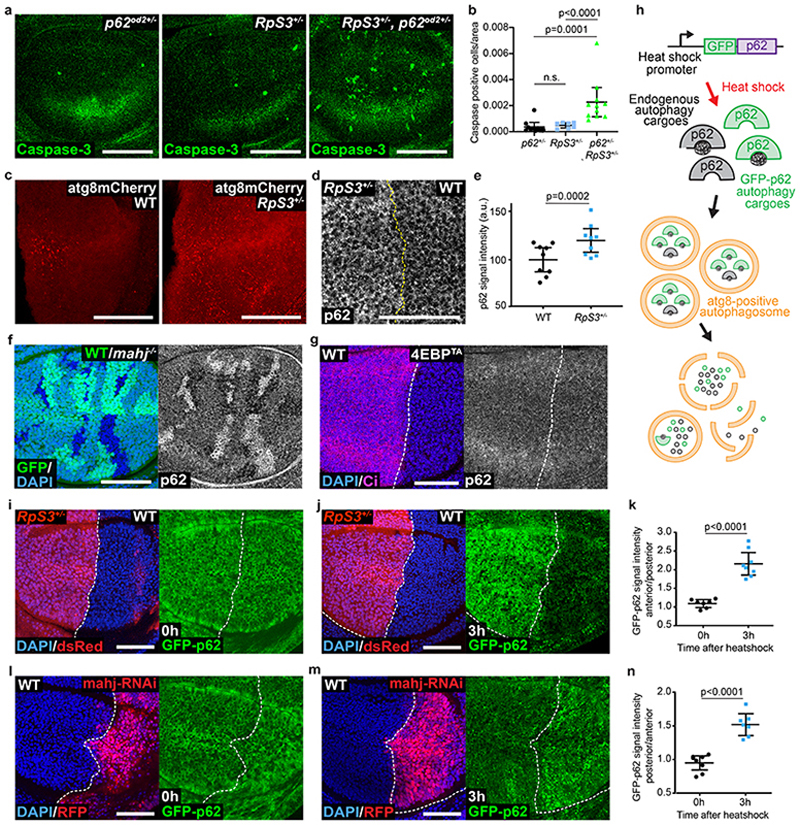
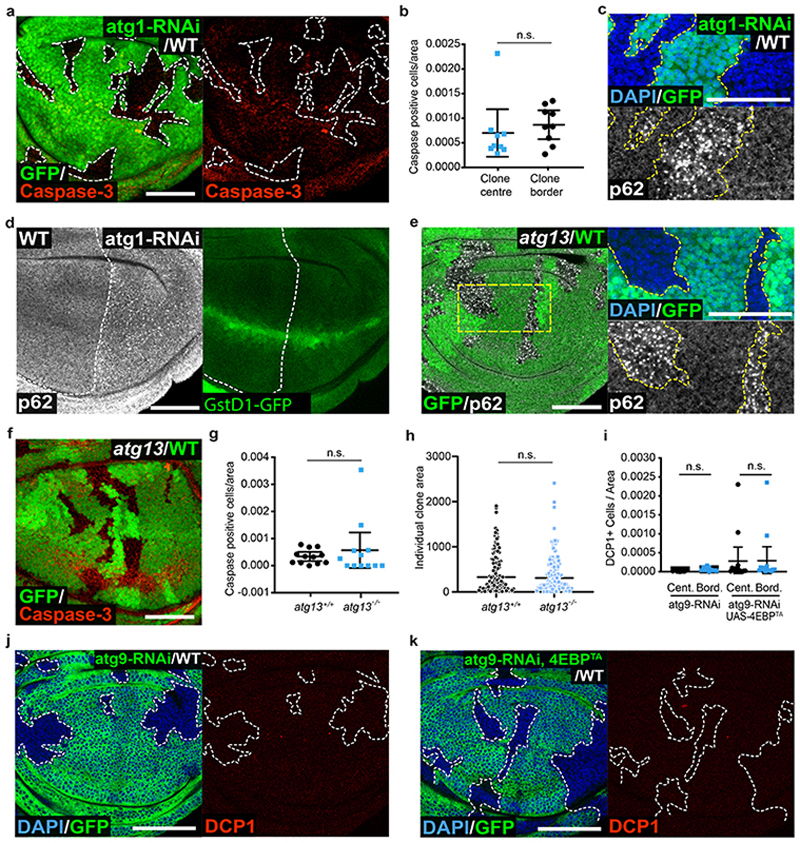
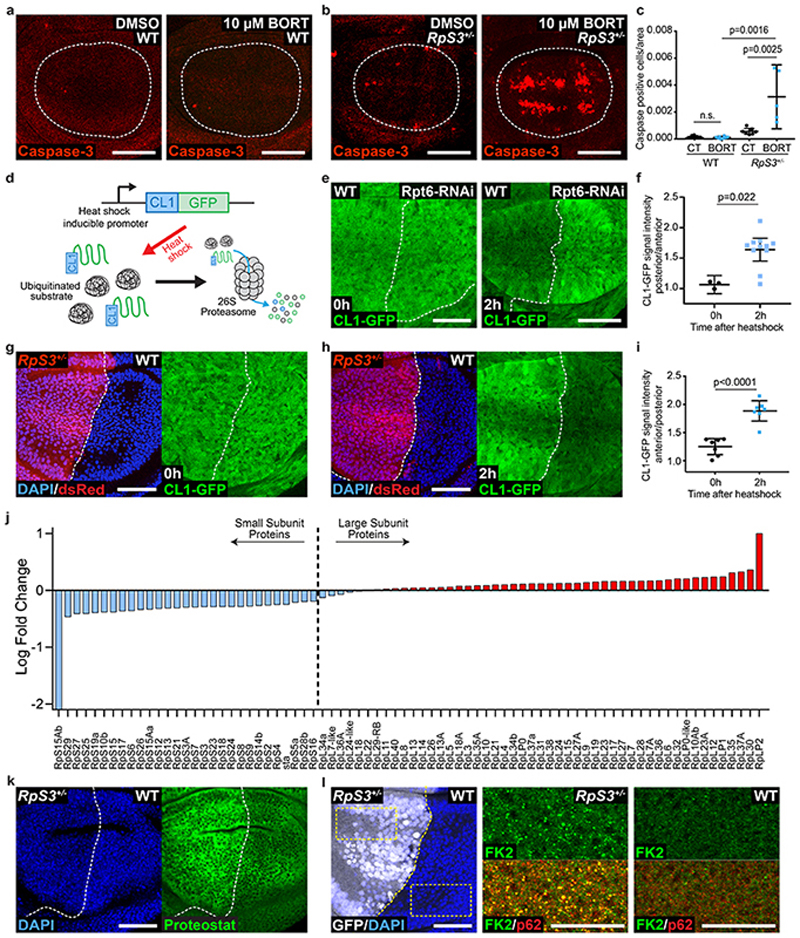
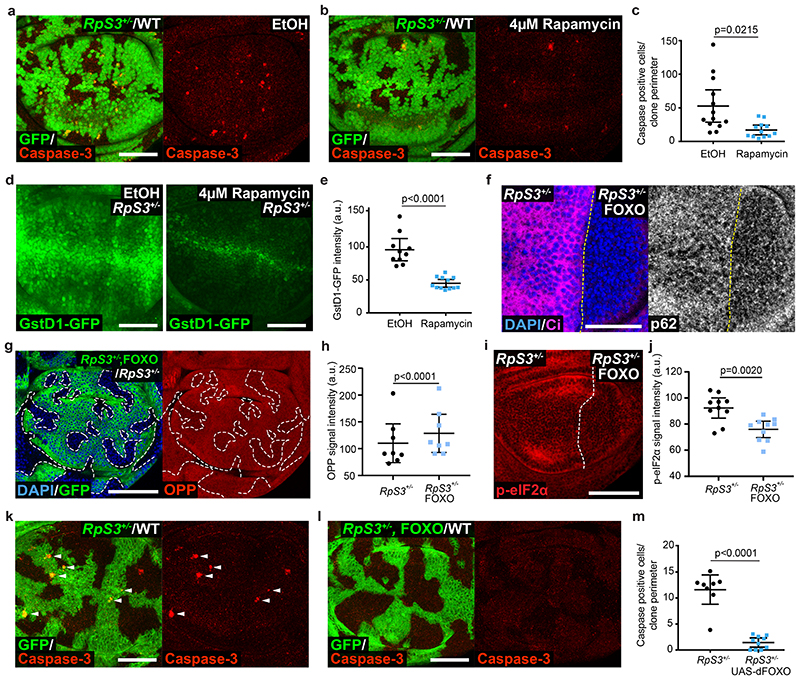
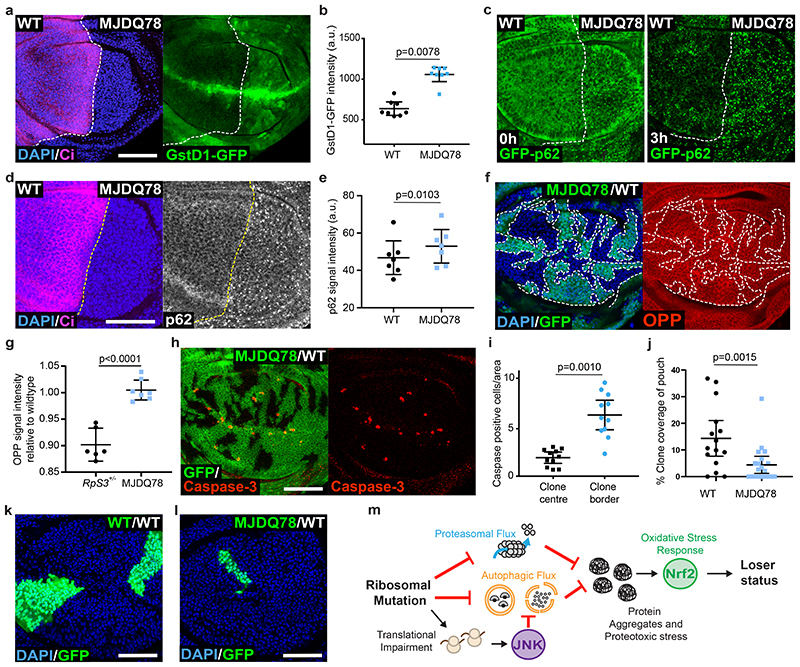
Cell competition allows winner cells to eliminate less fit loser cells in tissues. In Minute cell competition, cells with a heterozygous mutation in ribosome genes, such as RpS3+/- cells, are eliminated by wild-type cells. How cells are primed as losers is partially understood and it has been proposed that reduced translation underpins the loser status of ribosome mutant, or Minute, cells. Here, using Drosophila, we show that reduced translation does not cause cell competition. Instead, we identify proteotoxic stress as the underlying cause of the loser status for Minute competition and competition induced by mahjong, an unrelated loser gene. RpS3+/- cells exhibit reduced autophagic and proteasomal flux, accumulate protein aggregates and can be rescued from competition by improving their proteostasis. Conversely, inducing proteotoxic stress is sufficient to turn otherwise wild-type cells into losers. Thus, we propose that tissues may preserve their health through a proteostasis-based mechanism of cell competition and cell selection.


Conflict of interest statement

Financial and non-financial competing interests: The authors declare no competing interests.

Figures

Extended Data Fig. 1
Extended Data Fig. 1. Protein synthesis and its regulation in Rps3 +/- cells.
(a-c) AHA (grey) protein synthesis assay in wing discs harboring either Rps3 +/- clones (GFP-positive) (a) or clones overexpressing 4EBPTA (GFP-positive) (b), and corresponding quantification (n=7 and 7, respectively, two-sided paired t-test without p-adjustment for multiple comparisons) (c). (d-e) OPP (green) protein synthesis assay in a wing disc expressing mahj-RNAi in the P compartment (positively labelled with RFP) (d) and corresponding quantification (n=10, two-sided Wilcoxon signed-rank test) (e). (f-g) An RpS3 +/- wing disc expressing GADD34 in the P compartment and labelled with phospho-eIF2α (red) (f), and corresponding quantification (n=10, two-sided paired t-test) (g). (h-i) GST-GFP reporter (green) activation in an RpS3 +/- wing disc expressing GADD34 in the P compartment (h), and corresponding quantification (n=10, two-sided paired t-test) (i). For all micrographs, scale bars correspond to 50μm. For all quantifications provided, the horizontal line represents the mean and whiskers indicate 95% confidence intervals. All n numbers refer to the number of individual wing discs.
Extended Data Fig. 2
Extended Data Fig. 2. The role of autophagy in prospective losers.
(a) GstD1-GFP signal (green) in a RpS3 +/- wing disc expressing Puc in P cells (labelled by the absence of Ci, magenta). (b-c) Apoptotic cell death, as detected by anti-cleaved Caspase-3 reactivity (red), in wing discs of an atg8 +/- heterozygote (b, left), RpS3 +/- heterozygote (b, middle), or atg8 +/-, RpS3 +/- transheterozygote (b, right) and corresponding quantification (n=9, 8, and 9 respectively, two-sided two sample Kolmgorov-Smirnov test without p-adjustment for multiple comparisons) (c). (d) Apoptotic cell death, as detected by anti-cleaved Caspase-3 reactivity (red), in wing discs of an atg13 +/- heterozygote (d, left), RpS3 +/- heterozygote (d, middle), or atg13 +/-, RpS3 +/- transheterozygote (d, right). (e-f) Apoptotic cell death, as detected by anti-cleaved dcp1 antibody staining (red), in wing discs of a p62 +/- heterozygote (f, left), RpL27A +/- heterozygote (f, middle), or RpL27A +/-, p62 +/- transheterozygote (f, right) and corresponding quantification (n=10, 10, and 12 respectively, two-sided Mann-Whitney U test without p-adjustment for multiple comparisons) (e). (g-i) Wing discs harboring RpS3 +/- clones (GFP-positive) (h, left), RpS3 +/- clones expressing atg1-RNAi (GFP-positive) (h, middle), or RpS3 +/- clones expressing atg9-RNAi (GFP-positive) (h, right) stained with cleaved-dcp1 (red) and corresponding quantification of border cell death (n=16, 12, and 9 respectively, two-sided Mann-Whitney U test without p-adjustment for multiple comparisons) (g) and clone coverage (n=16, 12, and 9 respectively, two-sided student’s t-test without p-adjustment for multiple comparisons) (i). For all micrographs, scale bars correspond to 50μm. For all quantifications provided, the horizontal line represents the mean and whiskers indicate 95% confidence intervals. All n numbers refer to the number of individual wing discs.
Extended Data Fig. 3
Extended Data Fig. 3. Autophagy flux in ribosome mutants and upon translation inhibition.
(a-c) GFP-p62 ReFlux signal (green) in wing discs expressing RNAi against the autophagy gene atg1 specifically in P cells (labelled by the absence of Ci, magenta), immediately after heat shock (a) or three hours later (b), and corresponding signal quantifications (n=7 and 6 respectively, two-sided two sample Kolmgorov-Smirnov test) (c). (d-f) GFP-p62 ReFlux signal (green) in a wing disc harboring RpS3 +/- clones (dsRed-positive) three hours after heat-shock (d) and corresponding quantification of GFP-p62 signal intensity (e) and number of GFP-p62 foci per area (f) (for both measurements, n=5, two-sided paired t-test). (g) GFP-p62 ReFlux signal (green) in wing discs harboring RpS3 +/- A cells and wild-type P cells, three hours after heat-shock, with or without addition of chloroquine, as indicated. (h) GFP-p62 ReFlux signal (green) in wing discs harboring RpS3 +/- A cells (dsRed-positive) and wild-type P cells (dsRed-negative) twenty-four hours after heat-shock. (i-k) GFP-p62 ReFlux signal (green) in wing discs harboring wild-type A cells and 4E-BPTA -expressing P cells (labelled by the absence of Ci, magenta), immediately after heat shock (i) or three hours later (j), and corresponding signal quantifications relative to wing discs containing an RpS3 +/- A compartment and wildtype P compartment (images not shown) (n=9 and 8 for 0 and 3 hour 4E-BPTA, and n=7 and 8 for 0 and 3 hour RpS3 +/-, respectively; two-sided two-sample Kolmgorov-Smirnov test without p-adjustment for multiple comparisons) (k). For all micrographs, scale bars correspond to 50μm. For all quantifications provided, the horizontal line represents the mean and whiskers indicate 95% confidence intervals. All n numbers refer to the number of individual wing discs.
Extended Data Fig. 4
Extended Data Fig. 4. Proteasome defects are linked to the prospective loser status but not to translation inhibition.
(a-b) Apoptosis as detected by anti-cleaved caspase-3 reactivity (green), in Prosβ2 +/- (a, left), RpS3 +/- (a, middle), or Prosβ2+/-, RpS3 +/- transheterozygote (a, right) wing discs and corresponding quantification (n=10, 10, and 10 respectively, two-sided two sample Kolmgorov-Smirnov test without p-adjustment for multiple comparisons) (b). (c-d) Apoptotic cell death as detected by cleaved-dcp1 (red) in Prosβ2 +/- (c, left), a RpL27A +/- (c, middle), or a RpL27A +/-, prosβ2 +/- transheterozygote (c, right) wing discs, and corresponding quantification (n=8, 13, and 10 respectively, two-sided Mann-Whitney U test without p-adjustment for multiple comparisons) (d). (e-g) ProteoFLUX CL1-GFP signal (green) in wing discs expressing mahj-RNAi in the P compartment (RFP-positive), immediately after heat shock (e) or two hours later (f) and corresponding signal quantifications (n=9 and 7 respectively, two-sided two sample Kolmgorov-Smirnov test) (g). (h-j) ProteoFLUX CL1-GFP signal (green) in wing discs harboring wild-type A cells and 4E-BPTA-expressing P cells (labelled by the absence of Ci, magenta), immediately after heat shock (h) or two hours later (i), and corresponding signal quantifications relative to wing discs containing an RpS3 +/- A compartment and wildtype P compartment (images not shown) (n=9 and 10 for 0 and 2 hour 4E-BPTA, and n=7 and 7 for 0 and 2 hour RpS3 +/-, respectively; two-sided two-sample Kolmgorov-Smirnov test without p-adjustment for multiple comparisons) (j). (k) Transmission Electron microscopy images of a wing disc with wildtype P (left panel) and RpS3 +/- A compartments (right panel). Red arrows indicate phago-lysosomal structures containing ribosomes. The scale bar is 500 nm. (l-m) Phospho-eIF2α staining (red) in wing discs harboring RpS3 +/- A cells (GFP-positive) and wild-type P cells (GFP-negative) (l) and corresponding signal quantifications (n=6, two-sided Wilcoxon ranked-sum test) (m). (n-o) A wing disc harboring RpS3 +/- clones (GFP-positive) and stained for phospho-elF2α (red) (n) and corresponding signal quantification (n=9, two-sided paired t-test) (o). For all micrographs other than those in (k), scale bars correspond to 50μm. For all quantifications, the horizontal line represents the mean and whiskers indicate 95% confidence intervals. All n numbers refer to the number of individual wing discs.
Extended Data Fig. 5
Extended Data Fig. 5. Proteostasis and the oxidative stress response.
(a-c) GstD1-GFP signal (green) in wild type (a) or RpS3 +/- wing discs (b) fed DMSO control or 10μM bortezomib, as indicated, and corresponding quantification (n=7, 8, 12, and 12, two-sided Mann-Whitney U test without p-adjustment for multiple comparisons) (c). (d-f) Wing discs harboring GFP-positive clones expressing MJDQ27 (d) or MJDQ78 (e) and stained with cleaved-dcp1 (red) and corresponding quantification of cell death (n=17 and 15 respectively, two-sided Wilcoxon signed-rank test without p-adjustment for multiple comparisons) (f). For all micrographs, scale bars correspond to 50μm. For all quantifications provided, the horizontal line represents the mean and whiskers indicate 95% confidence intervals. All n numbers refer to the number of individual wing discs.
Figure 1
Figure 1. Reduced protein synthesis does not confer the loser status.
(a-b) Apoptosis detection by cleaved caspase-3 staining (red) in wild type or RpS3 +/- non-competing (homotypic) wing discs (a) and corresponding quantification (n=7 and 10, respectively, two-sided Mann-Whitney U Test) (b). (c-d) Apoptosis detection by dcp-1 staining (red) in competing wing discs containing RpS3 +/- cells (GFP-positive) and unlabeled wild type cells (GFP-negative) (c) and corresponding quantification (n=8, two-sided Wilcoxon signed-rank test) (d). (e-g) Translation rate measurement by OPP in wing discs containing wild-type cells and RpS3 +/- clones (GFP-positive) (e) or 4E-BPTA-expressing clones (GFP-positive) (f). Corresponding quantifications are in (g) (n=10 and 10 respectively, two-sided two sample Kolmgorov-Smirnov test). (h-i) Apoptosis detection by cleaved caspase-3 staining (red) in wing discs with mosaic expression of 4E-BPTA (GFP-positive) (h), and corresponding cell death quantifications (n=9, two-sided Wilcoxon signed-rank test) (i). (j) Wing disc harboring an RpS3 +/- Anterior (A) and a wild-type Posterior (P) compartments stained for anti-active phospho-JNK (p-JNK, red). (k) Wing disc expressing 4E-BPTA in P compartment stained for p-JNK (red). (l-n) GstD1-GFP signal (green) in wing discs harboring RpS3 +/- A cells (dsRed-positive) and wild-type P cells (dsRed-negative) (l) and in wing discs harboring 4E-BPTA-expressing P and wild-type A cells (m), and corresponding quantification (n=12 and 10 respectively, two-sided two sample Kolmgorov-Smirnov test) (n). (o-p) An RpS3 +/- wing disc over-expressing GADD34 in P cells and labelled with OPP (o), and corresponding quantification (n=5, two-sided paired t-test) (p). (q-s) Wing discs harboring wild-type cells and RpS3 +/- clones (GFP-positive) (q) or RpS3 +/- clones expressing GADD34 (GFP-positive) (r), and corresponding quantification (n=17 and 10 respectively, two-sided Mann-Whitney U test) (s). In this figure, for all micrographs, scale bars correspond to 50μm. All n numbers refer to the number of individual wing discs. In this figure and throughout: dashed lines indicate wing pouch or clonal and compartment boundaries; clone border defines cells within 2-cell diameters of the clone perimeter; Posterior is right and dorsal is up; figure panel genotypes are provided for all figures in Supplementary Table 3; each point in graphs represents one wing disc, unless otherwise indicated. For all quantifications, the horizontal line represents the mean and whiskers indicate 95% confidence intervals.
Figure 2
Figure 2. Prospective losers display defective autophagic flux.
(a-b) Apoptotic cell death, as detected by anti-cleaved Caspase-3 reactivity (green), in wing discs of a p62 +/- heterozygote (a, left), RpS3 +/- heterozygote (a, middle), or p62 +/-, RpS3 +/- transheterozygote (a, right) and corresponding quantification (n=10, 7, and 11 respectively, two-sided Mann-Whitney U test without p-adjustment for multiple comparisons) (b). (c) Staining of autophagosomes and autolysosomes, as detected by atg8-GFP-mCherry expression (red) in the P-compartment of wild type (c, left), or Rps3 +/- (c, right) wing discs. (d-e) Immunostaining for p62 in wing discs harboring RpS3 +/- A cells and wild-type P cells (d) and corresponding fluorescence intensity quantification (n=9, two-sided paired t-test) (e). (f) Immunostaining of p62 in a wing disc with mahj -/- clones (GFP-negative) induced in a mahj +/- heterozygous background (1XGFP). Wild-type twin spots are 2XGFP. (g) Immunostaining for p62 in wing discs harboring wild-type A cells and 4E-BPTA-expressing P cells (labelled by the absence of Ci, magenta). (h) Schematic representation of ReFLUX: the autophagy cargo p62 is fused to GFP and driven by a hs promoter for pulse-chase expression. (i-k) GFP-p62 ReFlux signal (green) in wing discs harboring RpS3 +/- A cells (dsRed-positive) and wildtype P cells (dsRed-negative) immediately after heat shock (i), or three hours later (j) and corresponding signal quantifications (n= 7 and 8 respectively, two-sided student’s t-test) (k). (l-n) GFP-p62 ReFlux signal (green) in wing discs expressing mahj-RNAi in the P compartment (RFP-positive), immediately after heat shock (l) or three hours later (m) and corresponding signal quantifications (n=8 and 7 respectively, two-sided student’s t-test) (n). For all micrographs, scale bars correspond to 50μm. For all quantification, the horizontal line represents the mean and whiskers indicate 95% confidence intervals. All n numbers refer to the number of individual wing discs.
Figure 3
Figure 3. Autophagy impairment does not confer the loser status.
(a-b) Apoptosis detection by cleaved caspase-3 staining (red) in wing discs with mosaic expression of atg1-RNAi (GFP-positive cells) (a) and corresponding quantifications (n=9, two-sided Wilcoxon signed-rank test) (b). Cell death is classed as border death or center death, as described in Figure 1. (c) p62 staining in wing discs of the same genotype as in (a). (d) p62 staining (left) and GstD1-GFP signal (right) in wing discs harboring atg1-RNAi expressing P cells and wild-type A cells. (e-h) p62 staining (e) and apoptosis detection by cleaved caspase-3 staining (red) (f) in wing discs with atg13 -/- clones (GFP-negative) induced in an atg13 +/- heterozygous background (1XGFP), and corresponding cell death (g, n=12, two-sided Wilcoxon signed-rank test) and clone size (h, n=95 and 105, respectively, two-sided Mann-Whitney U test) quantifications for atg13 -/- clones and wild-type atg13 +/+ twin spots (2XGFP). Each dot or square on the graph in (h) represents one clone, and the horizontal line represents the median and whiskers indicate the 95% confidence interval. (i-k) Wing discs harboring GFP-positive clones expressing atg9-RNAi (j) or expressing atg9-RNAi and 4E-BPTA (k) and stained for cleaved-dcp1 (red) and corresponding cell death quantification in clone centers (Cent.) versus borders (Bord.) (n=11 and 14 respectively, two-sided Wilcoxon signed-rank test) (i). For all micrographs, scale bars correspond to 50μm. For all quantifications provided other than (h), the horizontal line represents the mean and whiskers indicate 95% confidence intervals. All n numbers refer to the number of individual wing discs, except in (h) wherein n numbers refer to the number of individual twin-spot clones.
Figure 4
Figure 4. Prospective losers display proteotoxic stress.
(a-b) Apoptosis detection by cleaved caspase-3 staining (red) in wild type (a) or RpS3 +/- (b) wing discs fed DMSO or 10 μM bortezomib, as indicated. (c) Quantification of dying cell numbers within the pouch region of wing discs from the conditions indicated in (a-b) (n=8, 8, 7, and 5, respectively, two-sided Mann-Whitney U test without p-adjustment for multiple comparisons). (d) Schematic representation of ProteoFLUX: a fusion of GFP with the proteasome degradation signal CL1, driven by a hs promoter for pulse-chase expression. (e-f) ProteoFLUX CL1-GFP signal (green) in wing discs expressing RNAi against the proteasomal subunit Rpt6 specifically in P cells, immediately after heat shock or two hours later, as indicated (e), and corresponding signal quantifications (n=3 and 11 respectively, two-sided Mann-Whitney U test) (f). (g-i) ProteoFLUX CL1-GFP signal (green) in wing discs harboring RpS3 +/- A cells (dsRed-positive) and wild-type P cells (dsRed-negative), immediately after heat shock (g), or two hours later (h), and corresponding signal quantifications (n=7 and 7 respectively, two-sided student’s t-test) (i). (j) Abundance of Ribosomal subunit proteins in RpS3 +/- wing discs relative to wild-type wing discs by TMT Mass Spectrometry. Bars indicate average log fold change values across two independent biological replicates. (k) Proteostat protein aggregate staining (green) in wing discs harboring RpS3 +/- A cells and wild-type P cells. (l) FK2 anti-conjugated ubiquitin (green) and anti-p62 (red) staining in a wing disc harboring an RpS3 +/- A compartment and a wild-type P compartment, as indicated. Yellow boxes mark inset locations. For all micrographs, scale bars correspond to 50μm. For all quantifications provided, the horizontal line represents the mean and whiskers indicate 95% confidence intervals. All n numbers refer to the number of individual wing discs.
Figure 5
Figure 5. Alleviating proteotoxic stress rescues the loser status.
(a-b) Apoptosis detection by cleaved caspase-3 staining (red) in competing wing discs containing RpS3 +/- cells (GFP-positive) and unlabeled wild type cells (GFP-negative) from larvae fed ethanol carrier (a) or 4 μM rapamycin (b). (c) Quantification of cell death at RpS3 +/- clone boundaries for the experiments in (a-b) (n=13 and 12 respectively, two-sided two sample Kolmgorov-Smirnov test). (d-e) GstD1-GFP signal (green) in RpS3 +/- wing discs fed EtOH control or 4μM Rapamycin, as indicated (d), and corresponding quantification (n=10 and 12 respectively, two-sided student’s t-test) (e). (f) p62 staining in RpS3 +/- wing discs expressing FOXO in P cells (labelled by the absence of Ci, magenta). (g-h) An RpS3 +/- wing disc harboring FOXO expressing clones (GFP-positive) and labelled with OPP (red) (g) with corresponding quantification in (h) (n=8, two-sided paired t-test). (i-j) Phospho-eIF2α staining (red) in RpS3 +/- wing discs expressing FOXO in P cells (i) and corresponding quantification (n=10, two-sided Wilcoxon signed-rank test. Due to low genetic frequency and the presence of an internal control, samples from multiple experiments were pooled together) (j). (k-l) Apoptosis detection by cleaved caspase-3 staining (red) in competing wild-type/RpS3 +/- mosaic wing discs without (k) or with (l) additional expression of dFOXO specifically in RpS3 +/- cells. (m) Quantification of cell death at RpS3 +/- clone boundaries for the experiments in (k-l) (n=8 and 10, respectively, two-sided two sample Kolmgorov-Smirnov test). For all micrographs, scale bars correspond to 50μm. For all quantifications provided, the horizontal line represents the mean and whiskers indicate 95% confidence intervals. All n numbers refer to the number of individual wing discs.
Figure 6
Figure 6. Proteotoxic stress is sufficient to confer the loser status.
(a-b) GstD1-GFP signal (green) in a wing disc expressing MJDQ78 in P cells (labelled by the absence of Ci, magenta) (a) and corresponding quantification (n=8, two-sided Wilcoxon signed-rank test) (b). (c) GFP-p62 ReFlux signal (green) in wing discs expressing MJDQ78 in P cells, immediately after heat shock or three hours later, as indicated. (d-e) p62 staining in a wing disc expressing MJDQ78 in P cells (labelled by the absence of Ci, magenta) (d), and corresponding quantification in (e) (n=7, two-sided paired t-test). (f-g) Wing discs harboring GFP-positive clones expressing MJDQ78 labelled with OPP (red) (f) with corresponding quantification relative to wing discs containing competing RpS3 +/- clones and wildtype winners (image not shown) in (g) (n=6 and 7 respectively, two-sided student’s t-test). (h-i) Mosaic wing disc containing GFP-positive clones overexpressing MJDQ78, immuno-stained for cleaved Caspase-3 (red) (h), and corresponding cell death quantification (n= 11, two-sided Wilcoxon signed-rank test) (i). (j-l) Wing discs harboring wild-type cells and wildtype control clones (GFP-positive) (k) or clones expressing MJDQ78 (GFP-positive) (l), and corresponding quantification (n=15 and 20 respectively, two-sided Mann-Whitney U test) (j). (m) Model summarizing how ribosome gene loss leads to proteotoxic stress and to the loser status. For all micrographs, scale bars correspond to 50μm. For all quantifications provided, the horizontal line represents the mean and whiskers indicate 95% confidence intervals. All n numbers refer to the number of individual wing discs.

References

    1. Morata G, Ripoll P. Minutes: mutants of drosophila autonomously affecting cell division rate. Developmental Biology. 1975;42:211–221. - PubMed
    1. Baker NE. Mechanisms of cell competition emerging from Drosophila studies. Curr Opin Cell Biol. 2017;48:40–46. - PMC - PubMed
    1. Maruyama T, Fujita Y. Cell competition in mammals - novel homeostatic machinery for embryonic development and cancer prevention. Curr Opin Cell Biol. 2017;48:106–112. - PubMed
    1. Merino MM, et al. Elimination of unfit cells maintains tissue health and prolongs lifespan. Cell. 2015;160:461–476. - PMC - PubMed
    1. Brown S, et al. Correction of aberrant growth preserves tissue homeostasis. Nature. 2017;548:334–337. - PMC - PubMed

Publication types

MeSH terms