. 2021 Mar;24(3):379-390.
doi: 10.1038/s41593-020-00772-7. Epub 2021 Jan 25.

Ventral arkypallidal neurons inhibit accumbal firing to promote reward consumption

Affiliations

Ventral arkypallidal neurons inhibit accumbal firing to promote reward consumption

Yvan M Vachez et al. Nat Neurosci. 2021 Mar.

Abstract

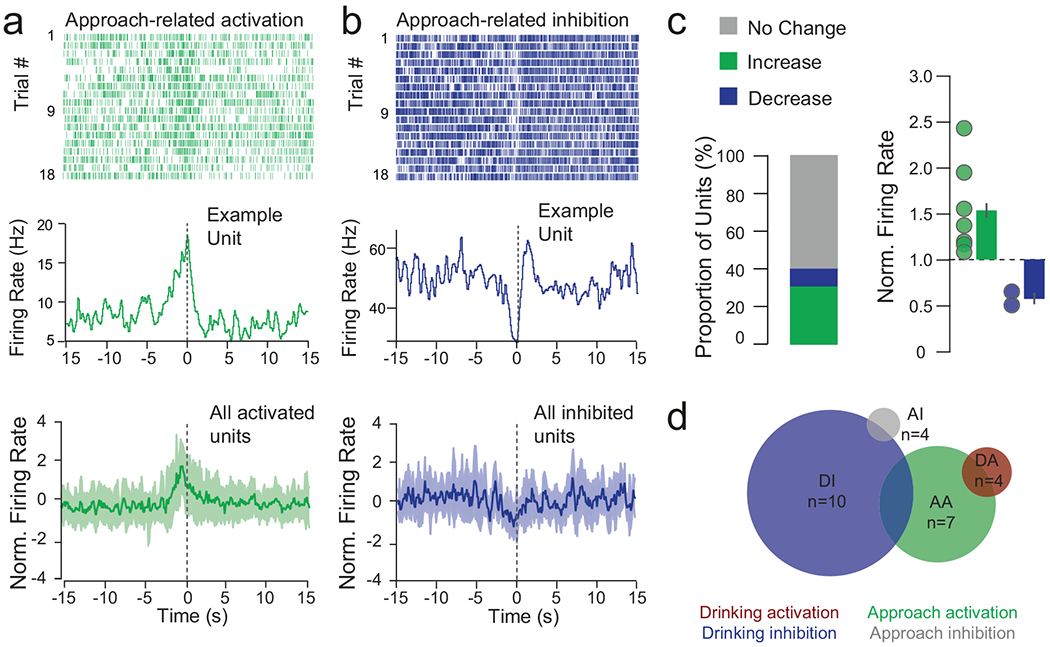
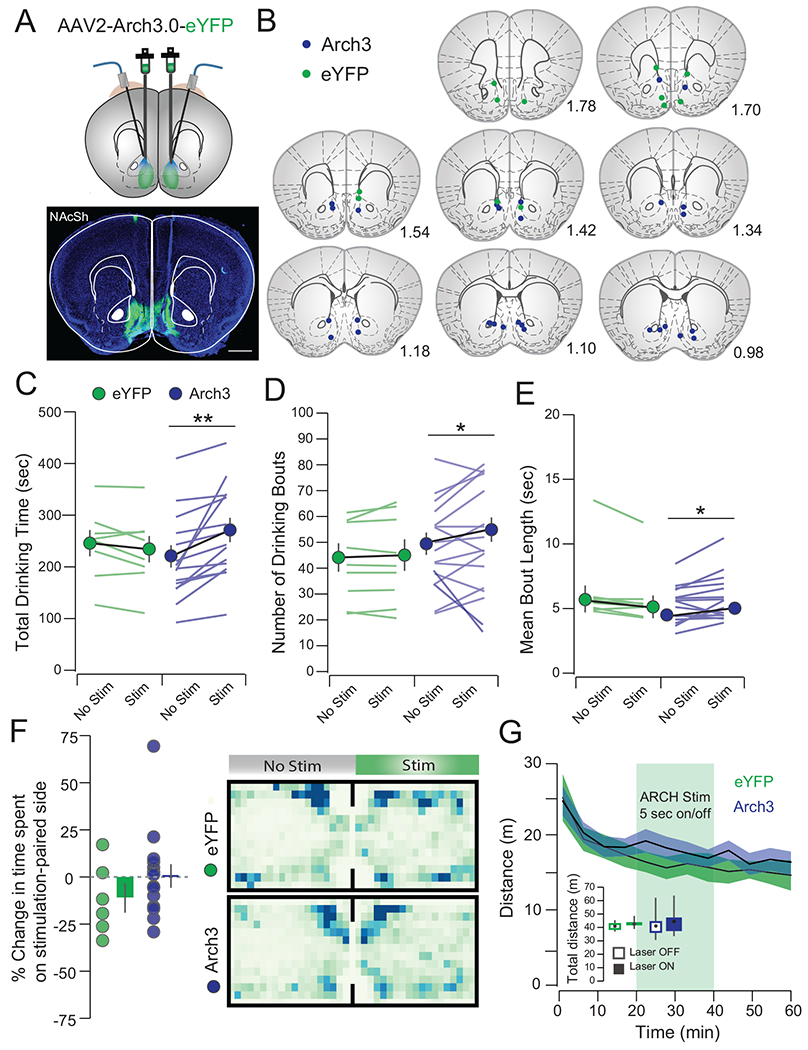
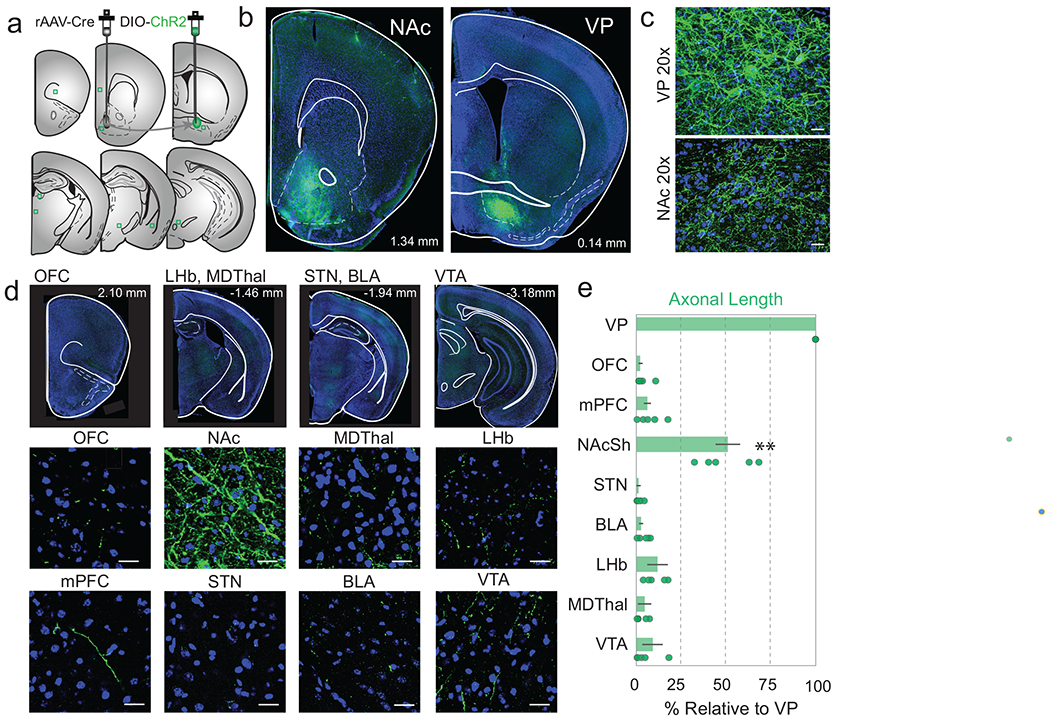
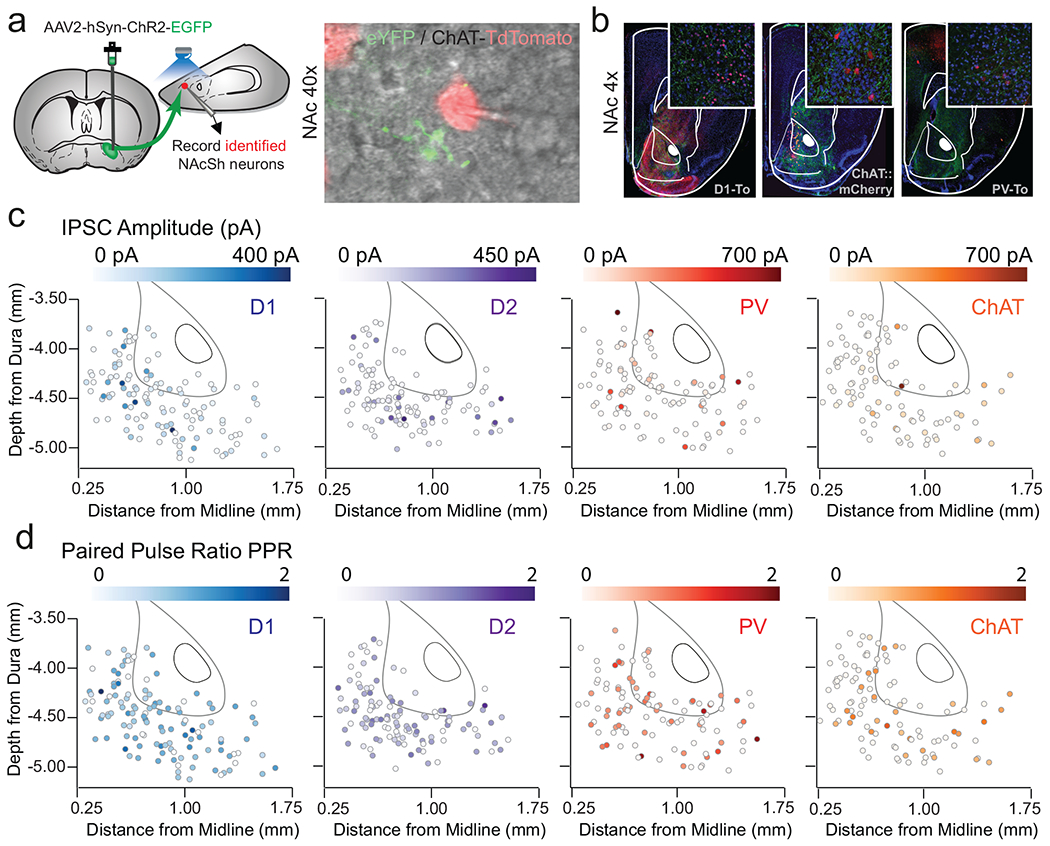
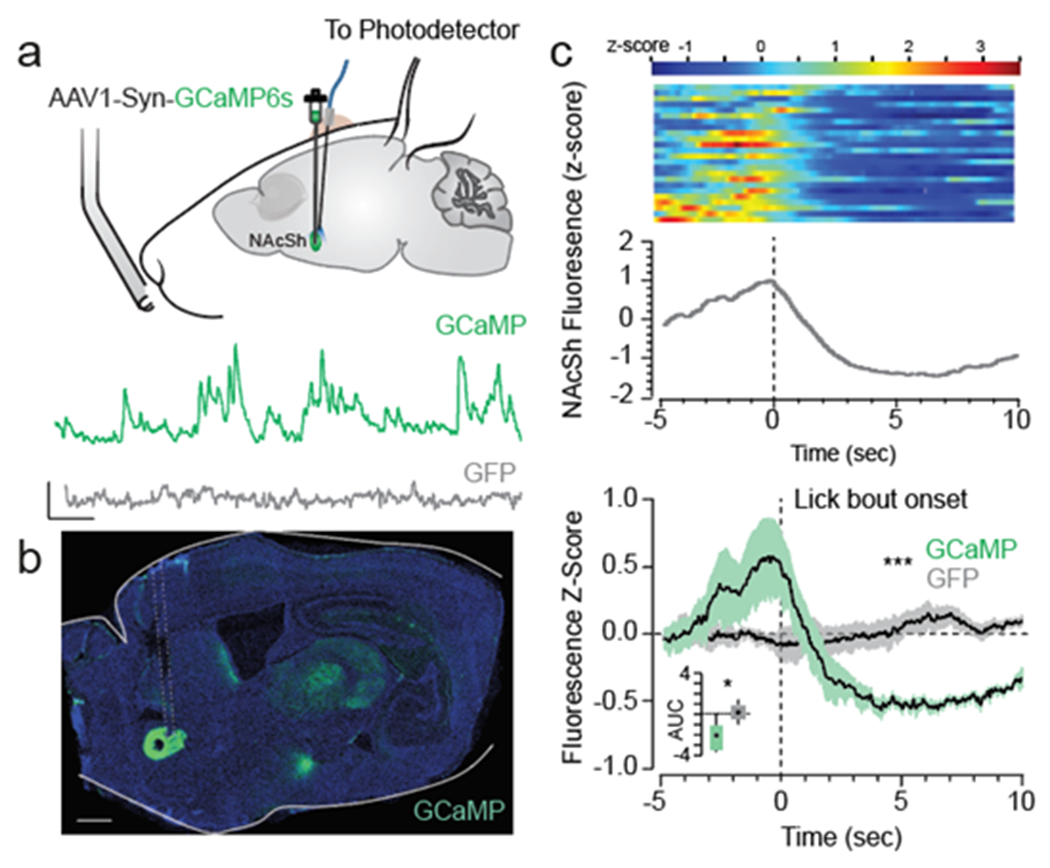
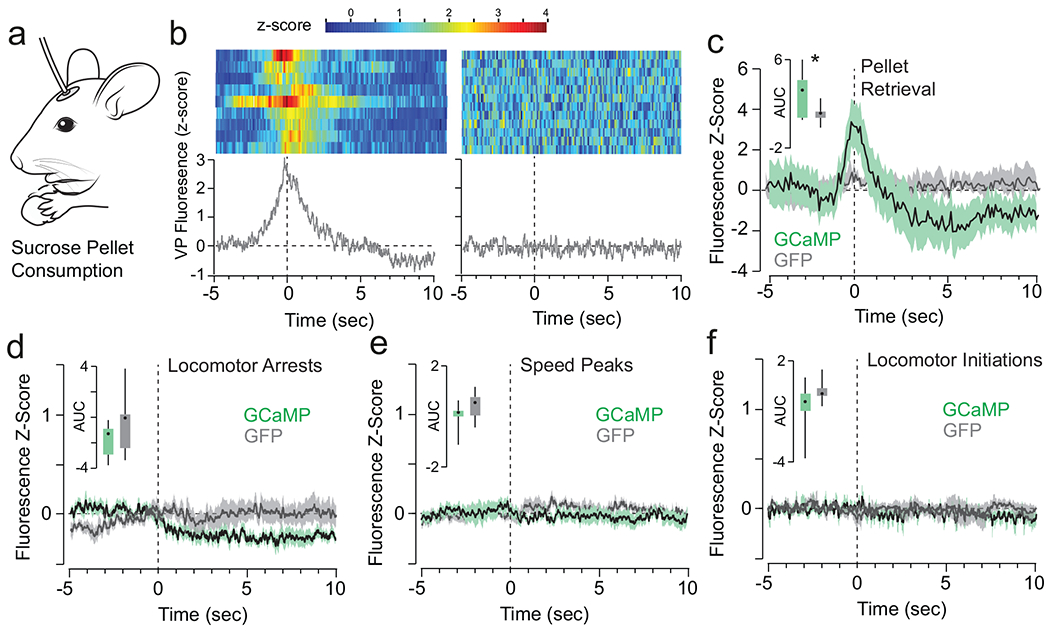
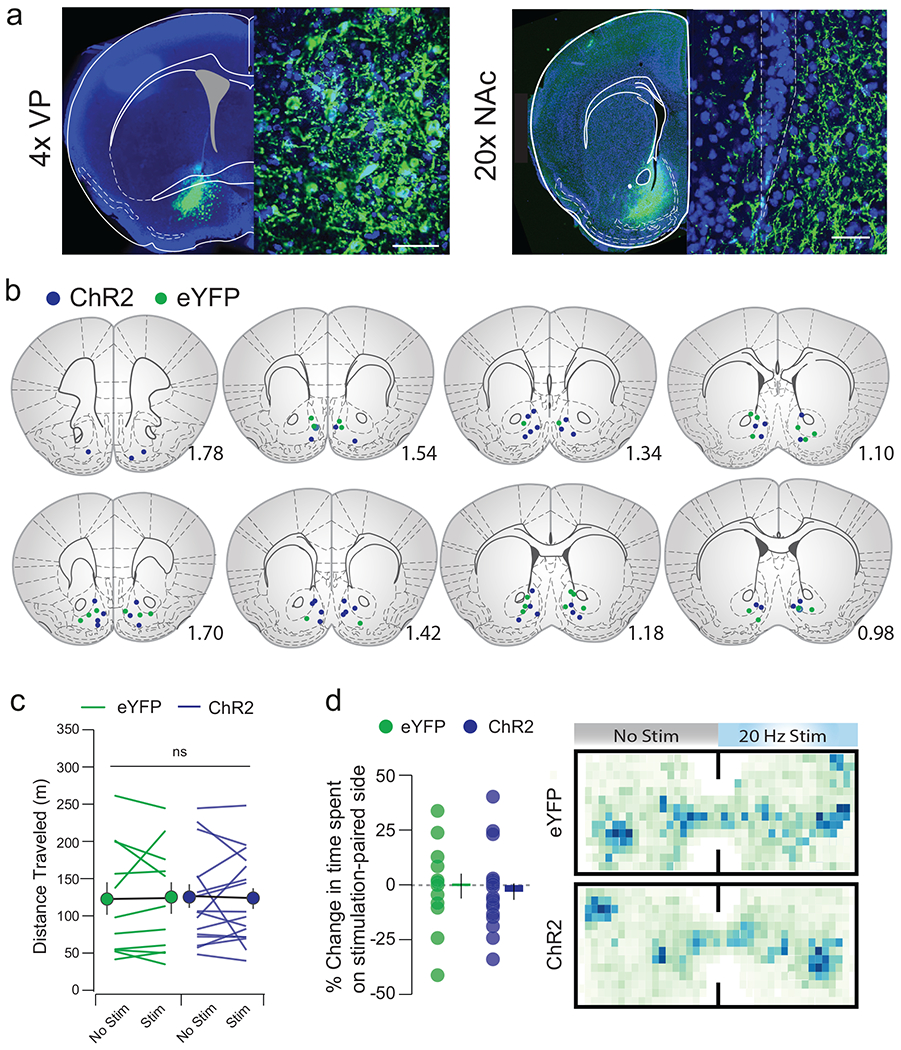
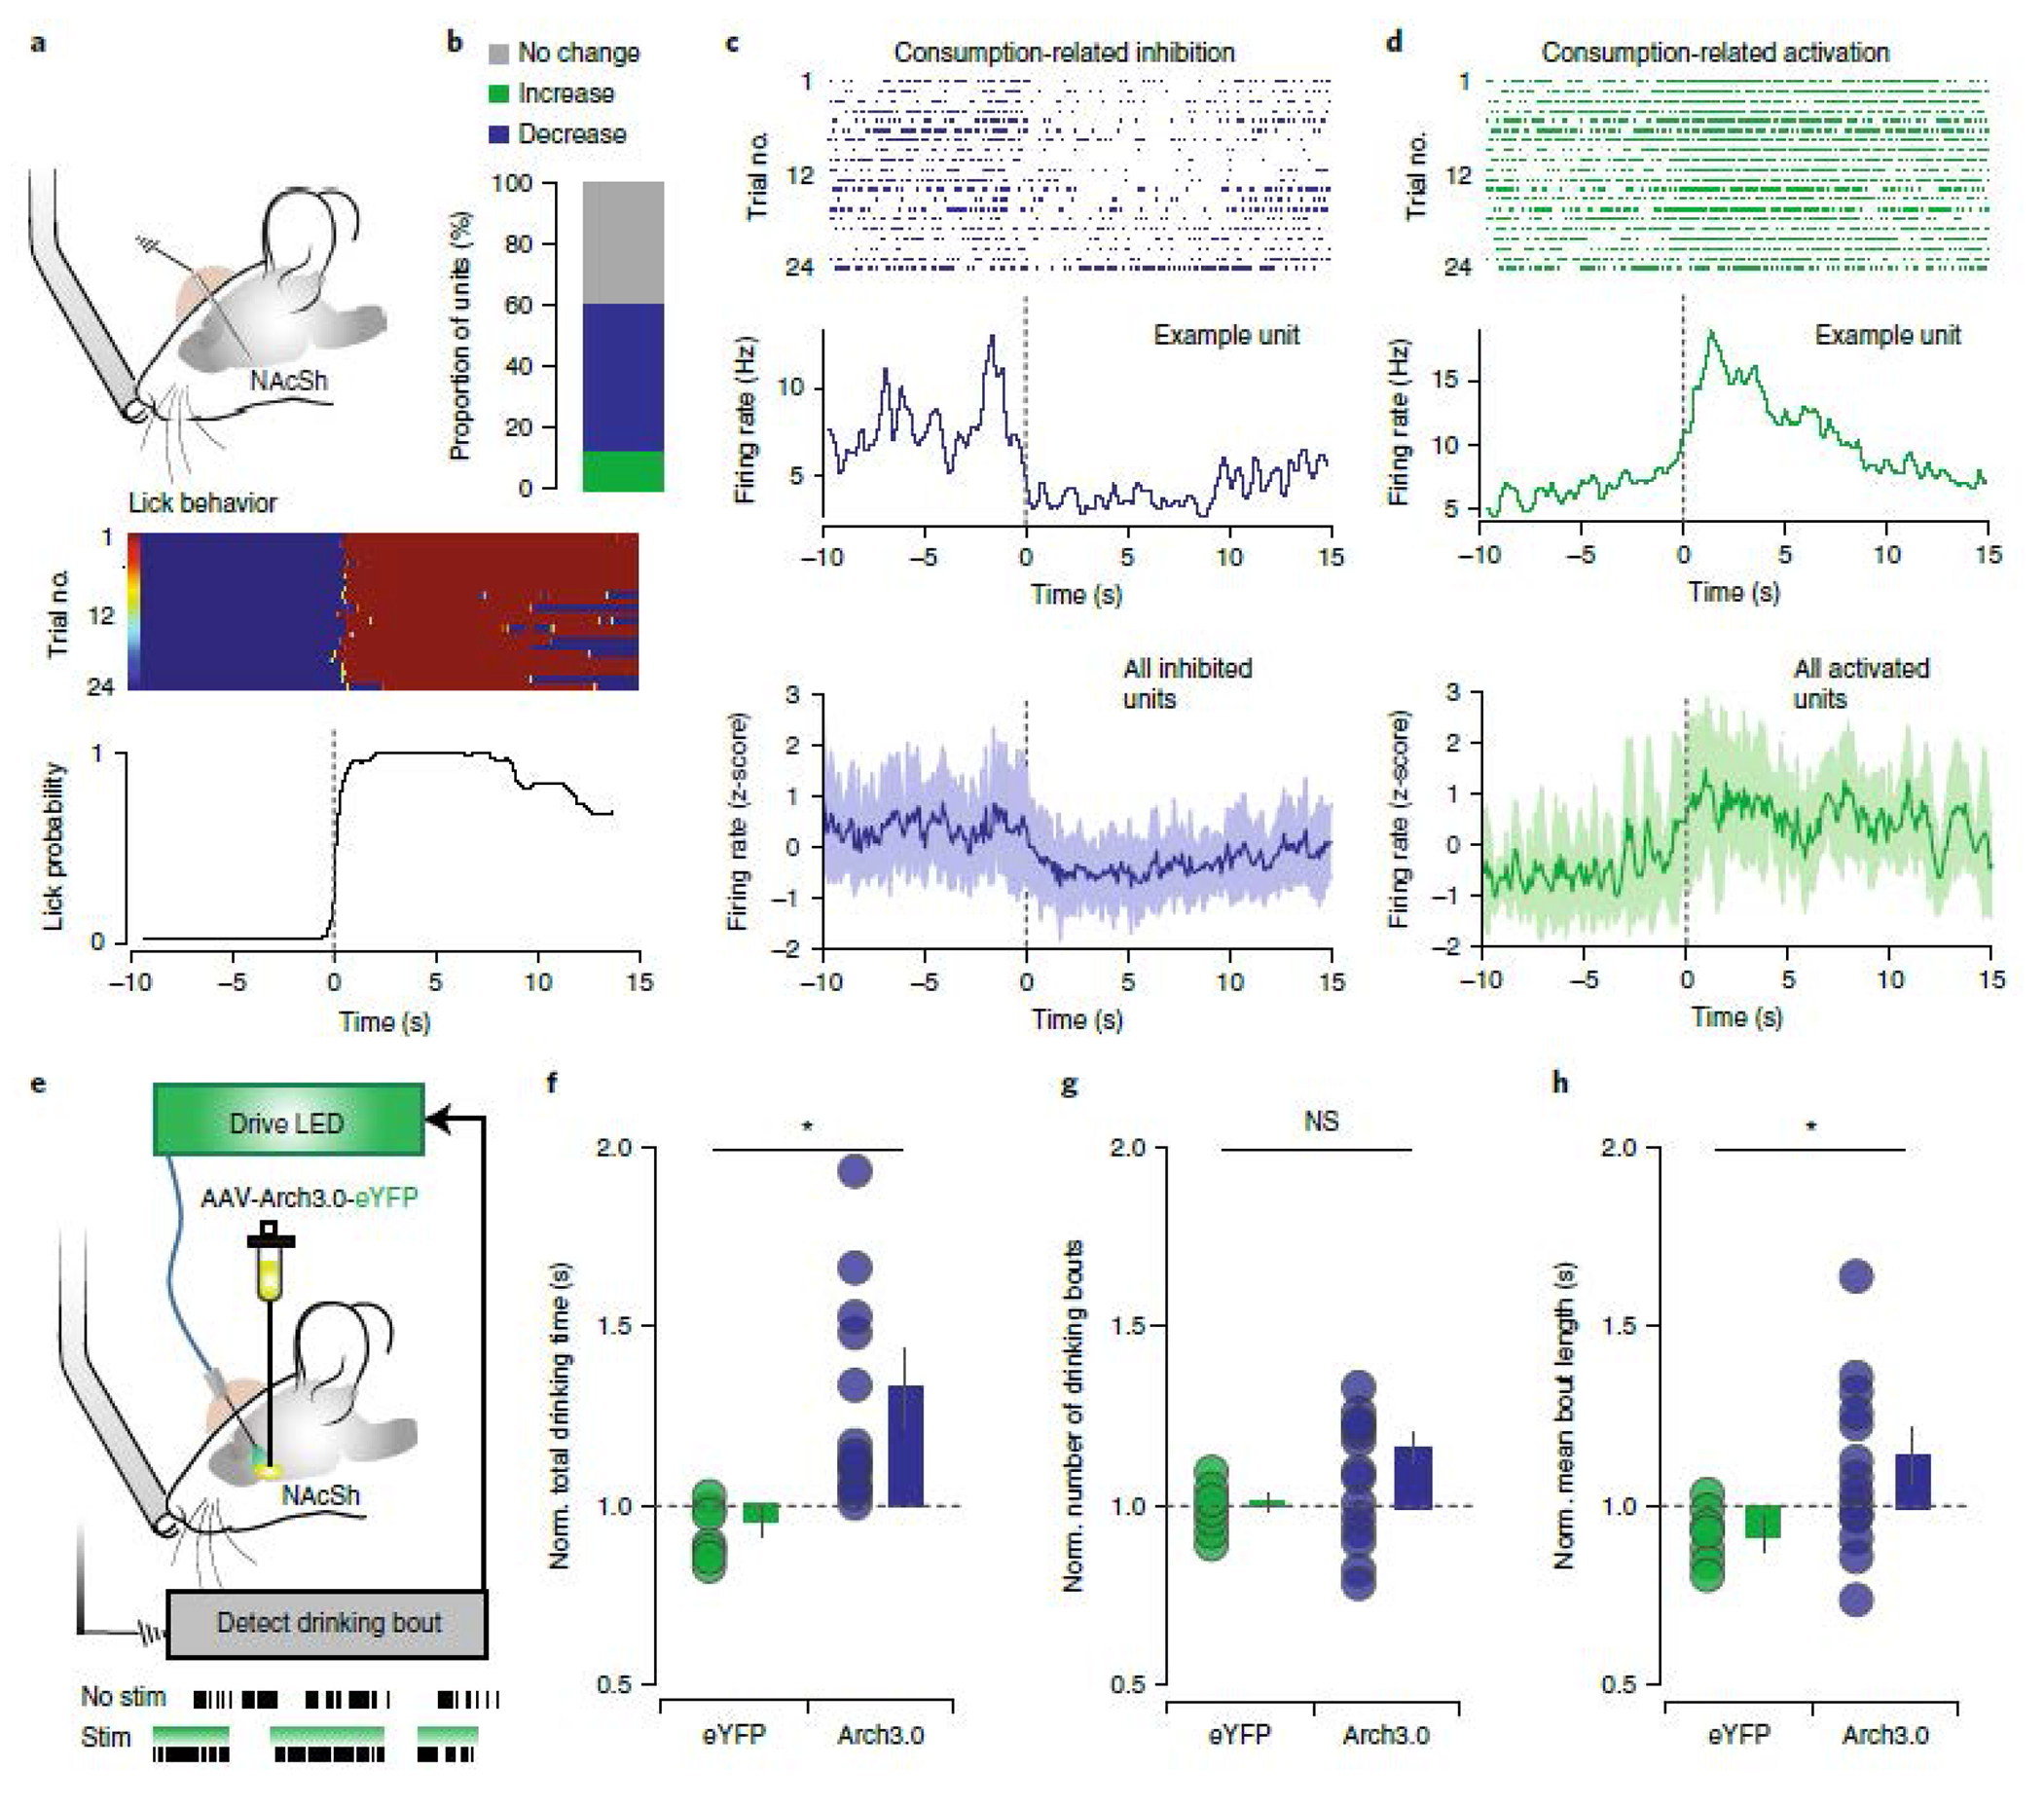
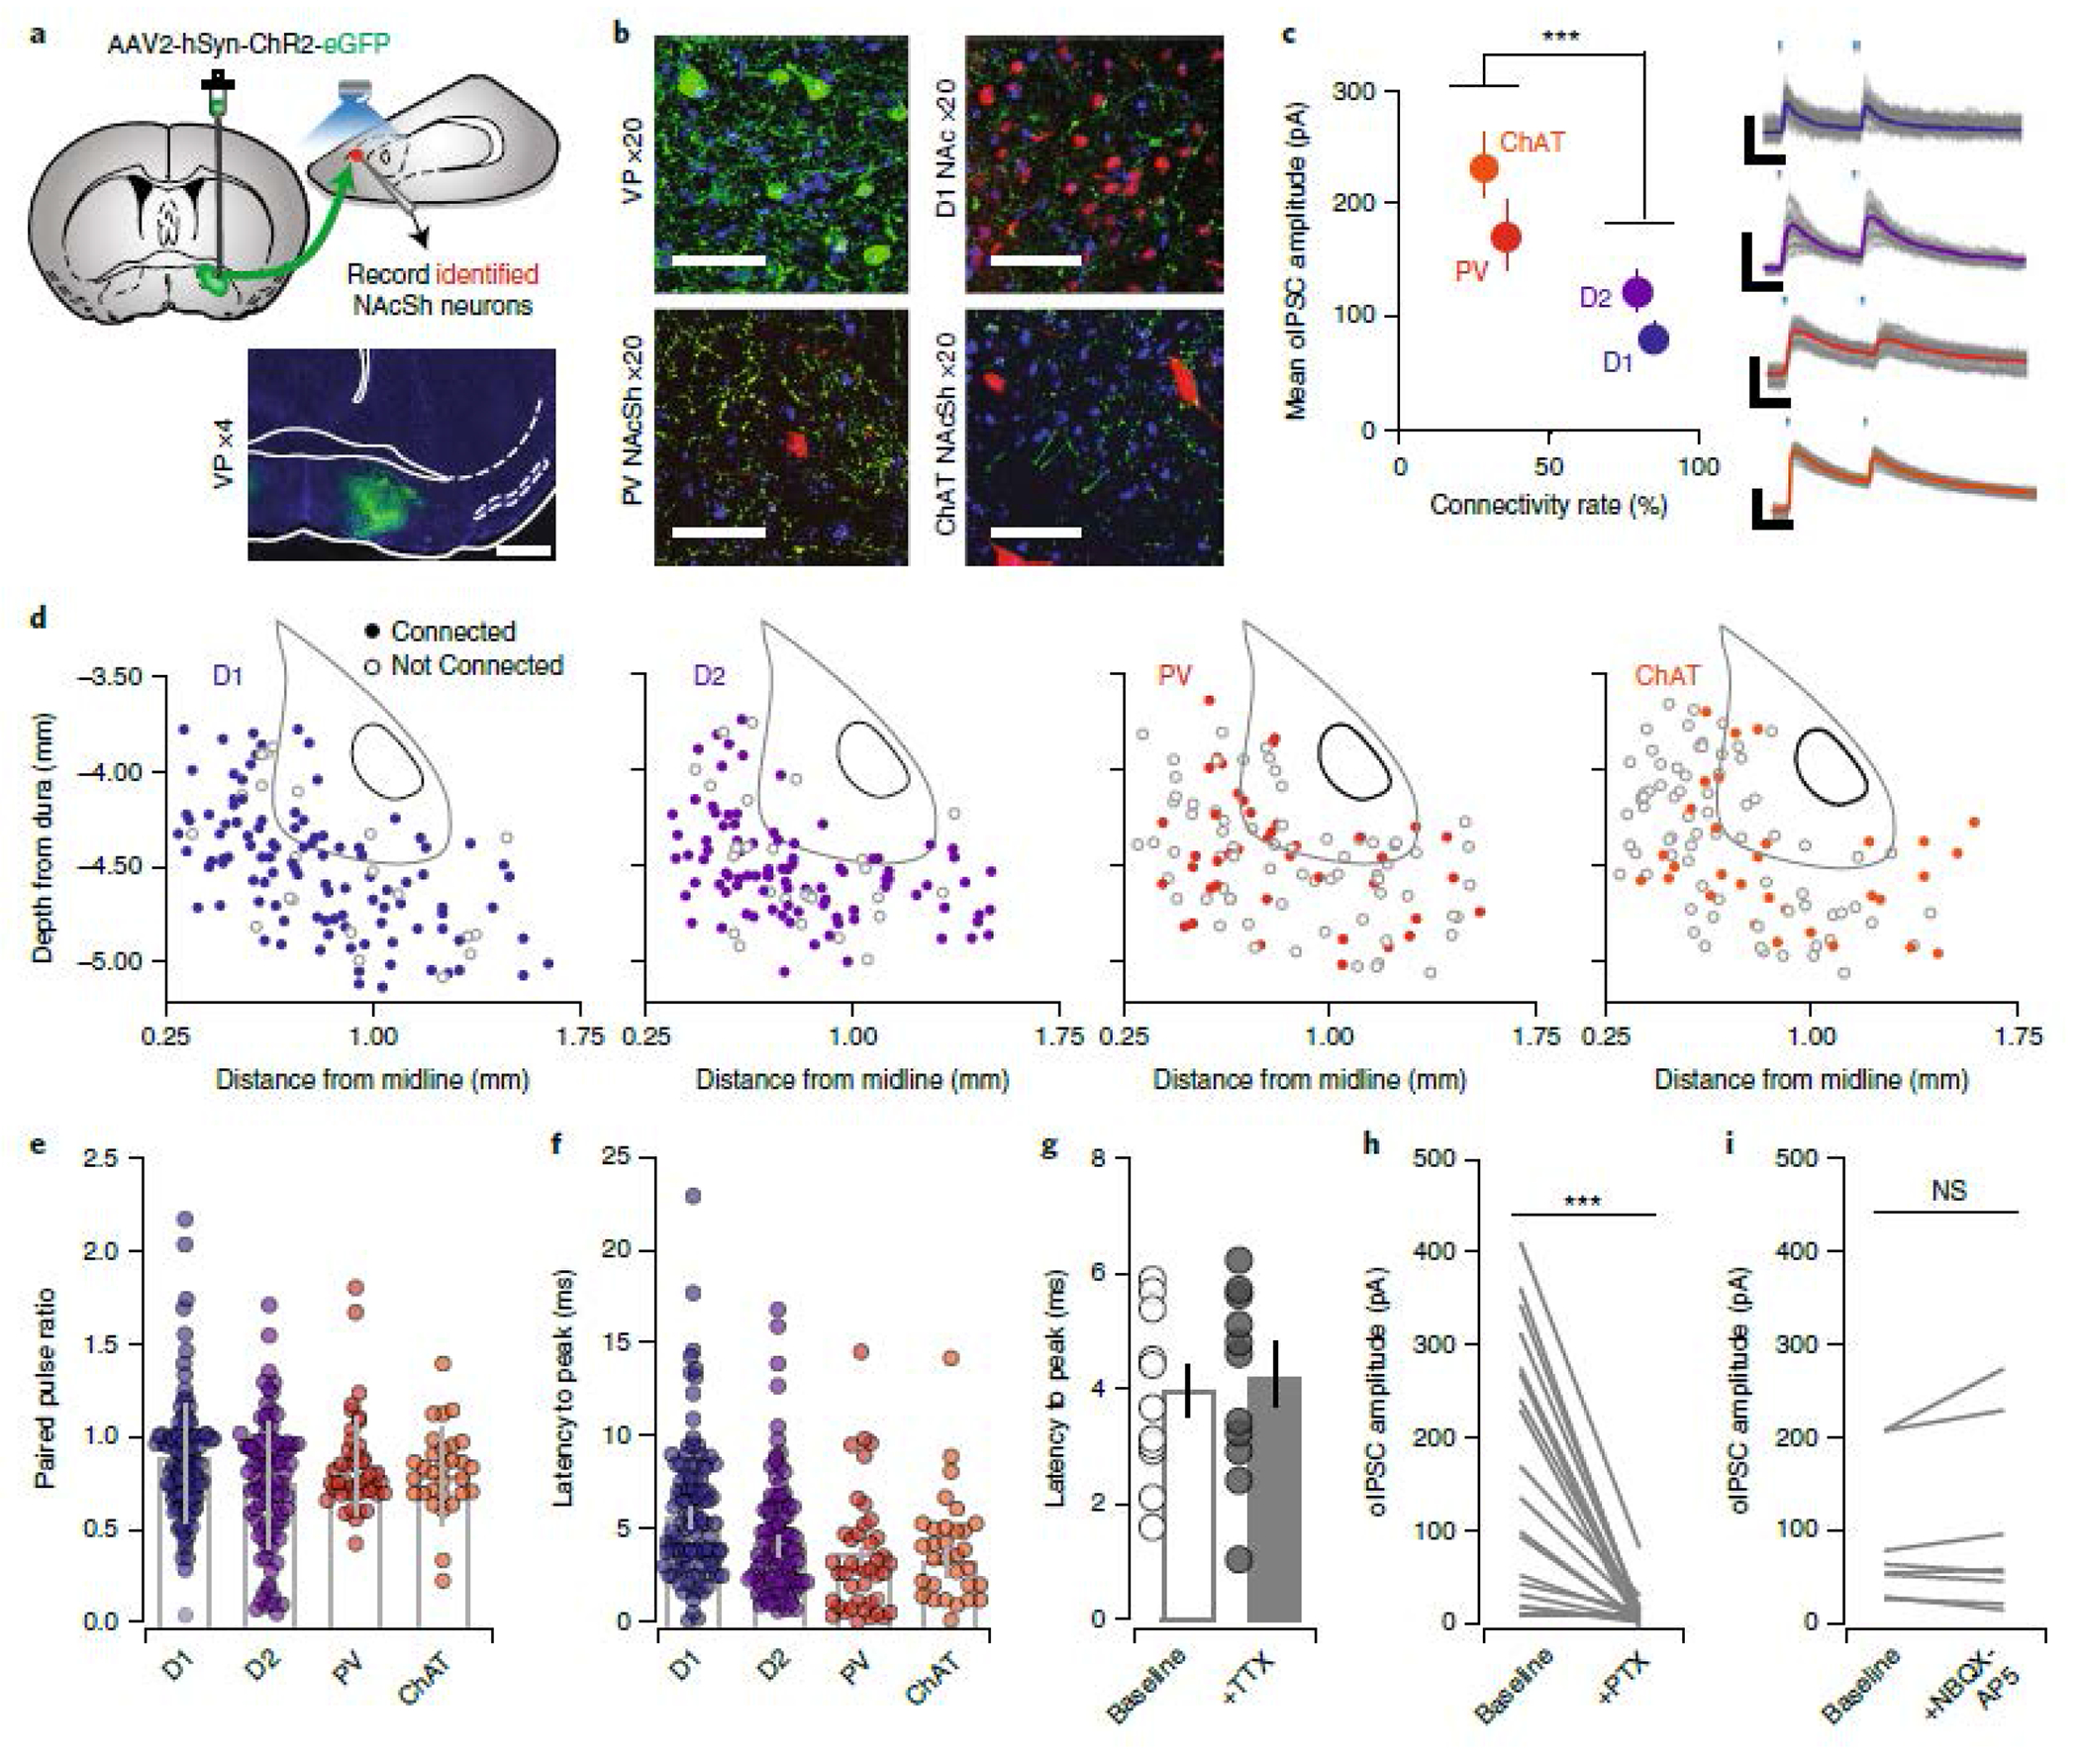
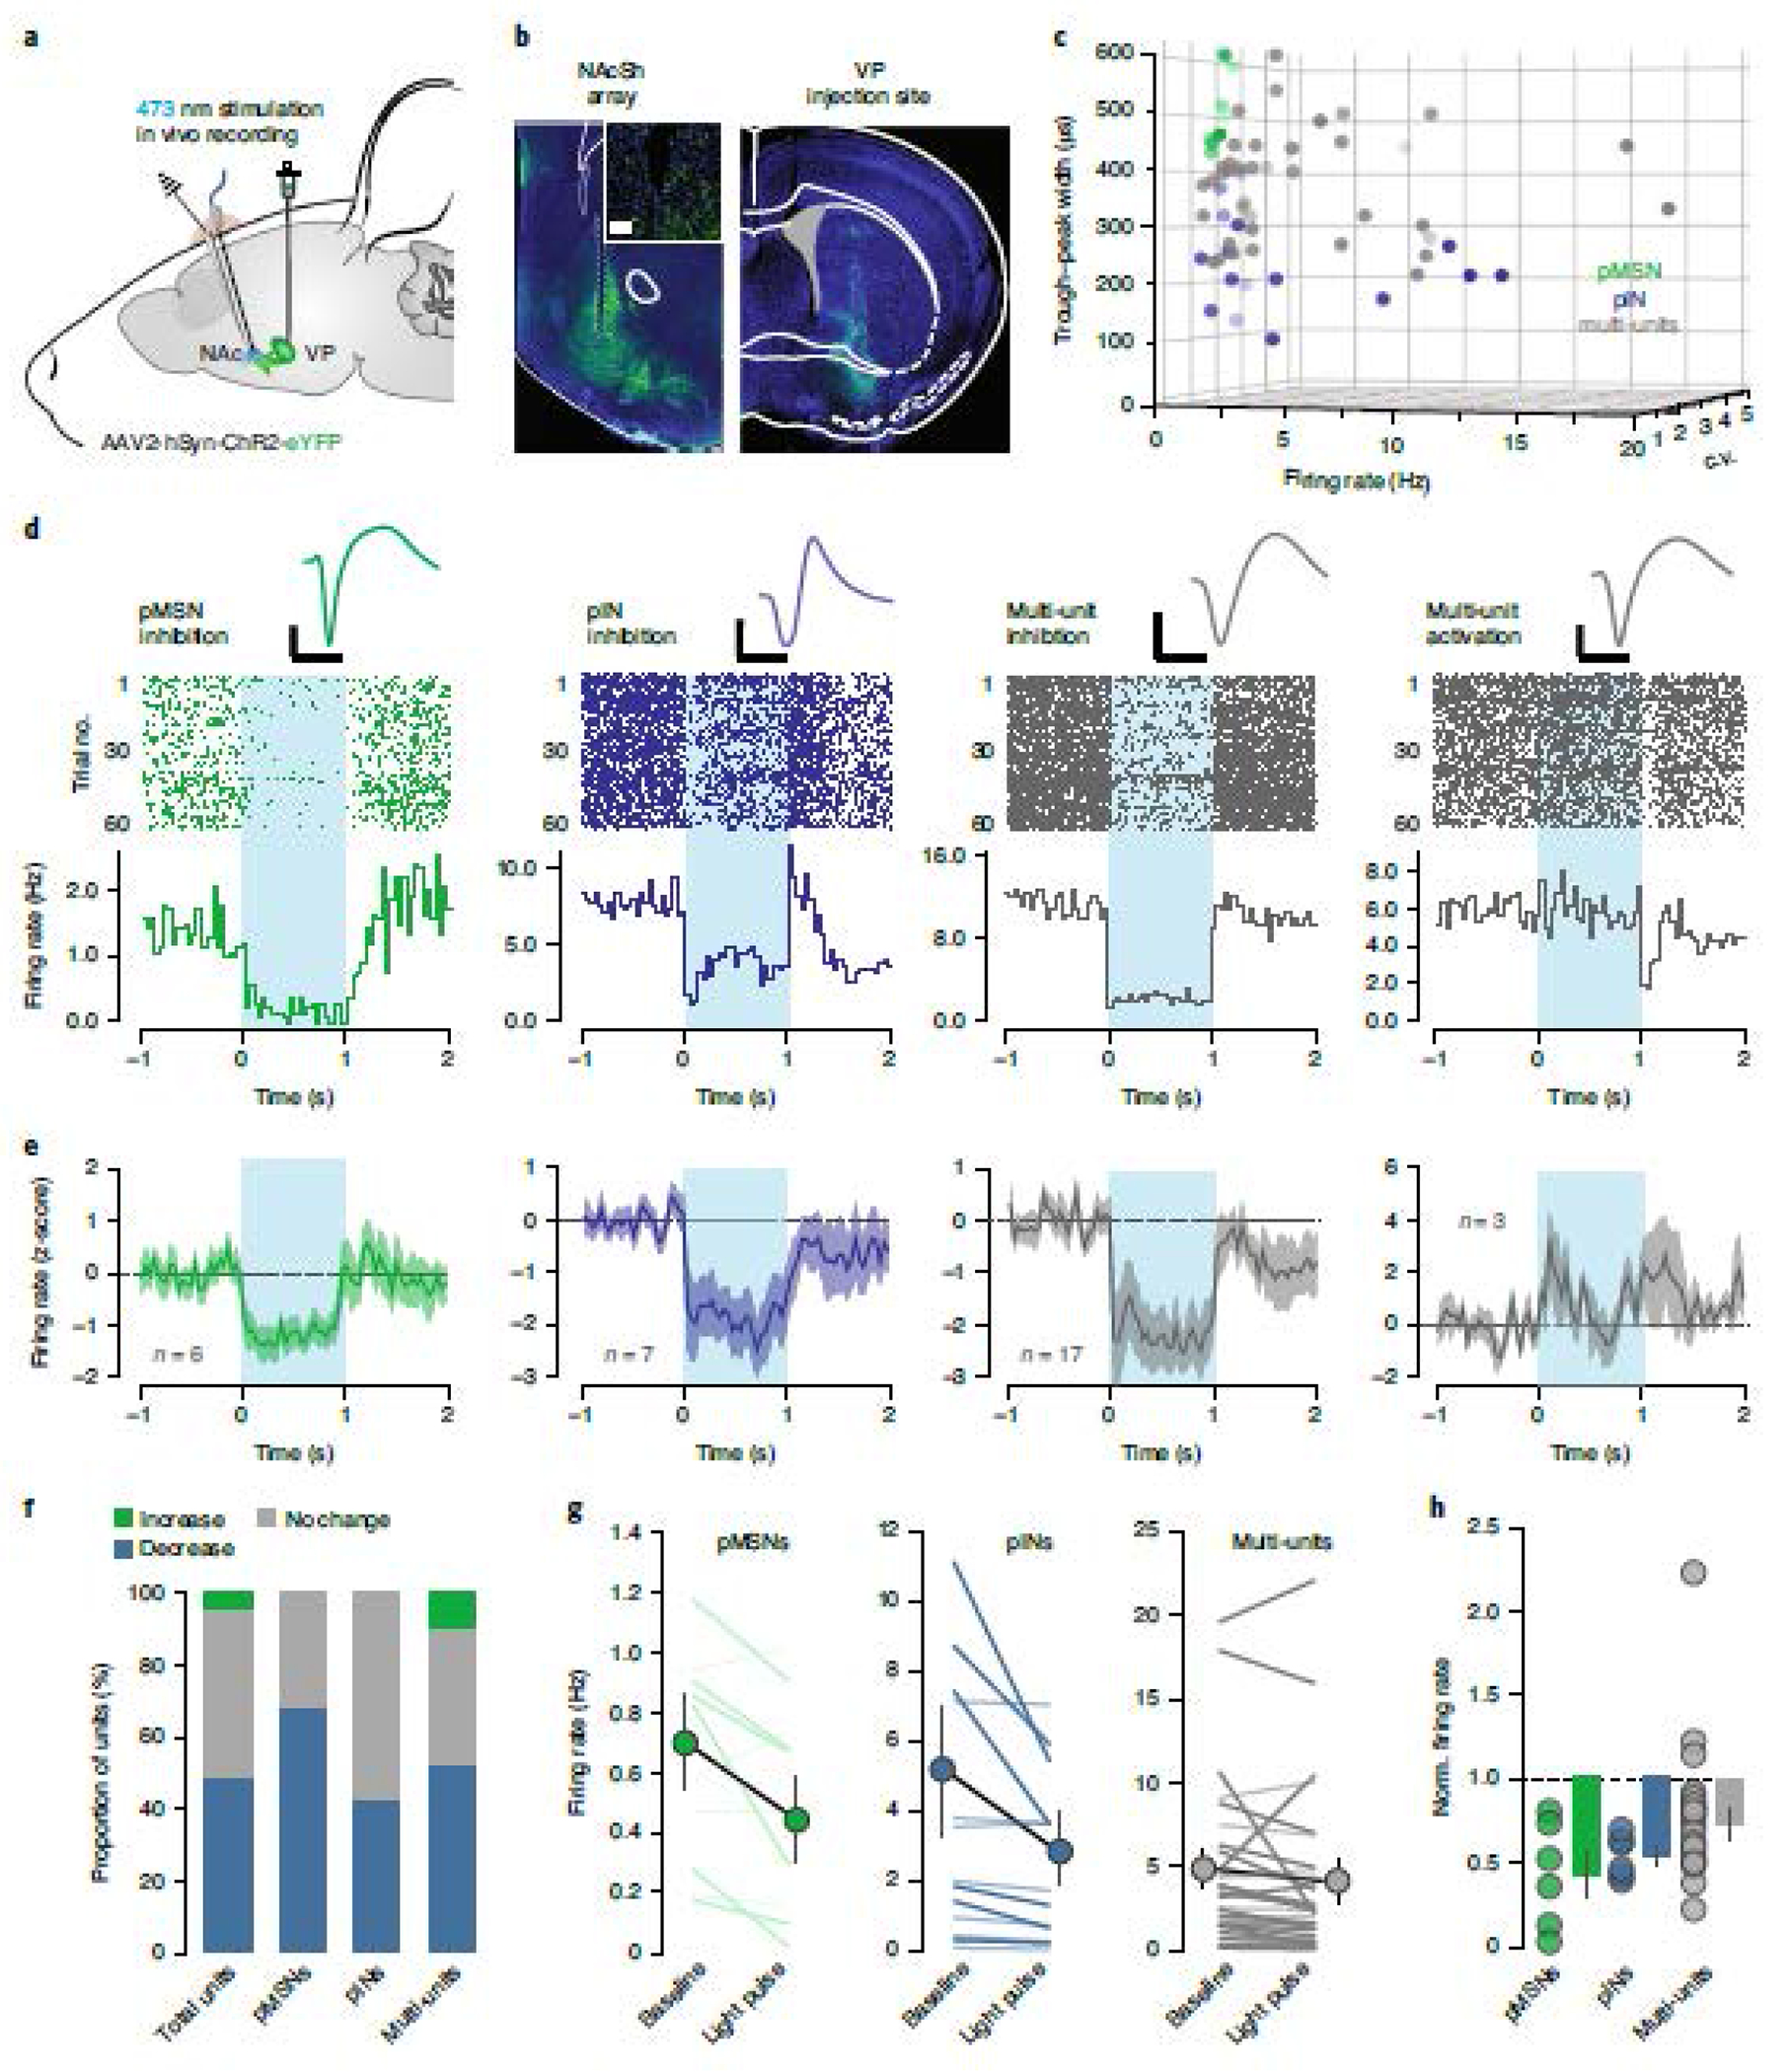
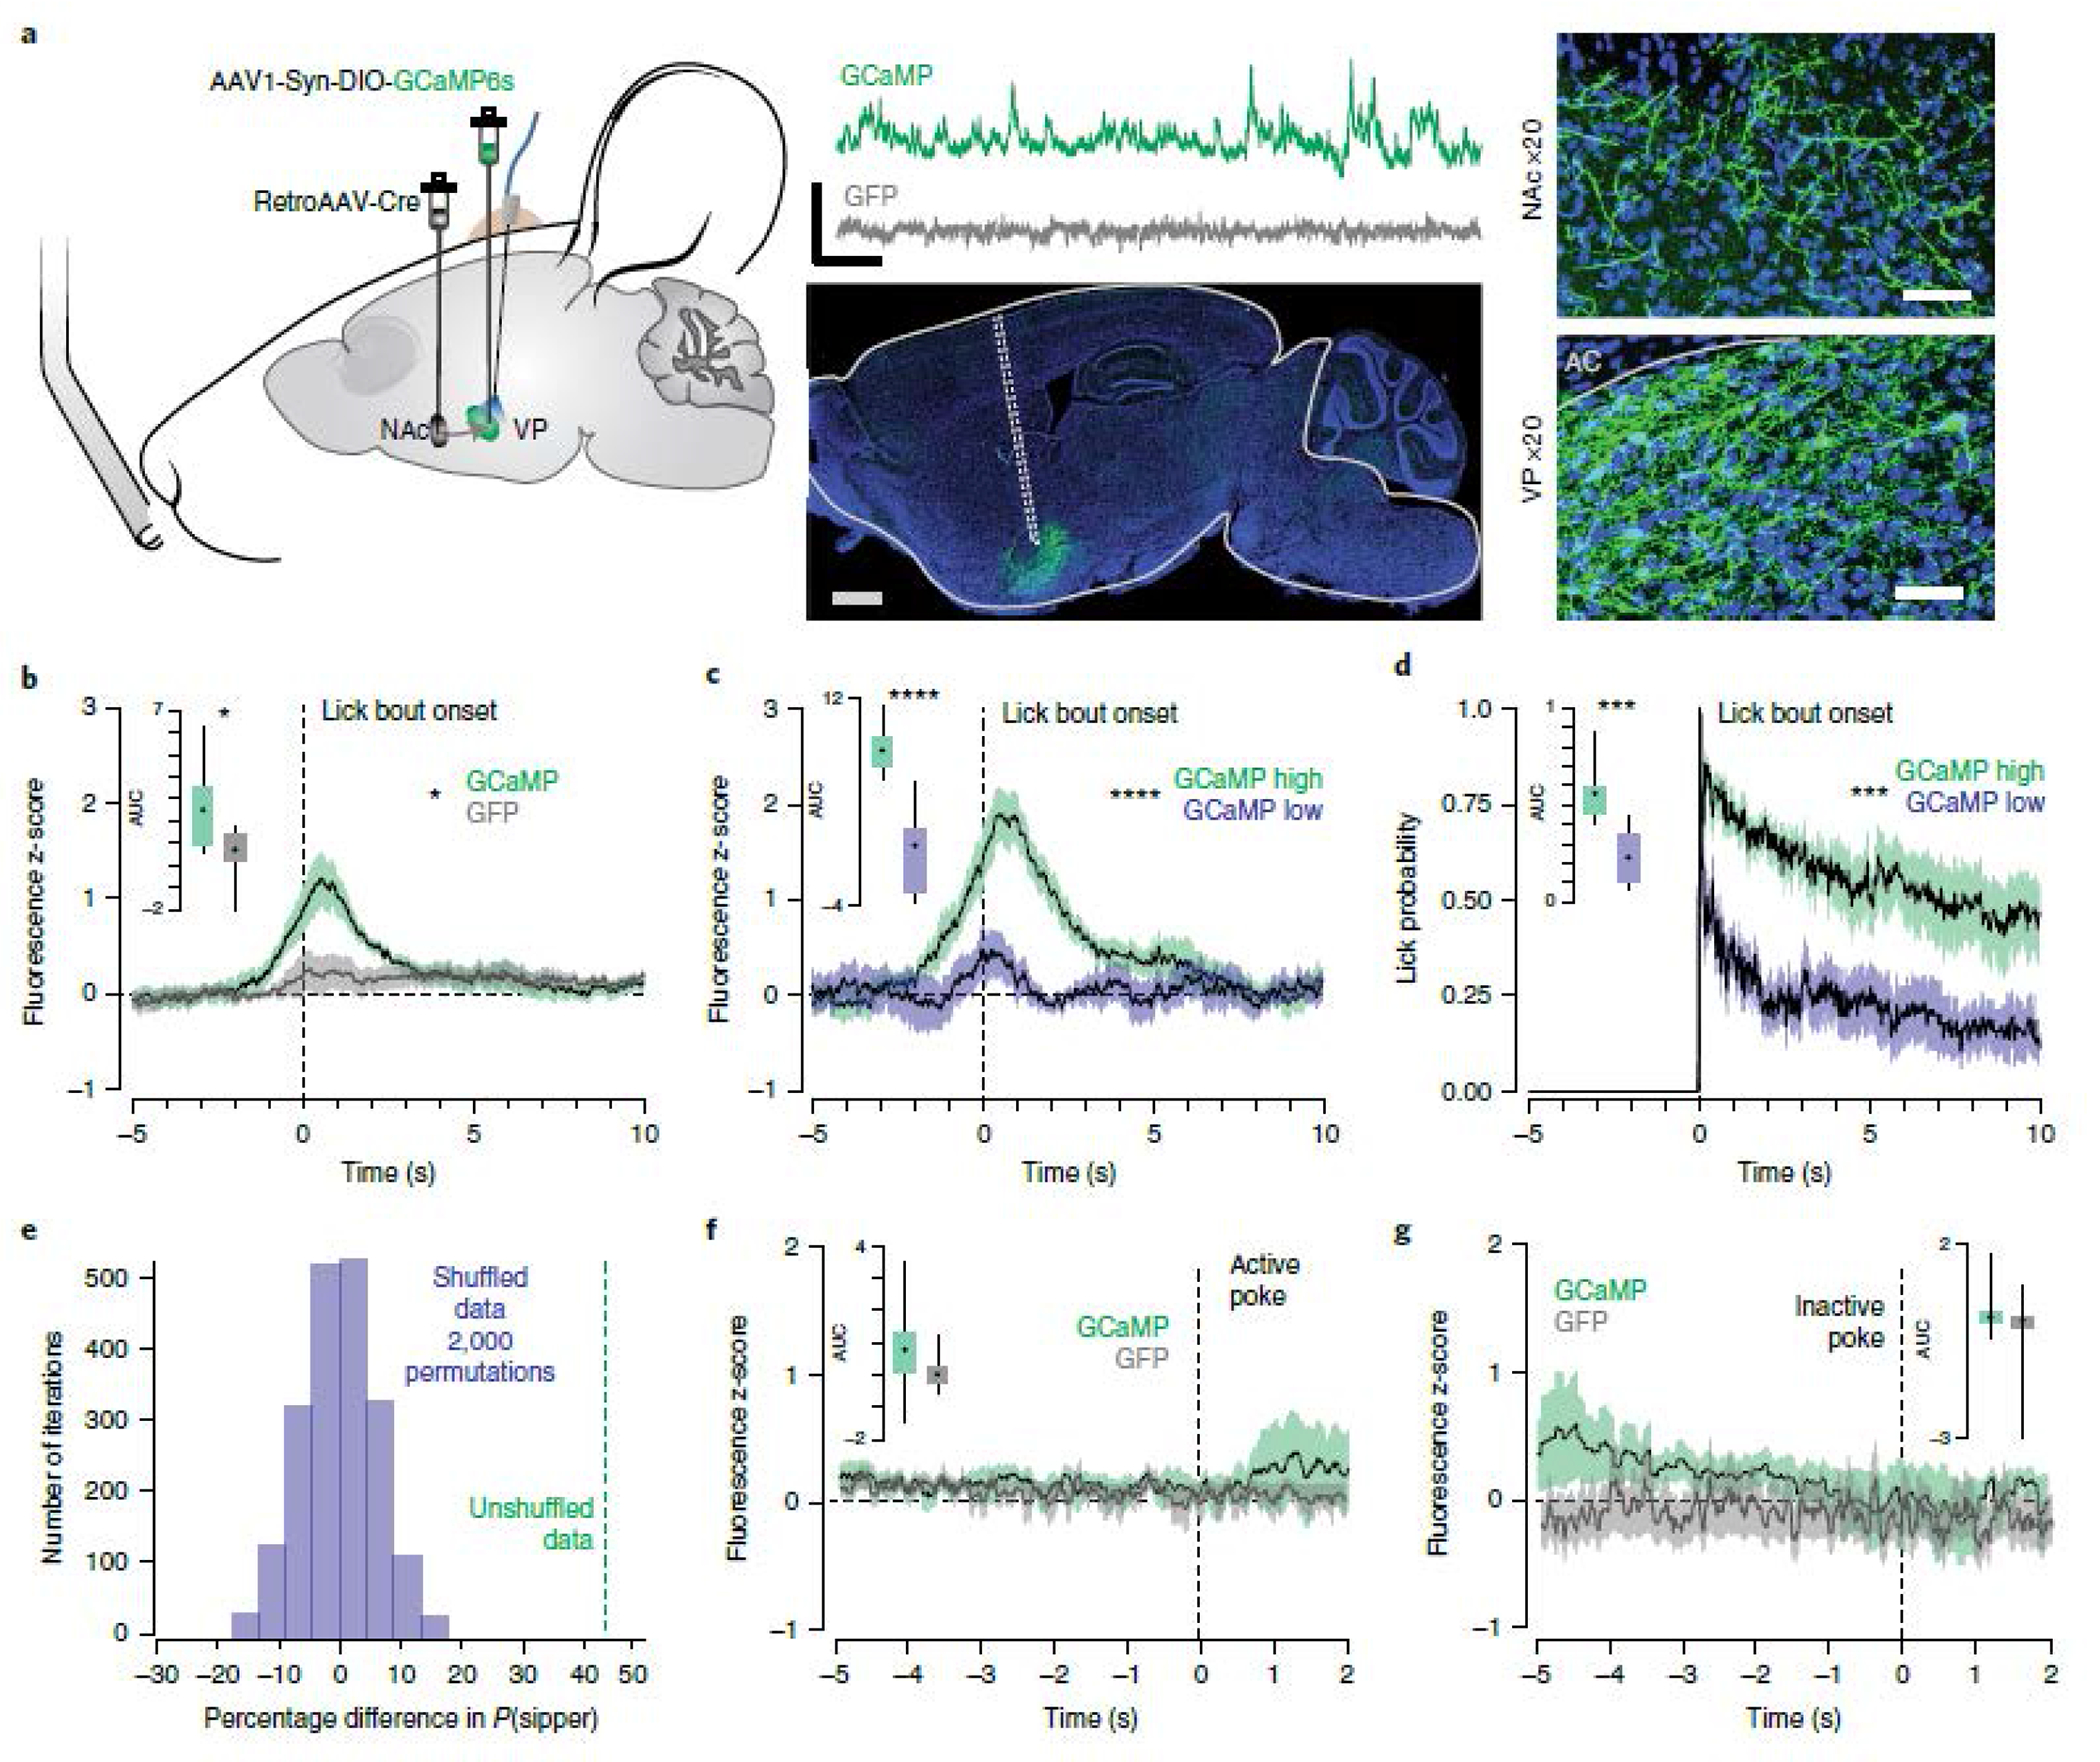
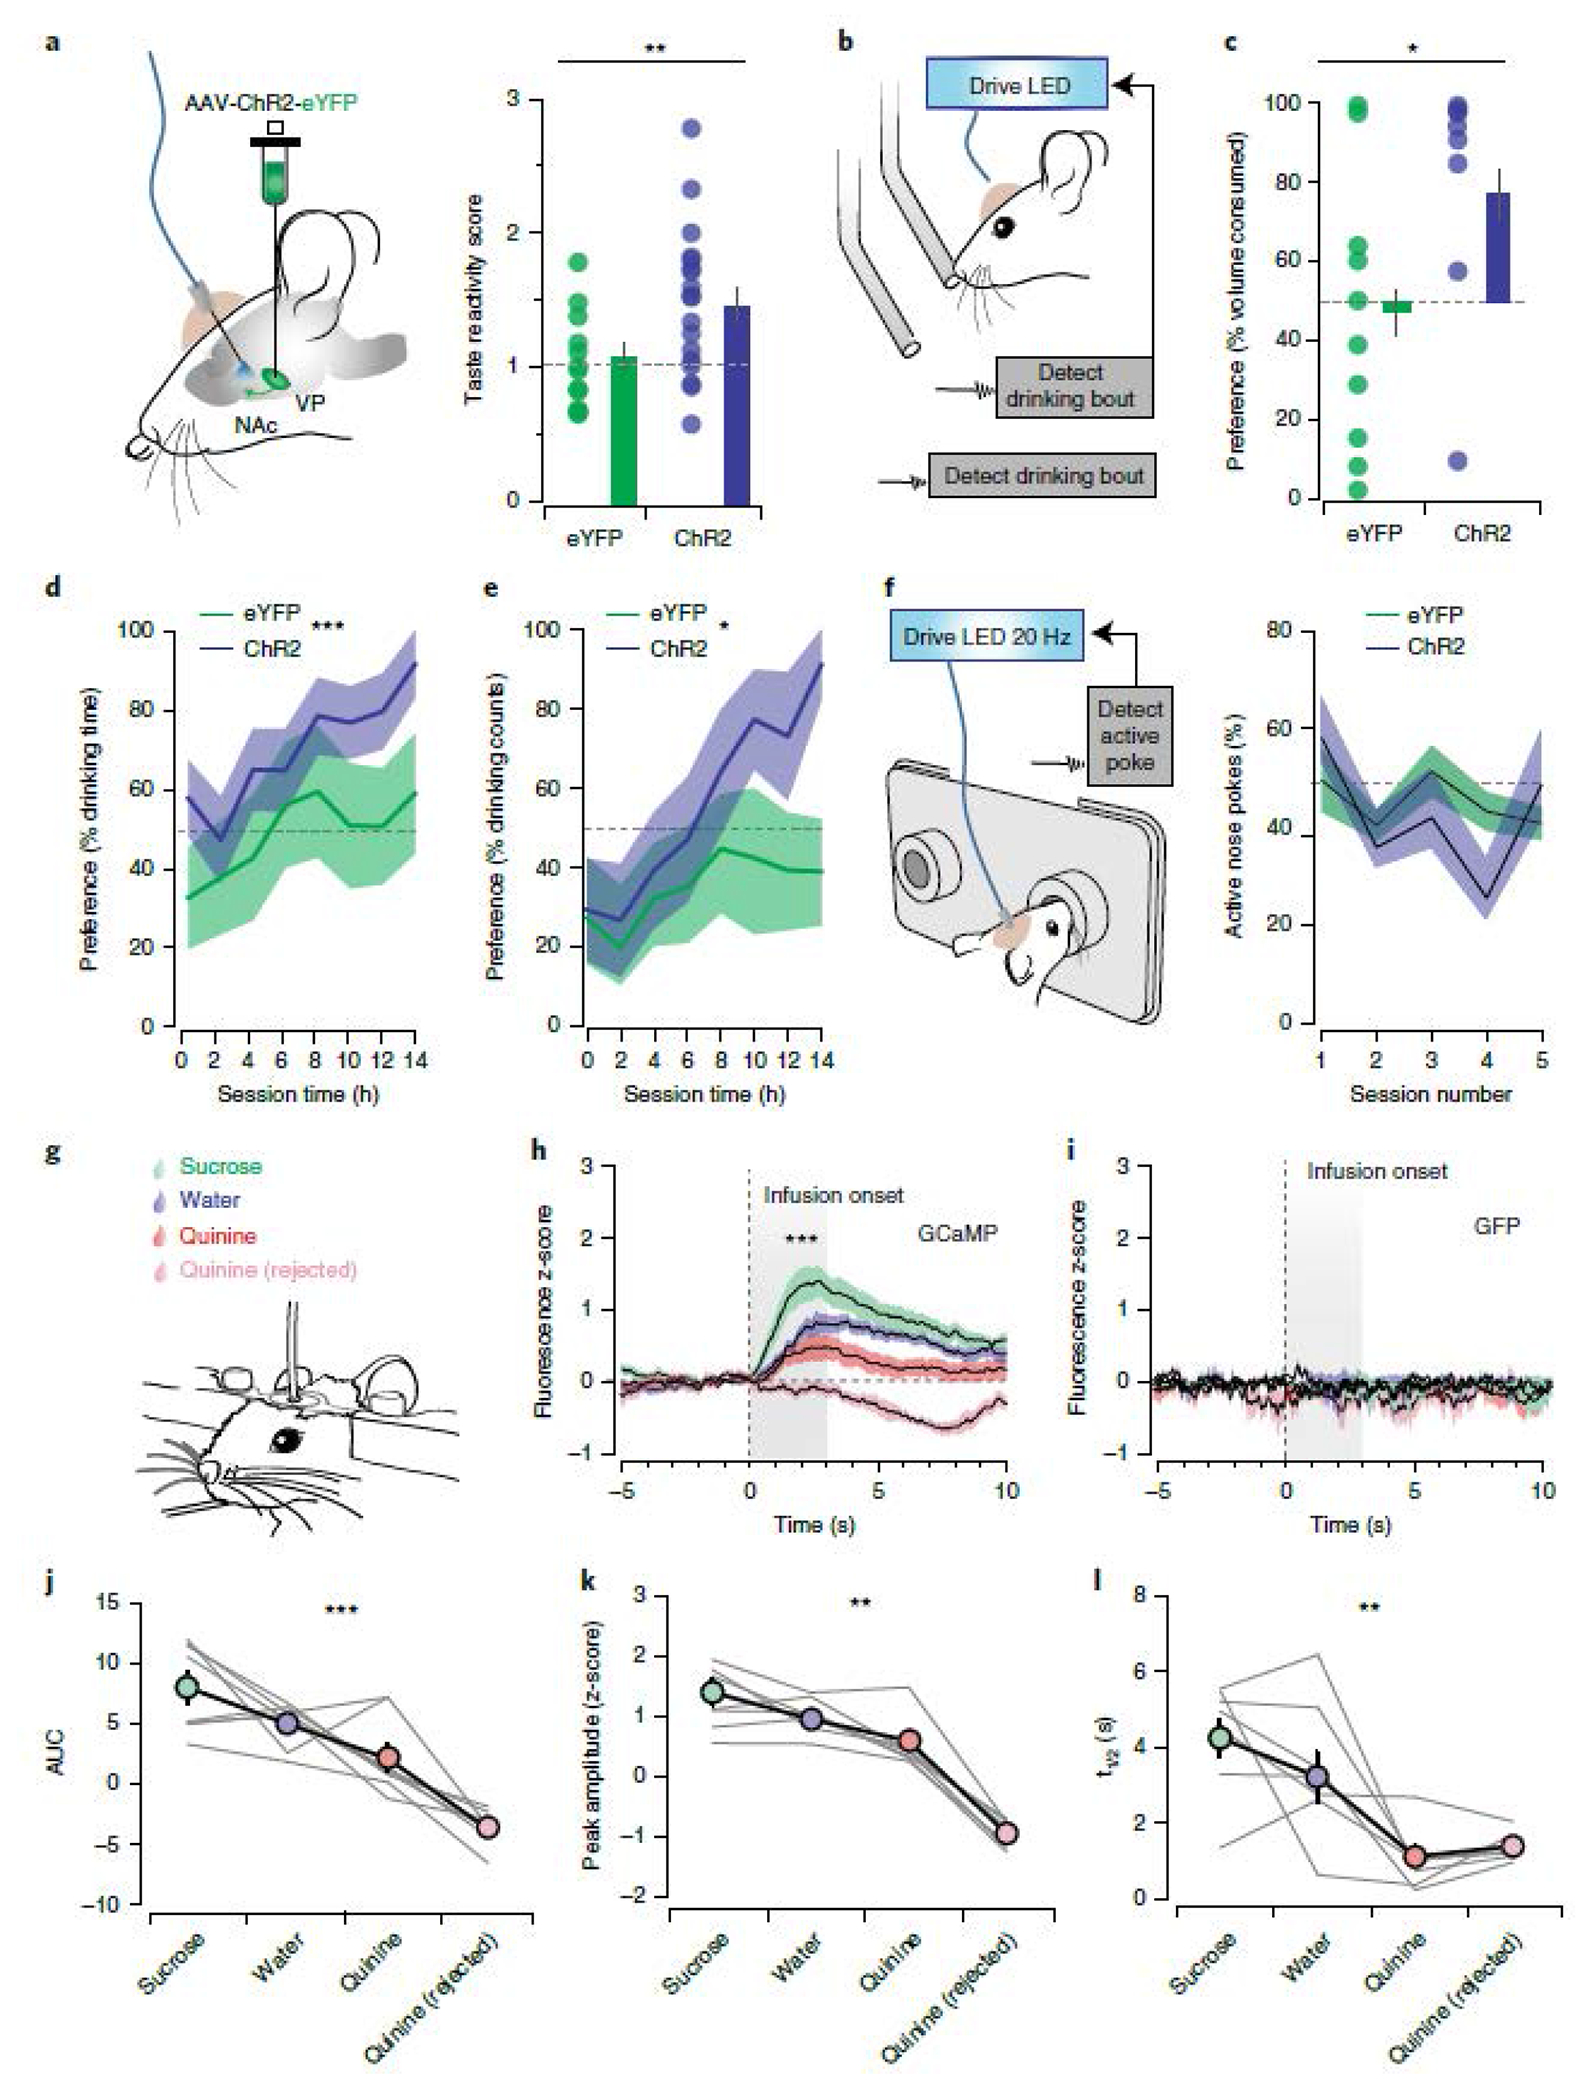
The nucleus accumbens shell (NAcSh) and the ventral pallidum (VP) are critical for reward processing, although the question of how coordinated activity within these nuclei orchestrates reward valuation and consumption remains unclear. Inhibition of NAcSh firing is necessary for reward consumption, but the source of this inhibition remains unknown. Here, we report that a subpopulation of VP neurons, the ventral arkypallidal (vArky) neurons, project back to the NAcSh, where they inhibit NAcSh neurons in vivo in mice. Consistent with this pathway driving reward consumption via inhibition of the NAcSh, calcium activity of vArky neurons scaled with reward palatability (which was dissociable from reward seeking) and predicted the subsequent drinking behavior during a free-access paradigm. Activation of the VP-NAcSh pathway increased ongoing reward consumption while amplifying hedonic reactions to reward. These results establish a pivotal role for vArky neurons in the promotion of reward consumption through modulation of NAcSh firing in a value-dependent manner.


Conflict of interest statement

Competing interests statement: Authors report no financial interests or conflicts of interest.

Figures

Extended Data Fig. 1
Extended Data Fig. 1. NAcSh units are activated by reward approach.
(a-b) Top: examples of approach-activated and approach-inhibited single units from the same mouse, aligned to drinking onset. Raster and PSTH of units activated and inhibited during reward approach; bottom = mean ± SEM. (c) Summary of approach-related responses of n=32 multi-units from 6 mice; 6.25% decrease, 25.0% increase, 68.75% no change, and normalized firing rate changes in response to approach (mean increase = 1.81 ± 0.20, mean decrease = 0.79 ± 0.09; mean ± sem (d) Euler diagram showing overlap of functionally defined NAcSh units.
Extended Data Fig. 2
Extended Data Fig. 2. NAcSh inhibition promotes reward consumption without inducing a place preference or locomotor effects.
(a) Histology showing viral infection and optic fiber placement (scale bar = 1 mm). (b) Arch stimulation increased total drinking time (Arch No Stim: 217.93±21.57 sec, Arch Stim: 267.95±22.93 sec, t14 = 3.77, p = 0.002; eYFP No Stim: 24.422±30.03 sec, eYFP Stim: 231.43±25.55 sec, t7 =1.68, p=0.14), (c) number of bouts (Arch No Stim: 48.88±4.29, Arch Stim: 53.63±4.69 sec, t14 = 2.47, p = 0.038; eYFP No Stim: 43.21±5.40, eYFP Stim: 44.13±6.00, t7 =0.88, p=0.41) and (d) mean bout length (Arch No Stim: 4.63 ± 0.37 sec, Arch Stim: 5.16±0.46 sec, t14 = 2.27, p = 0.040; eYFP No Stim: 5.836 ± 0.847 sec, eYFP Stim:5.836±0.847, t7 =2.28, p = 0.06). (e) Arch3 inhibition did not induce a place preference in a RTPP task (eYFP: −11.92±7.71%, Arch: 1.06±5.96, t19=1.22, p=0.24) or (f) alter locomotor activity in an open field task (eYFP No Stim: 320.97±13.41 m, eYFP Stim: 323.41±12.02 m, Arch No Stim: 353.12±22.46 m, Arch Stim: 374.07±21.34 m, FStimxVirus;1,19=1.33, p=0.26). n=12/15, eYFP/Arch3). All data is represented as mean ± IQ range. *p<0.05, **p < 0.01
Extended Data Fig. 3
Extended Data Fig. 3. Retrograde viral tracing reveals vArky fibers preferentially in the NAcSh.
(a) rAAV-Cre was injected in the NAcSh, DIO-ChR2 was injected into the VP and serial sections were taken of known VP projection sites. (b-c) 5x and 20x overview of ChR2-labeled terminals in the NAcSh and infected cell bodies in the VP (n=4 sections/brain region, 6 mice). (d) 10x representative images of serial sections (top) and 20x confocal images of canonical VP projection areas. (e) Quantification of total axonal length, normalized to VP. Intensity and axonal length in the NAcSh was significantly greater than any area examined. Abbreviations: Nucleus accumbens shell (NAcSh), ventral pallidum (VP), medial prefrontal cortex (mPFC), orbitofrontal cortex (OFC), basolateral amygdala (BLA) lateral habenula (LHb), mediodorsal thalamus (MDThal), subthalamic nucleus (STN), ventral tegmental area (VTA). F=148.4 p<0.001, Ffluorescence=148.4, p = 0.0016 with Bonferroni correction for multiple comparisons applied. Data presented as mean ± IQ range. Scale bars=25 μm.
Extended Data Fig. 4
Extended Data Fig. 4. Topography of release properties of VP inputs to NAcSh.
(a) Merged fluorescent image of recorded tomato-expressing neuron adjacent to EYFP-labeled terminals from the VP during patch-clamp experiments. (b) 4x image of ChR2-injection site in VP and terminal fields in the NAc in each of three reporter lines. Amplitude (c) and PPR (d) of oIPSC expressed as location of recorded neuron within the NAcSh in D1-MSNs (n=118 cells / 11 mice), D2-MSNs (n=117 cells / 12 mice), PVs (n=112 cells / 12 mice), and CINs (n=104 cells / 10 mice), scale bar = 50 μM.
Extended Data Fig. 5
Extended Data Fig. 5. Properties of NAcSh neurons and in vivo responses to activation of vArky terminals.
(a) Location of recording arrays in the NAcSh. (b-d) Units were classified according to peak-valley width (n = 9 pMSNs, 14 pINS, 32 multi-units from 6 mice, pMSN: 462.8±27.96 μs, pIN: 242.01±26.27 μs), CV (pMSN: 1.77±0.254, pIN: 1.23±0.17) and firing rate (pMSN: 0.40±0.11 Hz, pIN: 3.53±1.20 Hz, data shown as mean ± IQ range). (e-h) representative waveform and PSTH of single neural examples in response to 15 ms of vArky stimulation. Scale bar = 500μs, 50μV.
Extended Data Fig. 6
Extended Data Fig. 6. Lick behavior of individual subjects, as a function of high- vs. low-vArky calcium signals.
(a) Single-subject heat map of arkypallidal fluorescence signal across high GCaMP (top) and low GCaMP (bottom) trials aligned to reward consumption onset. (b) Lick behavior of high- vs. low-vArky calcium trials of all individual GCaMP-injected subjects. (c) Single-subject heat map of fluorescence signal of GFP mouse. (d) Lick behavior of high- vs. low-VP signal trials of all GFP-injected subjects, (e) Average lick behavior of high and low VP signal trials of all GFP-injected mice (AUC lick probability high signal trials: 3.16±0.65, AUC lick probability low signal trials: 2.94±0.49, mean ± IQ range).
Extended Data Fig. 7
Extended Data Fig. 7. Calcium activity in the NAcSh decreases upon reward consumption onset.
(a-b) GCaMP injection in the NAcSh, representative traces (scale bar: 10 sec, 1 z-score) and histology (n=6/6 GCaMP/GFP mice, scale bar = 1 mm). (c) Single-subject heat map of NAcSh GCaMP signal and (d) combined signal from all subjects (n=6/6 GCaMP/GFP) aligned to reward consumption onset (mean AUC GCaMP: −2.58±0.65, GFP: −0.14±1.40, t11=2.87, p=0.015, mean ± IQ range).
Extended Data Fig. 8
Extended Data Fig. 8. vArky calcium activity increases during sucrose pellet consumption but not locomotor events.
(a) vArky fluorescence signal was recorded during free access consumption of sucrose pellets. (b) Representative heat map and normalized calcium signal aligned to sucrose pellet retrieval in GCaMP (left) and GFP (right) expressing mice. (c) AUC was significantly greater in the two seconds following pellet retrieval in GCaMP-expressing mice relative to GFP controls (AUC GCAMP: 3.687 ± 0.756, AUC GFP: 0.238 ± 1.378, t16=2.1944, p=0.0433). (d-f) Fluorescence responses aligned to locomotor arrests (mean AUC GCaMP: −1.467±0.2994, GFP: −0.3198±1.071, t16=1.127, p=0.27), locomotor initiations (n=704/677 events, AUC GCaMP: −0.818±0.638, GFP: −0.619±1.210, t16=0.150, p=0.88) and peaks in locomotor speed (n=1309/1221 events, mean AUC GCaMP: 0.1294±0.2945, GFP:0.4977±0.3022, t16=0.873, p=0.396). Data mean ± IQ range.
Extended Data Fig. 9
Extended Data Fig. 9. Histological verification, ICSS and RTPP behavioral controls for vArky optogenetic stimulation.
(a) Infection site in VP and terminal fields in NAcSh; scale bar=50μM. (b) Verified placements of optic fibers. (c) Distance traveled in an open field task (n=12 eYFP, 18 ChR2, eYFPNoStim: 121.62±22.63, eYFPStim : 122.15±21.75, p=0.96, ChR2NoStim: 124.48±16.22, ChR2Stim: 121.83±14.18, Fstim•virus=0.050, p=0.825). (d) Preference for the stimulation-paired side of a chamber in a real-time place preference task (n=12 eYFP, 18 ChR2, eYFP: −4.36±4.32%, ChR2: −1.13±5.83) and representative heatmaps. *p<0.05, **p<0.01. All data presented as mean ± sem.
Extended Data Fig. 10
Extended Data Fig. 10. Input-output curves of vArky neuronal responses to current injections ex vivo.
(a) Ai14 reporter mice were injected with retro-cre in the NAcSh to selectively label vArky neurons. (b) Merged fluorescent image of Ai14-expressing vArky neurons during patch-clamp experiments (n=12 neurons from 9 mice). (c)The mean number of action potentials per second in response to successive current injection (0 to 200 pA) is plotted (error bars: sem). (d) Representative traces in response to 50, 100, 150, and 200 pA current injections. Scale bar: 10mV, 100ms.
Figure 1.
Figure 1.. NAcSh inhibition is causally related to reward consumption.
(a) In vivo recording of the NAcSh during free-access paradigm (n=32 multi-units, 6 mice). (b) Summary of drinking-related responses of NAcSh units; 35.71% decrease, 10.71% increase, 53.57% no change. (c-d) Top: examples of reward-inhibited and reward-activated single units from the same mouse, aligned to drinking onset. Raster and PSTH of units inhibited (C) and activated (D) during reward consumption; bottom = mean ± SEM. (e) Closed-loop optogenetic inhibition of NAcSh neurons during reward consumption (n=12/15 eYFP/Arch3). (f-h) Optogenetic inhibition increased total drinking time (Arch: 1.29 ± 0.11, eYFP: 0.95 ± 0.03; F = 9.97, p = 0.005), number of drinking bouts (Arch: 1.01 ± 0.02, eYFP: 1.16 ± 0.06; F = 3.13, p = 0.091) and bout length (Arch: 1.12 ± 0.06, eYFP: 0.93 ± 0.02; F = 5.78, p = 0.026) relative to eYFP controls. mean ± SEM * p < 0.05
Figure 2.
Figure 2.. A subpopulation of VP neurons innervates projection and interneurons in the NAcSh.
(a) Green retrobeads were injected in the NAcSh, VP sections were probed for VIAAT (555 nm, red) and VGluT2 (647 nm; magenta) using fISH (n= 15 sections / 3 mice, scale bar = 1mm). (b) Representative 20x confocal image showing green-labelled retrobeads in the VP co-localized with VIAAT, scale bar = 25 μM. (c) Quantification of overlap between retrobeads and VIAAT (86.57% of retrobead+ neurons) and VGluT2 (0%, no co-localization). (d) Schematic of rabies tracing viral injection strategy. (e) Representative images of injection sites in NAcSh in D1-Cre (n = 5 mice), A2a-Cre (n = 5 mice), PV-Cre (n = 5 mice) and ChAT-Cre (n = 7) mice; inset = 20x confocal images showing starter cells (scale bar = 50 μM). (f) Representative images of EGFP-infected projection neurons in the VP; inset = 20x confocal images (scale bar = 50 μM). (g) Quantification of the number of EGFP+ VP cells, normalized to number of starter cells in the NAcSh is expressed across the anterior-posterior VP gradient revealed a significant effect of genotype, with D1- and A2a-Cre mice exhibiting denser labelling than PV-Cre or ChAT-Cre mice (F15 = 13.56, p<0.001, D1-Cre = 3.67 ± 0.79, A2a-Cre = 3.50 ± 0.81, PV-Cre = 1.07 ± 0.37, ChAT-Cre = 0.25 ± 0.10 EGFP+ive cells/starter cell, mean ± sem).
Figure 3.
Figure 3.. VP neurons make inhibitory, monosynaptic contacts onto NAcSh neurons.
(a) ChR2 was injected into VP in reporter mice (scale bar = 1 mm). (b) 20x confocal image of ChR2-infected cells in the VP, ChR2-labelled terminals in the NAcSh in D1-To mice, PV-To mice and ChAT-Cre mice injected with DIO-mCherry in the NAcSh. Scale bar = 50 μM. (c-d) Quantification of oIPSCs in D1-MSNs (n=118 cells / 11 mice; 84%, 84.74 ± 8.11 pA), D2-MSNs (n=117 cells / 12 mice; 79%, 114.28 ± 12.23 pA), PVs (n=112 cells / 12 mice; 30%, 163.28 ± 30.70 pA), and CINs (n=104 cells / 10 mice; 28%, 228.65 ± 27.25 pA, Connectivity rate: Pearson x2 ratio = 106.24, p<0.001). Right = representative IPSC traces from each cell type, scale bar = 20 msec, 50 pA. Distribution of recorded neurons throughout the NAcSh for each neural subtype. (e) There was no difference in PPR (D1-MSNs = 84.74 ± 8.11, D2-MSNs = 114.28 ± 12.23, PVs = 163.28 ± 30.70, and CINs = 228.65 ± 27.25; F3=2.81, p = 0.04, no significant differences by Bonferroni post-hoc test), or (f) latency from light onset to oIPSC peak across geneotypes (D1-MSNs: 4.18±0.42, D2-MSNs: 3.77±0.36, PVs: 3.37±0.52, CINs = 3.26±0.34; F3=1.81 p=0.14, no significant differences by Bonferroni post-hoc test). (g) Latency to peak was not affected by TTX (Baseline = 16.46 ± 0.69 msec, n=11 cells/5 mice, TTX = 16.15 ± 0.74 msec, t11=0.3113, p = 0.759). (h) Currents were abolished by PTX (aCSF = 206.92 ± 37.61 pA, PTX = 24.82 ± 9.88 pA, t11=5.415, p=0.0002, n=12 cells/5 mice) (i) but not by co-application of NBQX and APV (aCSF = 324.25 ± 250.89 pA, PTX = 357.86 ± 277.72 pA, t7=1.215, p=0.264, n=8 cells/5 mice). All bar graphs represent mean ± sem. *p<0.001.
Figure 4.
Figure 4.. Activation of vArky terminals inhibits NAcSh firing in vivo.
(a) ChR2 was injected in the VP, a recording array with optic fiber was implanted in the NAcSh. (b) 4x images of NAc and VP; inset: 20x confocal image of array site. Scale bar = 50 μM. (c) Units were classified into clusters by peak-to-valley width, firing rate and CV (n = 9 pMSNs, 14 pINS, 32 multi-units from 6 mice, see Extended data figure 5). (d-e) Representative waveform, raster plot and PSTH of single neuron examples (d) and mean ± sem (e) of light-modulated units over 60 trials; 1 sec light pulse is indicated. Scale bar = 500μs, 50μV. (f) Proportion of light-modulated units by neural subtype. (g) Firing rate immediately preceding and after light pulse are shown for each cell-type; dark lines: light-modulated units, light lines: non-significantly modulated units (pMSN pre: 0.97 ± 0.11 post: 0.62 ± 0.18, p = 0.015, pINs pre: 4.52 ± 1.68, post: 2.51 ± 0.91, p=0.007, decreased multi-units pre: 4.21 ± 1.12 post: 2.75 ± 0.94, p=0.013, increased multi-units pre: 9.12 ± 5.24 post: 12.13 ± 5.36, p = 0.002). (h) Normalized firing rate of all light-modulated units, relative to baseline is shown (pMSNs = 0.46 ± 0.13, multiunits = 0.66 ± 0.05, pINs = 0.59 ± 0.05, F2 = 1.789, p =0.185).
Figure 5.
Figure 5.. vArky calcium activity is correlated with duration of reward consumption.
(a) retroAAV-Cre was injected into the mNAcSh, AAV-DIO-GCaMP6s was injected in the VP, an optic fiber was implanted in the VP (n=9 GFP / 9 GCaMP, scale bar = 1 mm). Representative traces of Ca2+ signal acquired from optic fiber implanted in VP (scale bar=20s, 1 z-score) and 20x confocal images of cell bodies in the VP and terminal fields in the NAc (scale bar=50 μM). (b) Combined fluorescence responses from all mice, aligned to onset of lick bout (AUC GCaMP: 2.43±0.75, AUC GFP: 0.52±0.71, F=7.213, p=0.016). (c) Fluorescence responses in GCaMP mice, split into upper and lower quartiles based on AUC (44 trials/condition, AUC high trials: 5.76±0.575, AUC low trials: 2.37±0.4911, RM ANOVA, F=13.86, p < 0.0001). (d) Licking behavior aligned to bout onset for high- and low-GCaMP signal trials (AUChigh signal trials: 5.76±0.57, AUClow signal trials: 2.37±0.49, FHigh•Low=20.08, p<0.001). (e) Permutation analysis: distribution of mean difference in lick bout probability between high-and low-VP signal trials with 2000 permutations of shuffled trials (Pshuffled (LickBout)VP-Hightrials – Pshuffled(LickBout)VP-Low trials = 0.6%), mean difference in real data shown in green (Preal(LickBout)VP-High trials – Preal(LickBout)VP-Low trials = 42.6%). (f-g) GGaMP and GFP signal aligned to active (mean AUC GCaMP: 0.78±0.66, GFP: 0.30±0.46) and inactive nose pokes (mean AUC GCaMP:1.09±0.54, GFP: −0.65±1.56) in an operant task (Fvirus = 0.58, p=0.46, Factive v inactive=1.83, p=0.20). Data represented as mean ± sem. ***p<0.0001.
Figure 6.
Figure 6.. Closed-loop activation of vArky terminals promotes reward consumption.
(a) Optogenetic activation of VP terminals in NAcSh during reward consumption (n=12 eYFP, 18 ChR2) (b) Stimulation-induced change from baseline in total drinking time (closed loop: eYFP: 0.95±0.14, ChR2: 3.84±1.32, open loop: eYFP: 0.95±0.14, ChR2: 3.84±1.32, Fstim•virus = 4.471, p = 0.016) (c) number of drinking bouts (eYFP: 0.98±0.14, ChR2: 1.37±0.25, open loop: eYFP: 0.95±0.14, ChR2: 3.84±1.32, Fstim = 0.739, p = 0.482) and (d) mean bout length (eYFP: 0.91±0.13, ChR2: 2.83±0.52, open loop: eYFP: 0.95±0.14, ChR2: 3.84±1.32, Fvirus•stim=6.49, p=0.017). (e) Histogram distribution of lengths of each individual bout across all subjects (eYFPNoStim/Stim n=564/558, ChR2NoStim/Stim n=1331/1001). (f-h) Closed loop optogenetic stimulation did not increase total interaction time (ChR2: 1.14±0.278, eYFP: 1.22±0.239, F1.08834, p=0.312), bout number (ChR2: 1.41±0.278, eYFP: 1.15±0.233, F=2.34582, p=0.145) or mean bout length (ChR2: 1.39±0.432, eYFP: 0.988±0.224, F=1.02321, p=0.327) when a spout without liquid was presented (n = 8 eYFP/8 ChR2). Bars = mean ± sem, *p<0.05.
Figure 7.
Figure 7.. Selective vArky inhibition attenuates consumption-related inhibition of NAcSh firing and reduces length of reward consumption bouts.
(a) Experimental schematic using a retrograde viral strategy to selectively inhibit vArky neurons in a closed-loop manner (b) Representative unit waveform and raster plot of firing aligned to drinking bout onset during control trials (NO LASER) and trials where vArky neurons were inhibited (LASER). (c) Relative to control trials (−35.5 ± 5.89%), when vArky neurons were inhibited, the consumption-related inhibition of mNAcSh neurons was attenuated (−25.6 ± 4.3%, RMANOVA FLaserxtime = 4.136 p = 0.0018). (d-f) Relative to baseline, closed-loop optogenetic inhibition of vArky neurons reduced total drinking time (n=8 eYFP, 12 ARCH, eYFP Pre:158.309 ± 18.1 Post: 156.63 ± 19.17, ARCH Pre: 182.45 ± 13.89 Post:152.58 ± 17.22, Fvirusxtime=6.94 p=0.018), and mean bout length (eYFP Pre: 33.18 ± 3.73 Post: 36.29 ± 5.21 ARCH Pre: 37 ± 4.19, Post: 40.06 ± 5.96, Fvirusxtime=0.01 p=0.981), but not the number of drinking bouts (eYFP Pre: 33.19 ± 3.73 Post: 36.29 ± 5.21 ARCH Pre: 37.00 ± 4.19 Post: 40.06 ± 5.96, Fvirusxtime=0.01 p=0.991). (g) Distribution of individual bout lengths with and without laser stimulation (KS eYFP: D=0.098, p=0.201, KS ARCH: D=0.282, p<0.001). Scale bar = 25 μV, 10 msec. Bars = means ± sem. *p<0.01.
Figure 8.
Figure 8.. vArky activation enhances reward value and vArky calcium activity scales with reward palatability.
(a) Stimulation-induced change in orofacial taste reactivity (eYFPNoStim: 3.88±0.46, eYFPStim: 3.99±0.27, p=0.781, ChR2NoStim = 3.36±0.35, ChR2Stim: 4.77±2.05, Fvirus•stim=7.69, p=0.007). (b) Identical rewards were presented in two bottles, one bottle was paired with closed-loop vArky stimulation. (c) Preference for stimulated bottle in a two-bottle choice task measured as volume consumed (eYFP: 46±11%, ChR2: 74±12%, x2=5.05, p=0.025). (d-e) Preference for the stimulation-paired bottle in the overnight two-bottle choice task expressed as proportion of drinking time (Fvirus=12.5, p=0.0006) and drinking bouts (Fvirus=6.81, p = 0.010) (f) Proportion of active to inactive nose pokes over 5 days of operant training in an ICSS task (eYFP: 44.16±2.08%, ChR2: 41.17±3.47%). (g) Head-fixed intraoral infusion of sucrose, water or quinine solutions. (h-i) Combined fluorescence responses aligned to onset of solution infusion (GCaMP, AUC Sucrose: 8.03±1.30, AUC Water: 5.03±0.63, AUC Quinine: 2.20±1.13, AUC Quinine rejected: −3.60±0.59; F=42.89, p<0.001). (j-l) Transient analysis. AUC of individual mice. Peak Sucrose: 1.39±0.21, Peak Water: 0.95±0.12, Peak Quinine: 0.59±0.15, Peak Quinine Rejected: −0.95±0.9; F=85.04, F=9.43, p=0.0071; t1/2 Sucrose: 4.25±0.51, t1/2 Water: 3.22±0.65, t1/2 Quinine: 1.10±0.28, t1/2 Quinine Rejected: 1.38±0.14 F=11.43, p=0.0016. n=8 mice/group, all data presented as mean ± sem.

Comment in

  • 'Feedback' for feeding.
    Marbach F, Stephenson-Jones M. Marbach F, et al. Nat Neurosci. 2021 Mar;24(3):293-294. doi: 10.1038/s41593-021-00799-4. Nat Neurosci. 2021. PMID: 33547449 No abstract available.

References

    1. Humphries MD & Prescott TJ The ventral basal ganglia, a selection mechanism at the crossroads of space, strategy, and reward. Prog. Neurobiol 90, 385–417. doi:10.1016/j.pneurobio.2009.11.003 (2010). - DOI - PubMed
    1. Castro DC & Berridge KC Opioid hedonic hotspot in nucleus accumbens shell: mu, delta, and kappa maps for enhancement of sweetness “liking” and “wanting”. J Neurosci 34, 4239–4250. doi:10.1523/JNEUROSCI.4458-13.2014 (2014). - DOI - PMC - PubMed
    1. Kupchik YM et al. Coding the direct/indirect pathways by D1 and D2 receptors is not valid for accumbens projections. Nat. Neurosci 18, 1230–1232. doi:10.1038/nn.4068 (2015). - DOI - PMC - PubMed
    1. Creed M, Ntamati NR, Chandra R, Lobo MK & Lüscher C Convergence of reinforcing and anhedonic cocaine effects in the ventral pallidum. Neuron 92, 214–226. doi:10.1016/j.neuron.2016.09.001 (2016). - DOI - PMC - PubMed
    1. Williams DJ, Crossman AR & Slater P The efferent projections of the nucleus accumbens in the rat. Brain Res 130, 217–227. doi:10.1016/0006-8993(77)90271-2 (1977). - DOI - PubMed

Methods-only References:

    1. Alpizar SA, Baker AL, Gulledge AT & Hoppa MB Loss of neurofascin-186 disrupts alignment of ankyrinG relative to its binding partners in the axon initial segment. Front Cell Neurosci. 13, 1. doi: 10.3389/fncel.2019.00001 (2019). - DOI - PMC - PubMed
    1. Renier N et al. Mapping of brain activity by automated volume analysis of immediate early genes. Cell 165, 1789–1802. doi:10.1016/j.cell.2016.05.007 (2016). - DOI - PMC - PubMed
    1. Renier N et al. iDISCO: a simple, rapid method to immunolabel large tissue samples for volume imaging. Cell 159, 896–910. doi:10.1016/j.cell.2014.10.010 (2014). - DOI - PubMed
    1. Schindelin J et al. Fiji: an open-source platform for biological-image analysis. Nat. Methods 9, 676–682. doi:10.1038/nmeth.2019 (2012). - DOI - PMC - PubMed
    1. Paxinos G & Franklin BJF The Mouse Brain in Stereotaxic Coordinates Compact Fifth Edition (Academic, San Diego, 2019).

Publication types

LinkOut - more resources