

Insight into the practical performance of RT-PCR testing for SARS-CoV-2 using serological data: a cohort study
- PMID: 33495759
- PMCID: PMC7816573
- DOI: 10.1016/S2666-5247(20)30200-7
Insight into the practical performance of RT-PCR testing for SARS-CoV-2 using serological data: a cohort study
Abstract
Background: Virological detection of severe acute respiratory syndrome coronavirus 2 (SARS-CoV-2) through RT-PCR has limitations for surveillance. Serological tests can be an important complementary approach. We aimed to assess the practical performance of RT-PCR-based surveillance protocols and determine the extent of undetected SARS-CoV-2 infection in Shenzhen, China.
Methods: We did a cohort study in Shenzhen, China and attempted to recruit by telephone all RT-PCR-negative close contacts (defined as those who lived in the same residence as, or shared a meal, travelled, or socially interacted with, an index case within 2 days before symptom onset) of all RT-PCR-confirmed cases of SARS-CoV-2 detected since January, 2020, via contact tracing. We measured anti-SARS-CoV-2 antibodies in serum samples from RT-PCR-negative close contacts 2-15 weeks after initial virological testing by RT-PCR, using total antibody, IgG, and IgM ELISAs. In addition, we did a serosurvey of volunteers from neighbourhoods with no reported cases, and from neighbourhoods with reported cases. We assessed rates of infection undetected by RT-PCR, performance of RT-PCR over the course of infection, and characteristics of individuals who were seropositive on total antibody ELISA but RT-PCR negative.
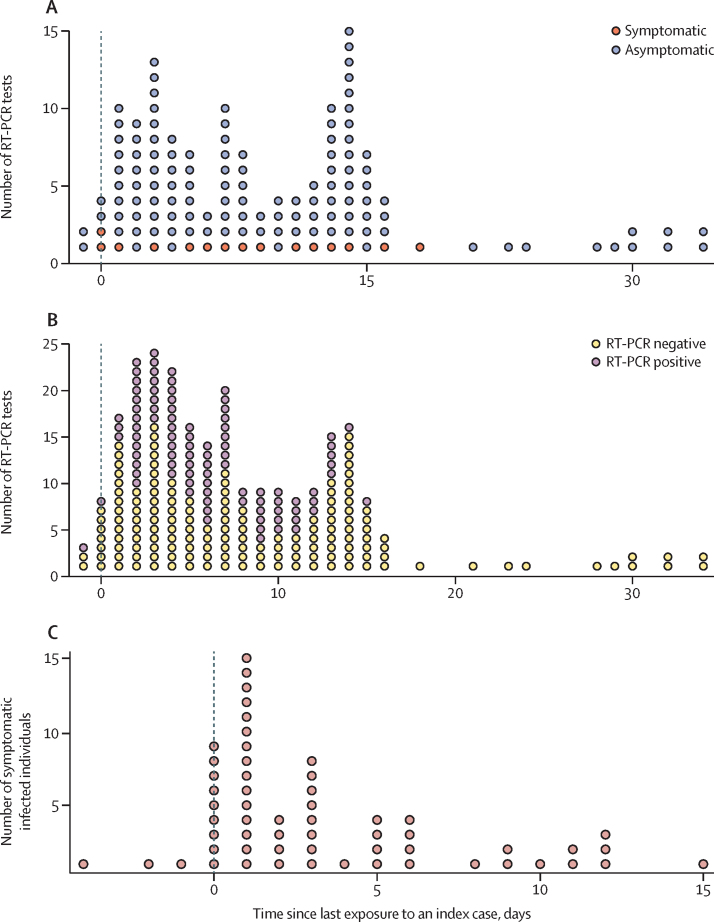
Findings: Between April 12 and May 4, 2020, we enrolled and collected serological samples from 2345 (53·0%) of 4422 RT-PCR-negative close contacts of cases of RT-PCR-confirmed SARS-CoV-2. 1175 (50·1%) of 2345 were close contacts of cases diagnosed in Shenzhen with contact tracing details, and of these, 880 (74·9%) had serum samples collected more than 2 weeks after exposure to an index case and were included in our analysis. 40 (4·5%) of 880 RT-PCR-negative close contacts were positive on total antibody ELISA. The seropositivity rate with total antibody ELISA among RT-PCR-negative close contacts, adjusted for assay performance, was 4·1% (95% CI 2·9-5·7), which was significantly higher than among individuals residing in neighbourhoods with no reported cases (0·0% [95% CI 0·0-1·1]). RT-PCR-positive individuals were 8·0 times (95% CI 5·3-12·7) more likely to report symptoms than those who were RT-PCR-negative but seropositive, but both groups had a similar distribution of sex, age, contact frequency, and mode of contact. RT-PCR did not detect 48 (36% [95% CI 28-44]) of 134 infected close contacts, and false-negative rates appeared to be associated with stage of infection.
Interpretation: Even rigorous RT-PCR testing protocols might miss a substantial proportion of SARS-CoV-2 infections, perhaps in part due to difficulties in determining the timing of testing in asymptomatic individuals for optimal sensitivity. RT-PCR-based surveillance and control protocols that include rapid contact tracing, universal RT-PCR testing, and mandatory 2-week quarantine were, nevertheless, able to contain community spread in Shenzhen, China.
Funding: The Bill & Melinda Gates Foundation, Special Foundation of Science and Technology Innovation Strategy of Guangdong Province, and Key Project of Shenzhen Science and Technology Innovation Commission.
© 2021 The Author(s). Published by Elsevier Ltd. This is an Open Access article under the CC BY 4.0 license.
Figures


References
-
- Centers for Disease Control and Prevention CDC diagnostic tests for COVID-19. 2020. https://www.cdc.gov/coronavirus/2019-ncov/lab/testing.html
-
- Yang Y, Yang M, Shen C. Evaluating the accuracy of different respiratory specimens in the laboratory diagnosis and monitoring the viral shedding of 2019-nCoV infections. medRxiv. 2020 doi: 10.1101/2020.02.11.20021493. published online Feb 17. (preprint) - DOI
Publication types
MeSH terms
LinkOut - more resources
Full Text Sources
Other Literature Sources
Medical
Miscellaneous
