. 2021 Mar;95(3):1003-1021.
doi: 10.1007/s00204-020-02962-5. Epub 2021 Jan 25.

Assessment of cochlear toxicity in response to chronic 3,3'-iminodipropionitrile in mice reveals early and reversible functional loss that precedes overt histopathology

Affiliations

Assessment of cochlear toxicity in response to chronic 3,3'-iminodipropionitrile in mice reveals early and reversible functional loss that precedes overt histopathology

Erin A Greguske et al. Arch Toxicol. 2021 Mar.

Abstract

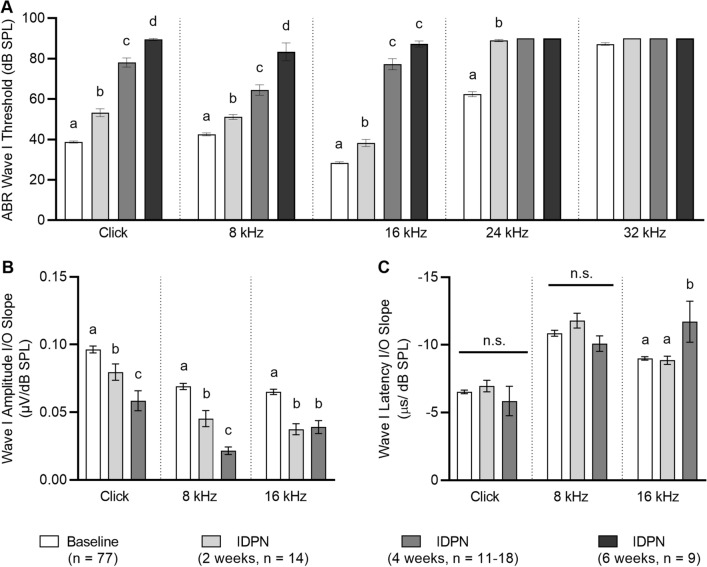
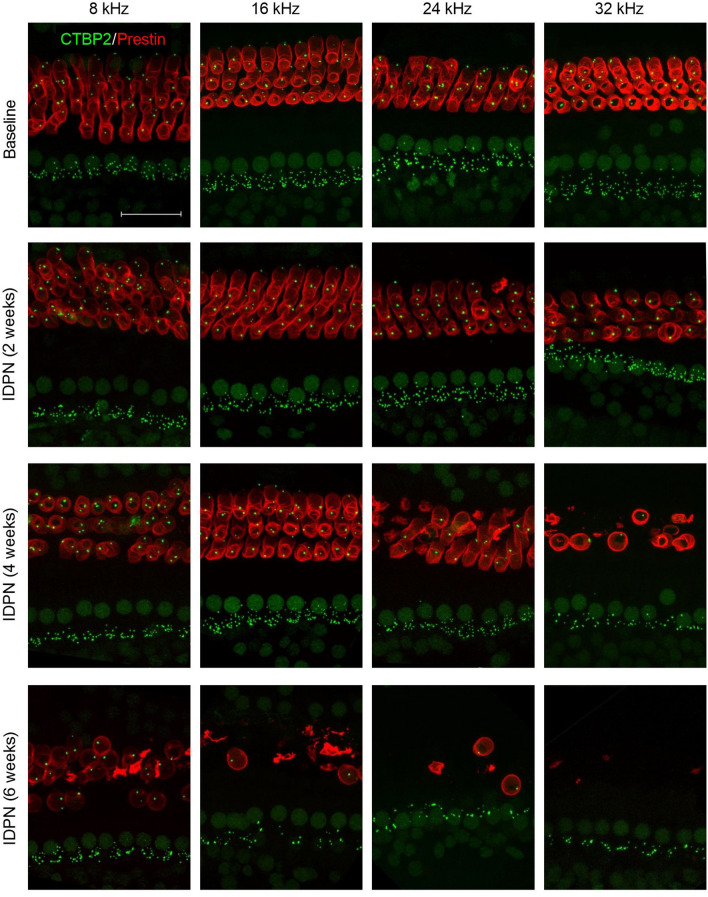
The peripheral auditory and vestibular systems rely on sensorineural structures that are vulnerable to ototoxic agents that cause hearing loss and/or equilibrium deficits. Although attention has focused on hair cell loss as the primary pathology underlying ototoxicity, evidence from the peripheral vestibular system indicates that hair cell loss during chronic exposure is preceded by synaptic uncoupling from the neurons and is potentially reversible. To determine if synaptic pathology also occurs in the peripheral auditory system, we examined the extent, time course, and reversibility of functional and morphological alterations in cochleae from mice exposed to 3,3'-iminodipropionitrile (IDPN) in drinking water for 2, 4 or 6 weeks. Functionally, IDPN exposure caused progressive high- to low-frequency hearing loss assessed by measurement of auditory brainstem response wave I absolute thresholds and amplitudes. The extent of hearing loss scaled with the magnitude of vestibular dysfunction assessed behaviorally. Morphologically, IDPN exposure caused progressive loss of outer hair cells (OHCs) and synapses between the inner hair cells (IHCs) and primary auditory neurons. In contrast, IHCs were spared from ototoxic damage. Importantly, hearing loss consistent with cochlear synaptopathy preceded loss of OHCs and synapses and, moreover, recovered if IDPN exposure was stopped before morphological pathology occurred. Our observations suggest that synaptic uncoupling, perhaps as an early phase of cochlear synaptopathy, also occurs in the peripheral auditory system in response to IDPN exposure. These findings identify novel mechanisms that contribute to the earliest stages of hearing loss in response to ototoxic agents and possibly other forms of acquired hearing loss.

Keywords: Acquired hearing loss; Afferent synapse; Cochlea; Cochlear synaptopathy; Hair cell; Ototoxicity; Vestibule.


Conflict of interest statement

The authors declare that they have no conflict of interest.

Figures

Fig. 1
Fig. 1
IDPN exposure causes progressive high to low frequency hearing loss assessed by ABR measurements. ac Mean absolute ABR wave I thresholds (a), wave I amplitude I/O slopes (b), and wave I latency I/O slopes (c) are shown across exposure durations for click stimuli and the indicated pure tone frequencies. Wave I thresholds increase progressively from high to low frequencies with increasing IDPN exposure. Wave I amplitudes decrease progressively from high to low frequencies with increasing IDPN exposure. Wave I latencies show no significant (ns) changes across frequencies in response to IDPN exposure. In all panels, letters indicate comparisons that are significantly different. Exposure durations are indicated as baseline (white bars), 2 weeks (light grey bars), 4 weeks (dark grey bars), and 6 weeks (black bars). The numbers (n) of animals assessed are indicated
Fig. 2
Fig. 2
IDPN exposure causes progressive loss of vestibular function that scales with hearing loss. a Vestibular dysfunction (assessed by rating behavior and reflexes) is shown as a function of IDPN exposure and indicates worsening vestibular function with increasing IDPN exposure. b Auditory dysfunction (assessed by shifts in the ABR wave I thresholds to click stimuli) is shown as a function of vestibular dysfunction and is best fit with a single order exponential, indicating that auditory dysfunction worsened more quickly compared to vestibular dysfunction following IDPN exposure. In both panels, exposure durations include baseline (white circles), 2 weeks (light grey circles), 4 weeks (dark grey circles), and 6 weeks (black circles). The numbers (n) of animals assessed are indicated
Fig. 3
Fig. 3
IDPN exposure causes progressive damage to the sensorineural structures of the organ of Corti. Z-projections through the organs of Corti immunostained with anti-CTBP2 to detect IHC nuclei and presynaptic ribbons (green) and anti-prestin (red) to detect OHCs are shown at four tonotopic regions (corresponding to 8, 16, 24, and 32 kHz) at the indicated exposure durations (baseline, 2 weeks, 4 weeks, and 6 weeks). Increasing IDPN exposure causes progressive loss of the OHCs and presynaptic ribbons from high to low frequency regions. Scale bar equals 25 µm (color figure online)
Fig. 4
Fig. 4
IDPN exposure causes loss of cochlear OHCs. ab The numbers of IHCs (a) and OHCs (b) are shown at four tonotopic regions (corresponding to 8, 16, 24, and 32 kHz) across exposure durations. IHC numbers show no significant (ns) changes across frequency regions in response to IDPN exposure. In contrast, OHC numbers are progressively reduced from high to low frequency regions with increasing IDPN exposure. Asterisks indicate comparisons that are significantly different. Exposure durations include baseline (white circles), 2 weeks (light grey circles), 4 weeks (dark grey circles), and 6 weeks (black circles). The numbers (n) of animals assessed are indicated
Fig. 5
Fig. 5
IDPN exposure causes loss of cochlear afferent synapses. a, b Z-projections through the organs of Corti immunostained with anti-CTBP2 to detect IHC nuclei and presynaptic ribbons (green) and anti-GluA2 to detect postsynaptic glutamate receptors (red) are shown at baseline (a) and after 6 weeks of IDPN exposure (b). Regions of interest are outlined in boxes in the upper panels and shown magnified in the corresponding lower panels. Scale bars equal 15 µm in the upper panels and 10 µm in the lower panels. c–e The number of presynaptic elements (CTBP2 puncta per IHC, c), postsynaptic elements (GluA2 puncta per IHC, d), and paired synaptic elements (paired puncta per IHC, e) are quantified at four tonotopic regions (corresponding to 8, 16, 24, and 32 kHz) at the indicated exposure durations (baseline, 2 weeks, 4 weeks, and 6 weeks). Synaptic elements show no significant (ns) changes at the 8 kHz region. Above 8 kHz, however, synaptic elements are progressively reduced from high to low (but greater than 8 kHz) frequency regions with increasing IDPN exposure. In all panels, asterisks indicate comparisons that are significantly different. Exposure durations include baseline (white circles), 2 weeks (light grey circles), 4 weeks (dark grey circles), and 6 weeks (black circles). The numbers (n) of animals assessed are indicated (color figure online)
Fig. 6
Fig. 6
IDPN exposure causes loss of vestibular afferent synapses. a Z-projections through the utricular sensory epithelia immunostained with anti-CTBP2 to detect IHC nuclei and presynaptic ribbons (green), anti-GluA2 to detect postsynaptic glutamate receptors (red), and Myo7A to detect HCs (blue) are shown at baseline and after 6 weeks of IDPN exposure. Scale bar equals 15 µm. b The number of vestibular HCs is quantified at baseline (white bars) and after 6 weeks of IDPN exposure (black bars). There are no significant (ns) differences. c The number of presynaptic elements (CTBP2 puncta per HC), postsynaptic elements (GluA2 puncta per HC), and paired synaptic elements (paired puncta per HC) are quantified at baseline (white bars) and after 6 weeks of IDPN exposure (black bars) and show significant reductions following IDPN exposure (indicated by asterisks) (color figure online)
Fig. 7
Fig. 7
IDPN exposure causes loss of CASPR1 from the calyx-shaped afferent terminals of the vestibular neurons but not from the paranodal region of the type I SGN afferent terminals. a Z-projections through the organs of Corti immunostained with anti-CASPR1 (green) and anti-calretinin to detect IHCs (red) are shown at baseline (left panel) and after 6 weeks of IDPN exposure (right panel). Scale bar equals 15 µm. b Z-projections through the utricular sensory epithelia immunostained with anti-CASPR1 (green) and anti-Myo7A to detect HCs (red) are shown at baseline (left panel) and after 6 weeks of IDPN exposure (right panel). Scale bar equals 15 µm. c The distribution of CASPR1 in the cochlear heminodes (length) is quantified at four tonotopic regions (corresponding to 8, 16, 24, and 32 kHz) at baseline (white circles) and after 6 weeks of IDPN exposure (black circles). There were no significant (ns) differences in CASPR1 distrbution. d The number of CASPR1-positive calyces is quantified in control (white bars) and IDPN-exposed (black bars) animals at 6 weeks and show significant reductions following IDPN exposure (indicated by asterisks) (color figure online)
Fig. 8
Fig. 8
IDPN exposure followed by recovery causes hearing loss followed by recovery assessed by ABR measurements. ac Mean absolute ABR wave I thresholds (a) and wave I amplitude I/O slopes (bd) are shown across exposure/recovery durations for click stimuli and the indicated pure tone frequencies. Wave I thresholds increase with IDPN exposure and then recover to pre-exposure values after 4 weeks of recovery. Wave I amplitudes decrease with IDPN exposure and recover to pre-exposure values after 4 weeks of recovery. In all panels, asterisks indicate significant differences and ns indicates non-significant differences. Exposure/recovery durations are indicated as baseline (white bars), 2 weeks of IDPN exposure (black bars), 2 weeks of recovery (dark grey bars), and 4 weeks of recovery (light grey bars). The numbers (n) of animals assessed are indicated

Similar articles

Cited by

References

    1. Basile AS, Huang JM, Xie C, Webster D, Berlin C, Skolnick P. N-methyl-d-aspartate antagonists limit aminoglycoside antibiotic-induced hearing loss. Nat Med. 1996;2(12):1338–1343. doi: 10.1038/nm1296-1338. - DOI - PubMed
    1. Boadas-Vaello P, Riera J, Llorens J. Behavioral and pathological effects in the rat define two groups of neurotoxic nitriles. Toxicol Sci. 2005;88(2):456–466. doi: 10.1093/toxsci/kfi314. - DOI - PubMed
    1. Boadas-Vaello P, Jover E, Diez-Padrisa N, Bayona JM, Llorens J. Differential role of CYP2E1-mediated metabolism in the lethal and vestibulotoxic effects of cis-crotononitrile in the mouse. Toxicol Appl Pharmacol. 2007;225(3):310–317. doi: 10.1016/j.taap.2007.07.014. - DOI - PubMed
    1. Boadas-Vaello P, Jover E, Saldana-Ruiz S, et al. Allylnitrile metabolism by CYP2E1 and other CYPs leads to distinct lethal and vestibulotoxic effects in the mouse. Toxicol Sci. 2009;107(2):461–472. doi: 10.1093/toxsci/kfn233. - DOI - PubMed
    1. Braude JP, Vijayakumar S, Baumgarner K, et al. Deletion of Shank1 has minimal effects on the molecular composition and function of glutamatergic afferent postsynapses in the mouse inner ear. Hear Res. 2015;321:52–64. doi: 10.1016/j.heares.2015.01.008. - DOI - PMC - PubMed

Publication types

MeSH terms