

Relationship between amyloid and tau levels and its impact on tau spreading
- PMID: 33495928
- PMCID: PMC8175299
- DOI: 10.1007/s00259-021-05191-9
Relationship between amyloid and tau levels and its impact on tau spreading
Abstract
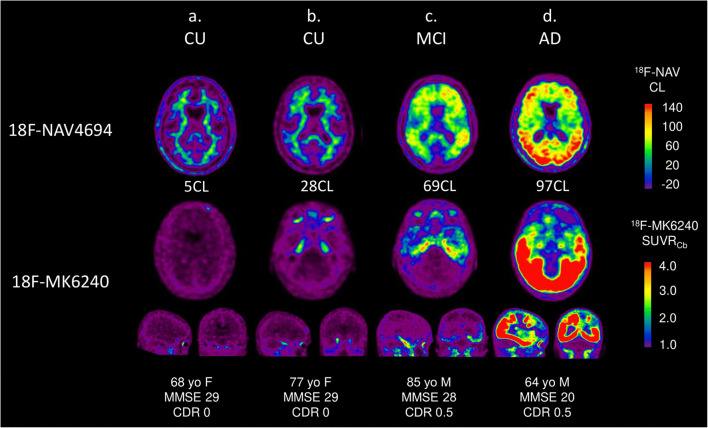
Purpose: Previous studies have shown that Aβ-amyloid (Aβ) likely promotes tau to spread beyond the medial temporal lobe. However, the Aβ levels necessary for tau to spread in the neocortex is still unclear.
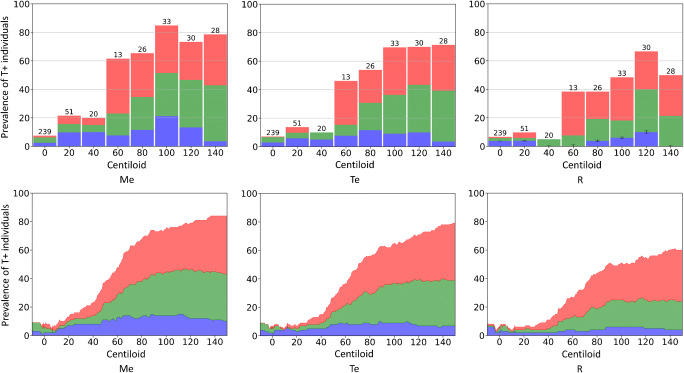
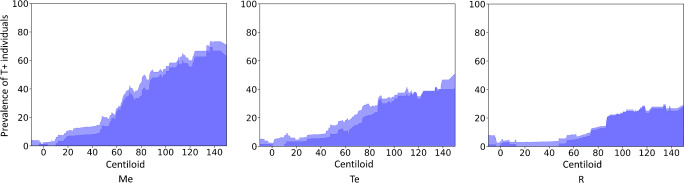
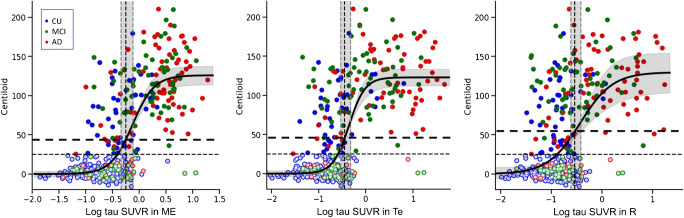
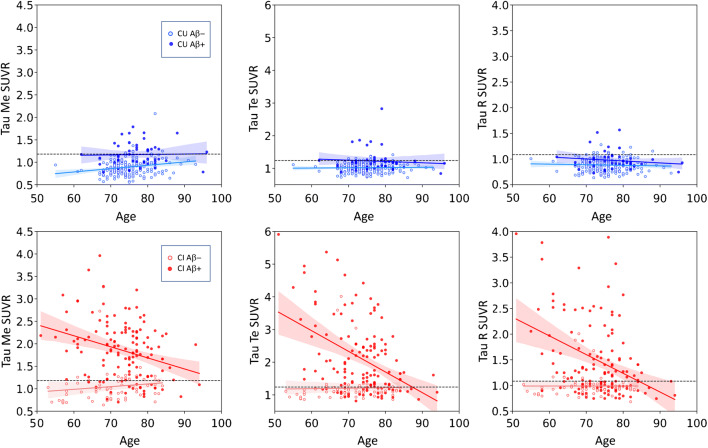
Methods: Four hundred sixty-six participants underwent tau imaging with [18F]MK6420 and Aβ imaging with [18F]NAV4694. Aβ scans were quantified on the Centiloid (CL) scale with a cut-off of 25 CL for abnormal levels of Aβ (A+). Tau scans were quantified in three regions of interest (ROI) (mesial temporal (Me); temporoparietal neocortex (Te); and rest of neocortex (R)) and four mesial temporal region (entorhinal cortex, amygdala, hippocampus, and parahippocampus). Regional tau thresholds were established as the 95%ile of the cognitively unimpaired A- subjects. The prevalence of abnormal tau levels (T+) along the Centiloid continuum was determined.
Results: The plots of prevalence of T+ show earlier and greater increase along the Centiloid continuum in the medial temporal area compared to neocortex. Prevalence of T+ was low but associated with Aβ level between 10 and 40 CL reaching 23% in Me, 15% in Te, and 11% in R. Between 40 and 70 CL, the prevalence of T+ subjects per CL increased fourfold faster and at 70 CL was 64% in Me, 51% in Te, and 37% in R. In cognitively unimpaired, there were no T+ in R below 50 CL. The highest prevalence of T+ were found in the entorhinal cortex, reaching 40% at 40 CL and 80% at 60 CL.
Conclusion: Outside the entorhinal cortex, abnormal levels of cortical tau on PET are rarely found with Aβ below 40 CL. Above 40 CL prevalence of T+ accelerates in all areas. Moderate Aβ levels are required before abnormal neocortical tau becomes detectable.
Keywords: Alzheimer’s disease; Aβ-amyloid imaging; Neurodegeneration; Positron emission tomography; Tau imaging; Tauopathies.
Conflict of interest statement
Christopher C. Rowe has received research grants from NHMRC, Enigma Australia, Biogen, Eisai, and Abbvie. He is on the scientific advisory board for Cerveau Technologies and Biogen Australia. Victor Villemagne is and has been a consultant or paid speaker at sponsored conference sessions for Eli Lilly, Life Molecular Imaging, GE Healthcare, Abbvie, Lundbeck, Shanghai Green Valley Pharmaceutical Co. Ltd., and Hoffmann La Roche. All the other authors declare that they have no conflict of interest.
Figures
References
Publication types
MeSH terms
Substances
Grants and funding
LinkOut - more resources
Full Text Sources
Other Literature Sources
Medical
