

GC-MS/MS analysis of metabolites derived from a single human blastocyst
- PMID: 33495963
- PMCID: PMC7835178
- DOI: 10.1007/s11306-021-01770-x
GC-MS/MS analysis of metabolites derived from a single human blastocyst
Abstract
Introduction: The field of assisted reproductive technology (ART) has significantly advanced; however, morphological evaluation remains as the chosen method of assessment of embryo quality.
Objective: We aimed to examine metabolic changes in embryo culture medium to develop a non-invasive method for evaluation of embryo quality.
Methods: We performed metabolic analysis of culture medium obtained from a single blastocyst cultured for freezing.
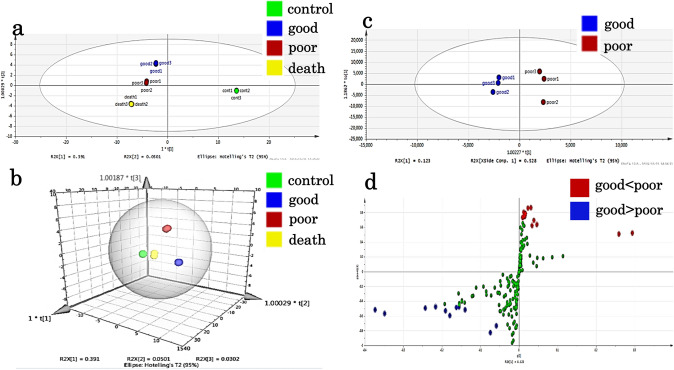
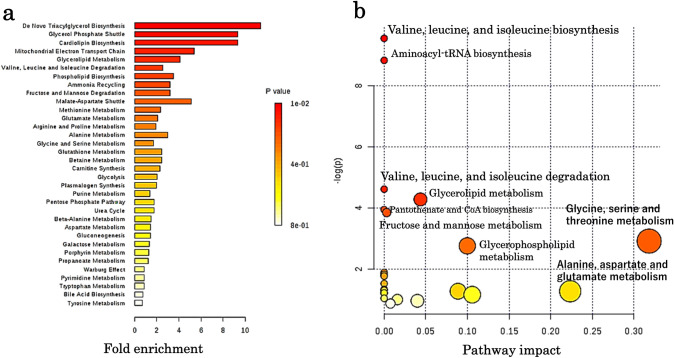
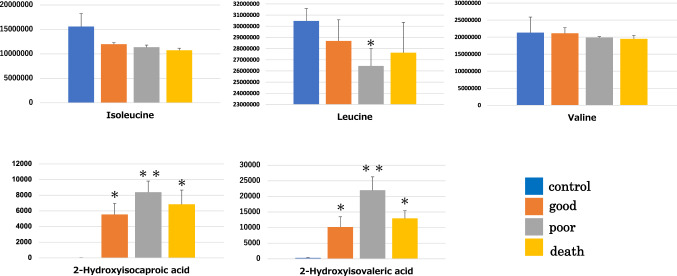
Results: In total, 187 (39.8%) of the 469 detectable organic acid metabolites were identified. A significant change (p < 0.05) was observed in eight metabolites between the good-quality and poor-quality embryo groups. Differences were observed in several metabolic pathways between the good-quality and poor-quality embryo groups. Metabolites that showed significant changes were primarily involved in the metabolism of branched-chain amino acids.
Conclusion: The quantification of metabolism in human embryos may assist in identification and selection of good-quality embryos with high rates of survival before freezing and implantation in conjunction with morphological classification. This may help to identify embryos with high rates of survival.
Keywords: Branched-chain amino acids; Culture medium; Embryo quality; Metabolomics.
Conflict of interest statement
The authors of this study have no conflicts of interest to disclose.
Figures
Similar articles
-
Embryo selection using metabolomics.Methods Mol Biol. 2014;1154:533-40. doi: 10.1007/978-1-4939-0659-8_24. Methods Mol Biol. 2014. PMID: 24782026
-
Non-invasive assessment of culture media from goat cloned embryos associated with subjective morphology by gas chromatography - mass spectroscopy-based metabolomic analysis.Anim Sci J. 2018 Jan;89(1):31-41. doi: 10.1111/asj.12885. Epub 2017 Aug 18. Anim Sci J. 2018. PMID: 28833899
-
Applying metabolomic analyses to the practice of embryology: physiology, development and assisted reproductive technology.Reprod Fertil Dev. 2015 May;27(4):602-20. doi: 10.1071/RD14359. Reprod Fertil Dev. 2015. PMID: 25763765
-
Symposium: innovative techniques in human embryo viability assessment. Non-invasive assessment of embryo viability by metabolomic profiling of culture media ('metabolomics').Reprod Biomed Online. 2008 Oct;17(4):502-7. doi: 10.1016/s1472-6483(10)60236-2. Reprod Biomed Online. 2008. PMID: 18854103 Review.
-
Evaluation of bovine embryos produced in high performance serum-free media.J Reprod Dev. 2003 Jun;49(3):193-202. doi: 10.1262/jrd.49.193. J Reprod Dev. 2003. PMID: 14967928 Review.
Cited by
-
Does conventional morphological evaluation still play a role in predicting blastocyst formation?Reprod Biol Endocrinol. 2022 Apr 19;20(1):68. doi: 10.1186/s12958-022-00945-y. Reprod Biol Endocrinol. 2022. PMID: 35439999 Free PMC article.
-
Cathepsin-L Secreted by High-Quality Bovine Embryos Exerts an Embryotrophic Effect In Vitro.Int J Mol Sci. 2023 Mar 31;24(7):6563. doi: 10.3390/ijms24076563. Int J Mol Sci. 2023. PMID: 37047535 Free PMC article.
-
Steady morphokinetic progression is an independent predictor of live birth: a descriptive reference for euploid embryos.Hum Reprod Open. 2024 Oct 10;2024(4):hoae059. doi: 10.1093/hropen/hoae059. eCollection 2024. Hum Reprod Open. 2024. PMID: 39507416 Free PMC article.
-
Rapid and non-invasive diagnostic techniques for embryonic developmental potential: a metabolomic analysis based on Raman spectroscopy to identify the pregnancy outcomes of IVF-ET.Front Cell Dev Biol. 2023 Jun 23;11:1164757. doi: 10.3389/fcell.2023.1164757. eCollection 2023. Front Cell Dev Biol. 2023. PMID: 37427383 Free PMC article.
-
Current Advancements in Noninvasive Profiling of the Embryo Culture Media Secretome.Int J Mol Sci. 2021 Mar 3;22(5):2513. doi: 10.3390/ijms22052513. Int J Mol Sci. 2021. PMID: 33802374 Free PMC article. Review.
References
-
- Alegre L, Del Galego R, Arrons S, Hernández P, Muñoz M, Messenger M. Novel noninvasive embryo selection algorithm combining time-lapse morph kinetics and oxidative status of the spent embryo culture medium. Fertility and Sterility. 2019;111:918–927. doi: 10.1016/j.fertnstert.2019.01.022. - DOI - PubMed
Publication types
MeSH terms
Substances
LinkOut - more resources
Full Text Sources
Other Literature Sources
Medical
Miscellaneous